
As of June 4, 2026, Bitcoin (BTC) is navigating a structural redefinition of historic proportions. After reaching euphoric highs above $120,000 at the end of 2025, the asset is now entrenched in a severe macroeconomic correction, oscillating dangerously in a compression zone between $62,000 and $68,000. This abrupt deceleration is not a mere speculative fluctuation — it is the symptomatic manifestation of a convergence of exogenous and endogenous shocks that this report dissects in depth.
The Macro-Monetary Vise: Stagflation and a New Federal Reserve
Bitcoin’s trajectory in Q2 2026 is inseparable from U.S. monetary policy, which itself stands at a complex institutional crossroads. The macroeconomic landscape is dominated by the persistent specter of stagflation — a toxic environment for non-yield-bearing risk assets.
Economic Data Under Pressure
Data published in early June 2026 confirms a slowdown coupled with a resurgence of inflationary pressures. U.S. GDP for Q1 2026 was revised downward to 1.6% year-over-year (from an initial estimate of 2.0%). Meanwhile, inflation refuses to converge toward the 2% target:
| Indicator | Value | Impact on Bitcoin |
|---|---|---|
| U.S. GDP Q1 2026 | 1.6% (revised down) | ⬇️ Negative — Signals slowdown, fuels risk aversion |
| U.S. CPI (April 2026) | 3.8% (3-year high) | ⬇️ Negative — Keeps Fed rates elevated |
| U.S. PCE (April 2026) | 3.8% | ⬇️ Negative — Pushes rate cuts further out |
| Euro Area Inflation (May 2026) | 3.2% | ⬇️ Negative — Synchronized monetary tightening |
| JOLTS Job Openings (April) | 7.618 million | ⬇️ Hawkish — Labor market too tight for easing |
Kevin Warsh Takes the Fed Helm: A Paradigm Shift
On May 22, 2026, Kevin Warsh was sworn in as the new Federal Reserve Chair, succeeding Jerome Powell. His nomination by President Donald Trump — validated by a partisan Senate vote — raises deep questions about central bank independence. Markets are scrutinizing every Warsh statement ahead of the critical FOMC meeting on June 16–17, 2026.
The target range for the federal funds rate remains at 3.50%–3.75%. The 10-year Treasury yield stands at approximately 4.49%, up from 3.97% before recent geopolitical flare-ups. Market probability tools (CME FedWatch) do not anticipate a first significant rate cut before late 2026.
Geopolitical Friction: The Double Energy and Trade Shock
Bitcoin is absorbing the full force of extreme geopolitical polarization, which is triggering a flight to safe-haven liquidity (USD, government bonds) at the expense of peripheral assets like crypto.
- Middle East: The U.S.-Iran conflict keeps Brent crude firmly above $100/barrel, feeding inflation and forcing central banks to maintain restrictive policies.
- Transatlantic Trade War: The U.S. administration has proposed tariffs of at least 10% on 60 trading partners, particularly targeting the European Union. Europe’s response (activating the « trade bazooka ») adds a further risk premium.
A particularly illuminating statistical signal: Bitcoin’s correlation with the Nasdaq 100 has collapsed to -0.87. While Big Tech is lifted by AI enthusiasm, Bitcoin has been relegated to a purely speculative asset — the first to be liquidated during any portfolio deleveraging event.
The Institutional Hemorrhage: ETF Outflows and Corporate Liquidations
Bitcoin’s institutional infrastructure, celebrated during its regulatory approval milestones, is paradoxically acting today as a powerful transmission mechanism for the decline.
The Historic Bitcoin Spot ETF Exodus
May–June 2026 data paints a picture of unprecedented institutional capitulation:
- $3.4 billion in net redemptions in a single week of June 2026 — the largest withdrawal since these products launched in January 2024.
- $2.43 billion in cumulative net outflows for May 2026 alone (the worst month of the year).
- BlackRock’s IBIT alone accounted for ~$2.04 billion of these withdrawals, including a record single-day outflow of $527.84M on May 28.
- 9 consecutive days of net outflows at the end of May, totaling $2.8 billion.
The MicroStrategy Psychological Effect
In early June 2026, MicroStrategy — the world’s largest corporate Bitcoin treasury — sold a portion of its holdings for the first time in four years. Beyond the quantitative impact, this is a psychologically devastating signal: even the most dogmatic institutional « diamond hands » are actively managing their risk exposure, shattering the residual confidence of market participants.
The New Regulatory Paradigm: Institutional Perpetual Derivatives
May 29, 2026 marks a structural turning point: the CFTC officially approved the BTCPERP contract from KalshiEX, the first fully regulated Bitcoin perpetual futures contract in the United States. Coinbase, Kraken, Robinhood, and Gemini have subsequently announced their intention to enter this space within 30 days.
The irony is stark: while this approval cements Bitcoin’s long-term institutional legitimacy, in the short term it provides sophisticated tools for institutions to express leveraged bearish views in full regulatory compliance, amplifying selling pressure on the spot market.
On-Chain Diagnostics: Capitulation and Valuation Metrics
Blockchain data reveals extreme levels of psychological distress among recent market participants.
The Short-Term Holder Purge
The « STH Loss to Exchange » indicator recorded a colossal plunge to -38,700 BTC on June 2nd, following a catastrophic peak of -41,300 BTC on May 28. On June 2nd, mid-sized investors alone sent approximately ~8,400 BTC to Binance to sell at a loss — a systemic capitulation that can, paradoxically, signal seller exhaustion near major support zones.
| On-Chain Metric | Level | Implication |
|---|---|---|
| True Market Mean | $77,800 | Bull/Bear demarcation line — Price below = corrective regime |
| Realized Price | $53,900 | Absolute cost basis — Ultimate fundamental floor |
| STH Loss to Exchanges (Jun 2) | -38,700 BTC | Extreme capitulation — Potential seller exhaustion signal |
Multi-Timeframe Technical Analysis
Daily Chart: The Macro Trend Reversal
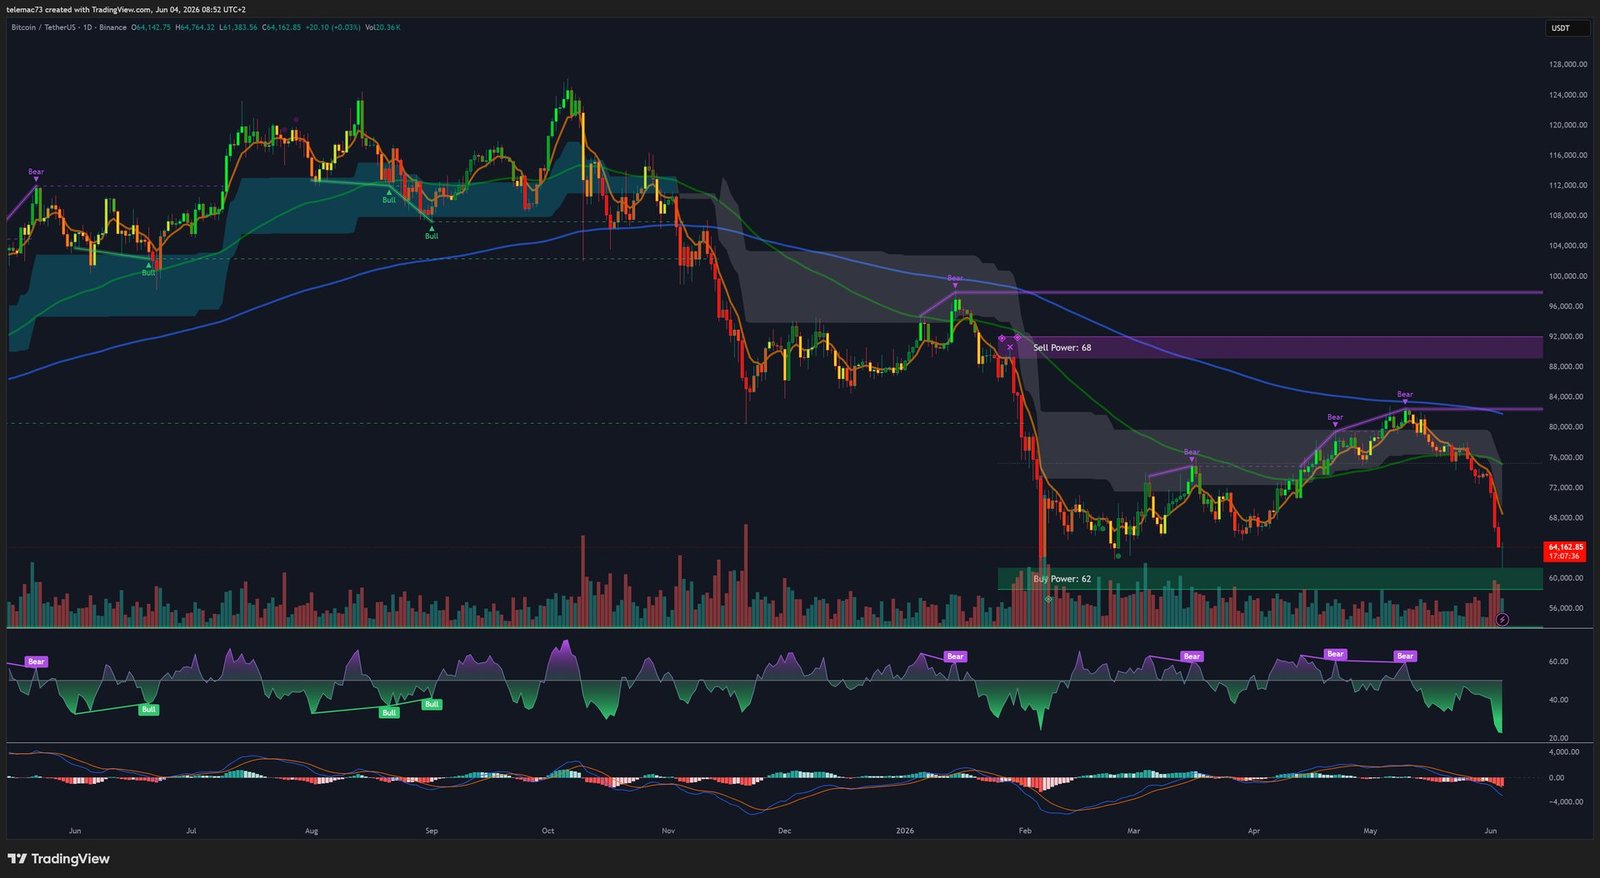
The macro picture is unambiguous: the prior bullish structure has been decisively broken. The founding event was the catastrophic breakdown of the $72,000–$74,000 support block — the bedrock of the spring rally. This former fortress has now mutated into a formidable macro resistance. Bitcoin has successively broken below its 20, 50, 100, and 200-day SMAs — a sustained close below the latter formally certifies a transition to a bear market regime in quantitative finance.
The daily RSI reads 24, deeply in oversold territory. However, in powerful downtrends fueled by exogenous macro data, the RSI can remain anchored in oversold territory for extended periods without triggering a reversal. The daily MACD has engraved a « Death Cross, » its histogram expanding negatively — a complete absence of buying pressure capable of inverting the momentum.
4-Hour Chart: Compression and Continuation Patterns
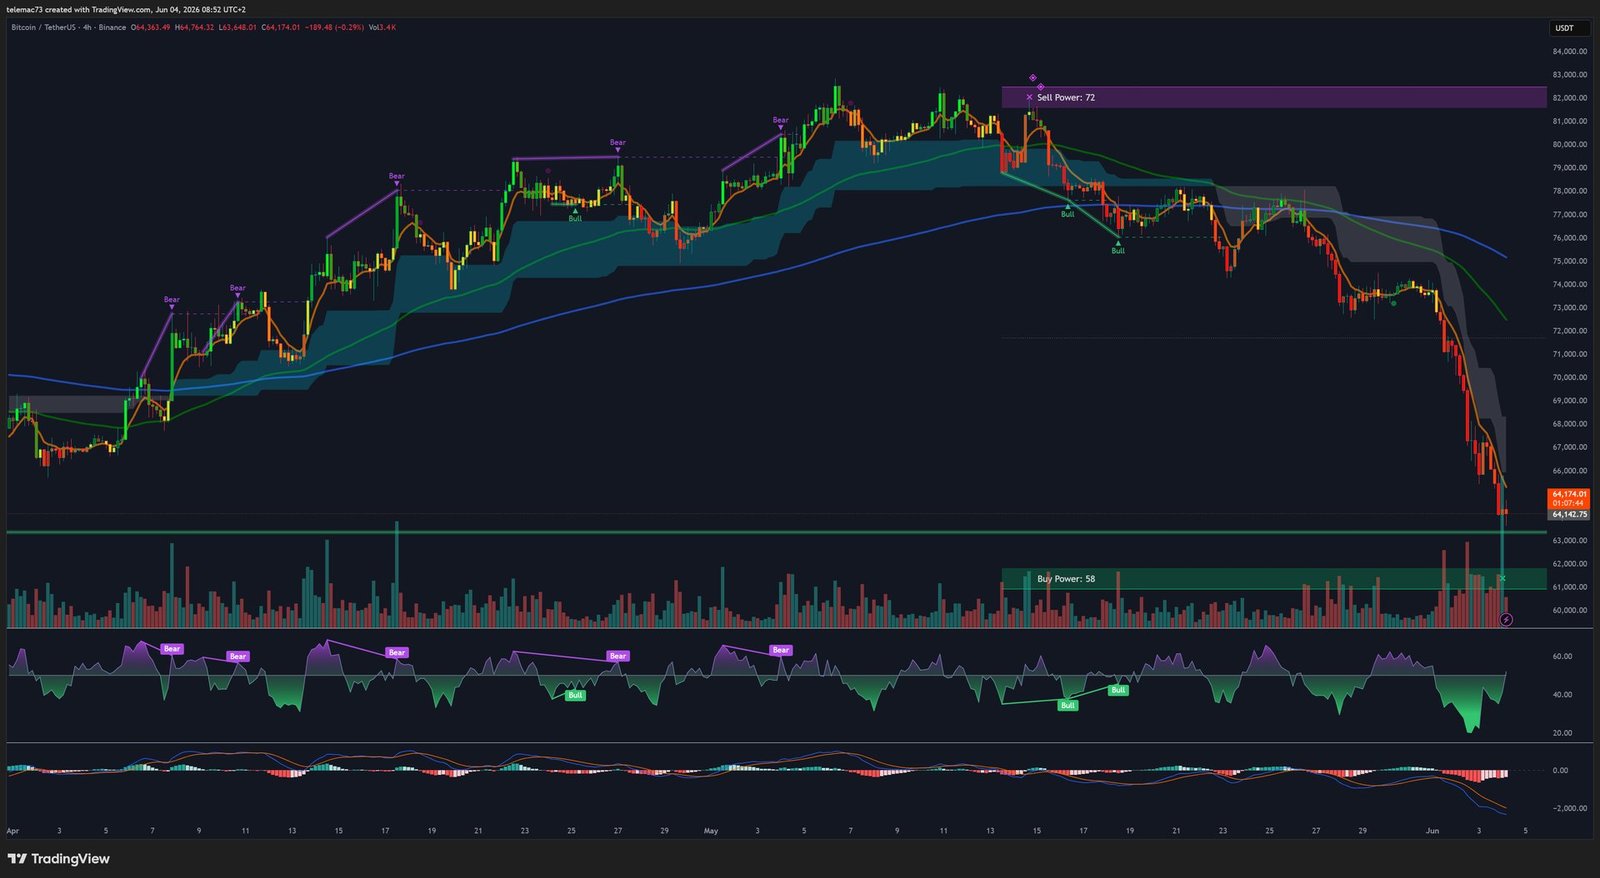
The 4-hour timeframe reveals price action perfectly channeled within a descending linear regression. Consolidation phases are taking the classic form of bear flags and descending compression triangles — continuation patterns whose resolution, typically in the direction of the parent trend, is accompanied by an explosive directional move. The key support of this triangle sits precariously between $63,200 and $62,490.
The H4 Death Cross (SMA 50 crossing below SMA 200) is confirmed. The 23.6% Fibonacci retracement level (drawn from $74,070 to the $62,490 low) acts as an immediate barrier, with the 50% retracement sitting at approximately $68,000.
15-Minute Chart: The Intraday Battlefield
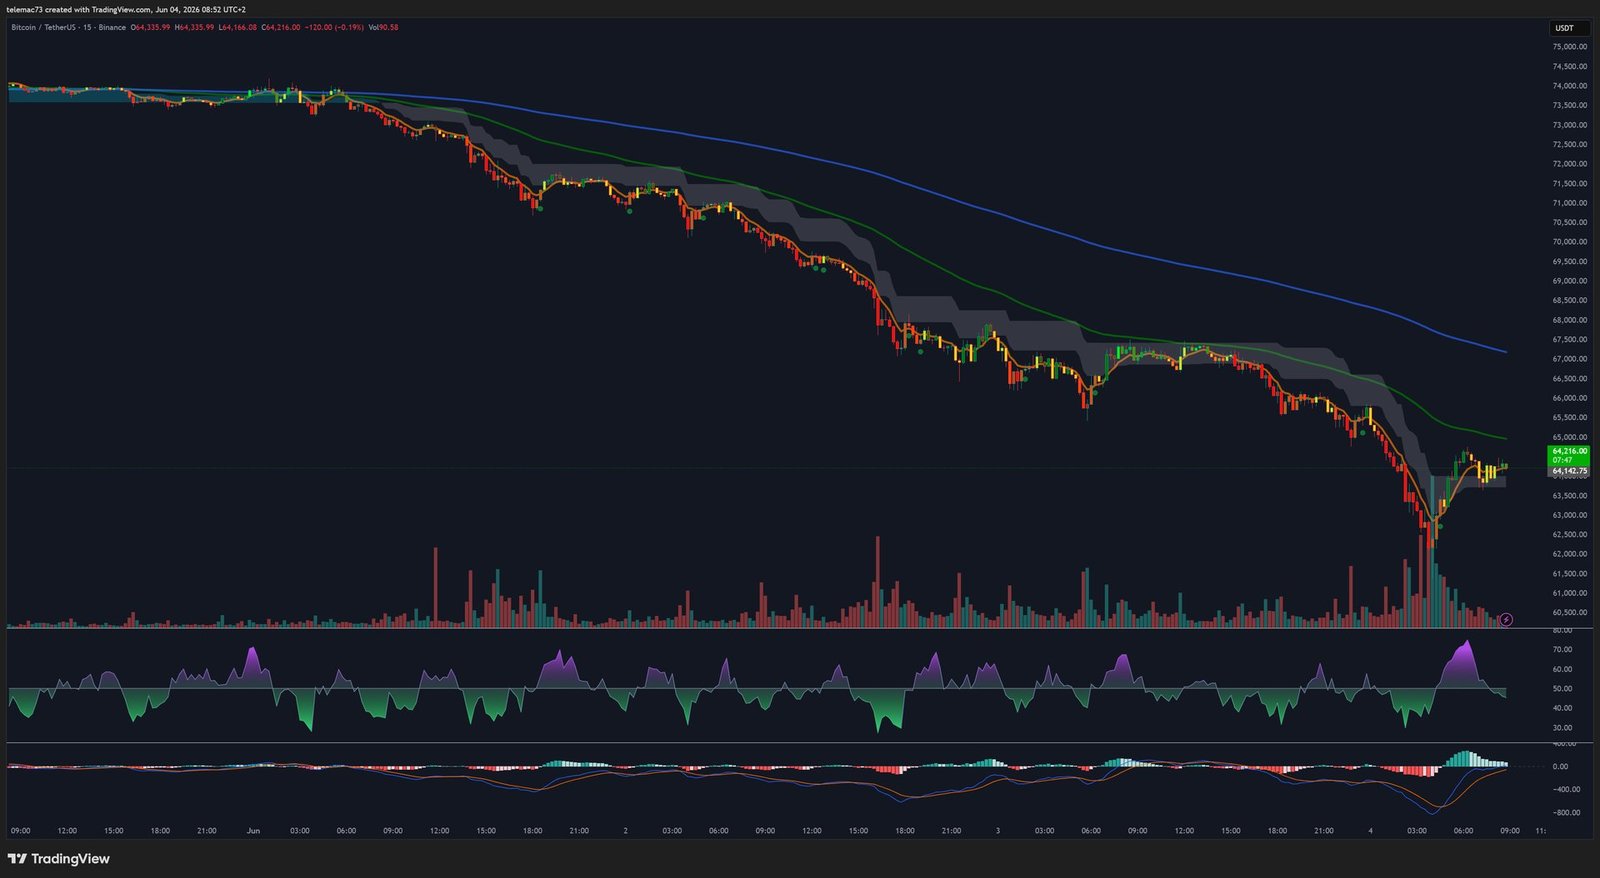
The M15 microstructure is the battlefield of arbitrage bots and market makers. Key intraday levels to monitor:
- Immediate support: $63,200 (fragile)
- Psychological pivot: $62,000 (stabilization threshold for a technical bounce)
- Intermediate resistance: $63,500
- Critical intraday lock: $64,000 — a convincing M15 close above this level with significant volume expansion is the sine qua non condition to relieve short-term pressure.
Liquidation Heatmap: Navigating the Minefield
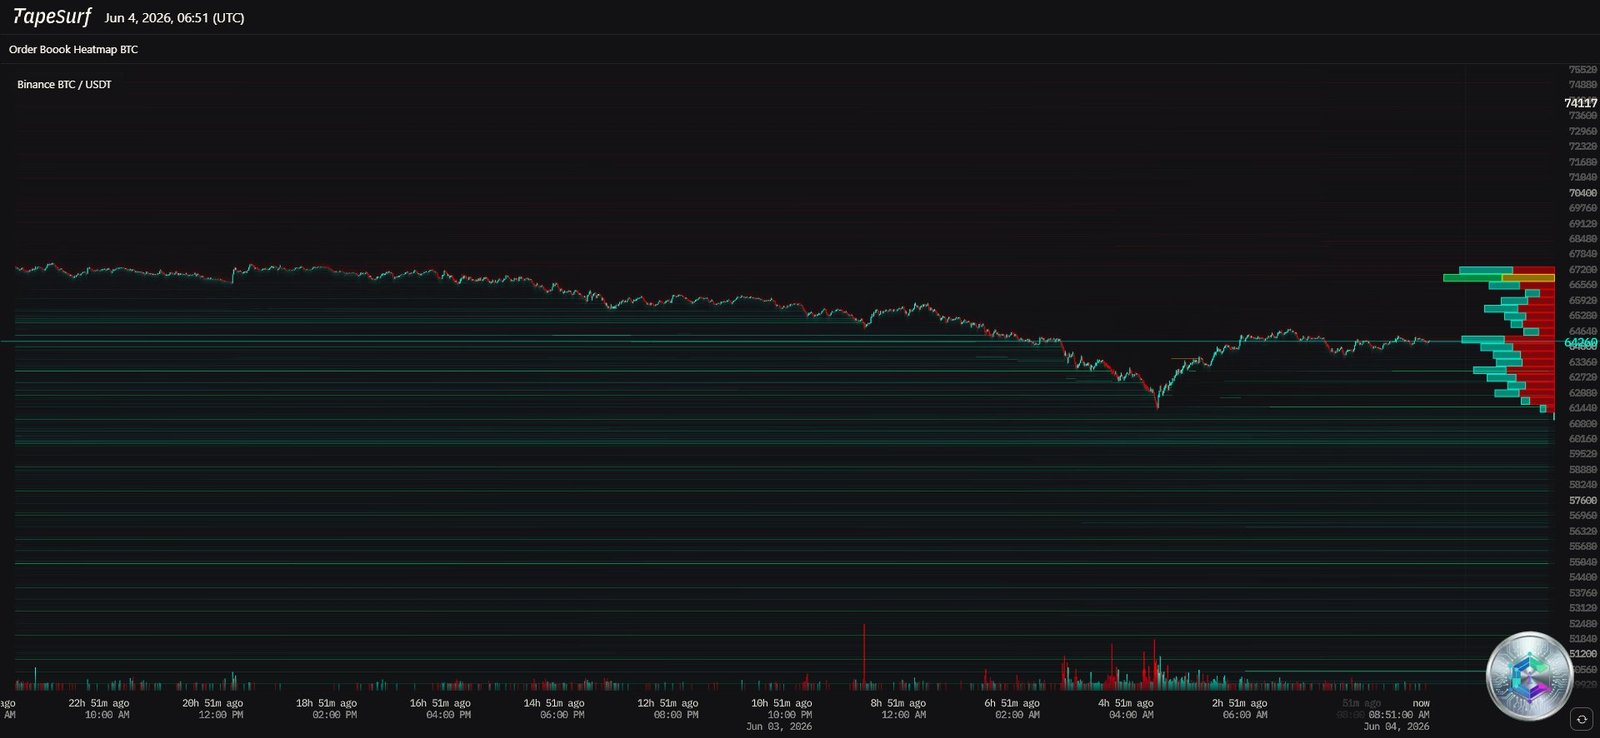
The Glass Ceiling: Short Liquidation Density
The heatmap reveals immense liquidity pockets above current price action:
- $74,000–$75,000: First dense cluster of short liquidations (potential short squeeze target).
- $82,000+: Massive short liquidation concentration — a true « powder keg » for high-frequency algorithms.
- $70,000–$72,000: Zone of thin liquidity — in the event of a reversal, price could traverse this zone with lightning velocity.
The Safety Floor: Long Liquidations and Institutional Bids
To the downside, a heavy concentration of long liquidations sits between $60,000 and $62,000. On June 3rd, volatility already forced the liquidation of over $1.1 billion in crypto positions. However, order book analysis reveals over $443 million in institutional limit buy orders clustered in these lower zones — « smart money » treating any incursion below $60,000 as an unjustified long-term pricing anomaly.
Operational Price Level Matrix
| Classification | Price Level (USD) | Justification |
|---|---|---|
| 🔴 Macro Structural Resistance | $82,815 | Projected 200-day SMA + massive short liquidation cluster |
| 🔴 Fundamental Ceiling | $77,800 | True Market Mean — Must be reclaimed to validate bullish thesis |
| 🟠 Liquidity Magnet | $74,000–$75,000 | Short liquidation pocket — Short squeeze trigger zone |
| 🟠 Pivot Resistance (Former Support) | $72,000–$74,000 | Polarity inversion — Absolute resistance until reclaimed |
| 🟡 Fibonacci Resistance | $68,000 | 50% retracement of the recent bearish impulse |
| 🟡 H4 Dynamic Resistance | $65,000–$65,200 | Descending trendline + converging 100H SMA |
| 🟢 Combat Zone (Current Pivot) | $62,490–$66,500 | Critical macro demand zone — Last line of defense |
| 🟢 Psychological Support | $60,000–$60,072 | February 2026 low + dense institutional bid wall |
| 🔵 Ultimate Fundamental Floor | $53,900 | Realized Price — Absolute blockchain cost basis |
Conclusion: At the Crossroads
Bitcoin currently stands at a crossroads, severely impacted by a toxic confluence of macroeconomic, institutional, and technical headwinds. The collapse below major moving averages, a daily RSI of 24, and the formation of bearish compression patterns collectively certify a complete handover of power to sellers across all timeframes.
Nevertheless, rigorous risk modeling demands we consider contrarian scenarios. Bitcoin is compressed into a historically critical demand pocket ($64,500–$66,500), with a liquidity void up to $72,000 and explosive short liquidation clusters at $74,000. Should a macroeconomic spark ignite — an unexpectedly dovish FOMC communication in mid-June, or a diplomatic de-escalation — a short squeeze of extraordinary violence is technically viable.
The short-term verdict is binary: Holding the $62,250–$64,000 zone is the existential bulwark for any bullish reversal. Should this defense fail, order book gravity pulls price toward $60,000, with systemic risk of a final capitulation toward the $53,900 floor if « higher for longer » conditions tighten further through Q3 2026.
⚠️ Disclaimer: This article is written for educational and informational purposes only. It does not constitute investment advice, nor a recommendation to buy or sell any digital asset or financial instrument. Cryptocurrency markets are highly volatile and carry significant risk of loss. Please consult a licensed financial advisor before making any investment decisions.