


Bitcoin is navigating a rare state of tension this July 2026, caught between a major regulatory overhaul in Asia, macroeconomic volatility spilling over from the semiconductor sector, and an institutional accumulation wave whose scale openly contradicts the nervousness displayed by retail investors. With price hovering around $63,900, the combined picture drawn from capital flows, on-chain data and multi-timeframe technical structure is that of a coiled market on the verge of a major directional move.
Japan Redraws the Regulatory Map
On July 15, 2026, Japan’s parliament passed a landmark legislative amendment reclassifying more than one hundred and five cryptocurrencies, Bitcoin foremost, as fully-fledged financial assets. The shift moves crypto assets from the Payment Services Act to the far stricter Financial Instruments and Exchange Act, bringing rules modeled on securities law: formal bans on insider trading, tighter corporate disclosure requirements, and heavy penalties for unregistered platforms operating in Japan.
This normalization paves the way for spot Bitcoin ETFs to be approved and listed directly on the Tokyo Stock Exchange, with the market pricing in a twelve-to-eighteen-month timeline. The potential inflow of Japanese capital — one of the highest domestic savings rates in the world — could rival the shockwave triggered by the approval of U.S. spot ETFs in January 2024. On the tax side, the top marginal rate on crypto income is set to fall from a punitive 55% to a flat 20% by 2028, a measure designed to curb the flight of capital and talent toward jurisdictions such as Singapore or Dubai.
This structural tailwind, however, runs into a degraded short-term macro backdrop: a sudden, massive sell-off across the global semiconductor sector wiped out more than $2 trillion in market capitalization within a few sessions, dragging Bitcoin along in its wake. In periods of acute liquidity stress, the asset — tradable 24/7 with no exit barriers — is often the first to be liquidated by hedge funds needing to meet urgent margin calls on traditional equity markets. Adding to the uncertainty, all eyes are now on the Federal Reserve’s FOMC meeting on July 28–29, whose tone will dictate the opportunity cost of holding a non-yielding asset like Bitcoin.
ETFs: From Bleeding Out to Bouncing Back
U.S. spot Bitcoin ETFs endured a rough spring: $2.4 billion in net outflows in May, followed by a historic $4.51 billion exodus in June. Mid-July, however, marked an inflection point, with three consecutive sessions of net inflows (July 14–16) totaling roughly $368 million, driven by a cooler-than-expected CPI print, a brief break above $65,000, and institutional buy-the-dip activity during the semiconductor-driven correction. Should this trend hold, July would become the first month of net inflows since April.
On July 16, the launch of the T. Rowe Price Active Crypto ETF (ticker: TKNZ) on NYSE Arca marked a milestone: the first actively managed U.S. spot ETF built around a basket of crypto assets, with an initial allocation of 40.75% Bitcoin, 18.42% Ethereum, 11.01% BNB and 6.45% Hyperliquid — a sign that traditional asset managers are now hunting for alpha beyond simple « digital gold » exposure.
On-Chain: Fear on the Surface, Accumulation Behind the Scenes
The Crypto Fear & Greed Index stood at 27/100 on July 17, reflecting persistent fear. Yet whales have accumulated roughly 270,000 BTC (worth $16.7 billion) since late June, relying on cold storage, OTC desks and fractional execution algorithms that don’t directly move public order books. A single CFD position of 1,660 BTC, with a liquidation threshold set at $63,123, has turned that level into a gravitational zone: a magnet for forced liquidations, but also a fortress defended by heavy buy walls.
On July 15, a wallet dormant for eight years also moved 5,908 BTC (over $383 million), coins originally acquired in 2017 around $16,000. The funds migrated to a Native SegWit address without passing through any exchange, which points to a simple security rotation rather than an imminent sell-off — though continued monitoring remains warranted. This accumulation pattern is not confined to Bitcoin: similar whale activity has been observed on Chainlink and Cardano, suggesting a coordinated move by smart money across the broader asset class.
Multi-Timeframe Technical Reading
Daily Chart (D1): Pinned Under a Bearish Trendline
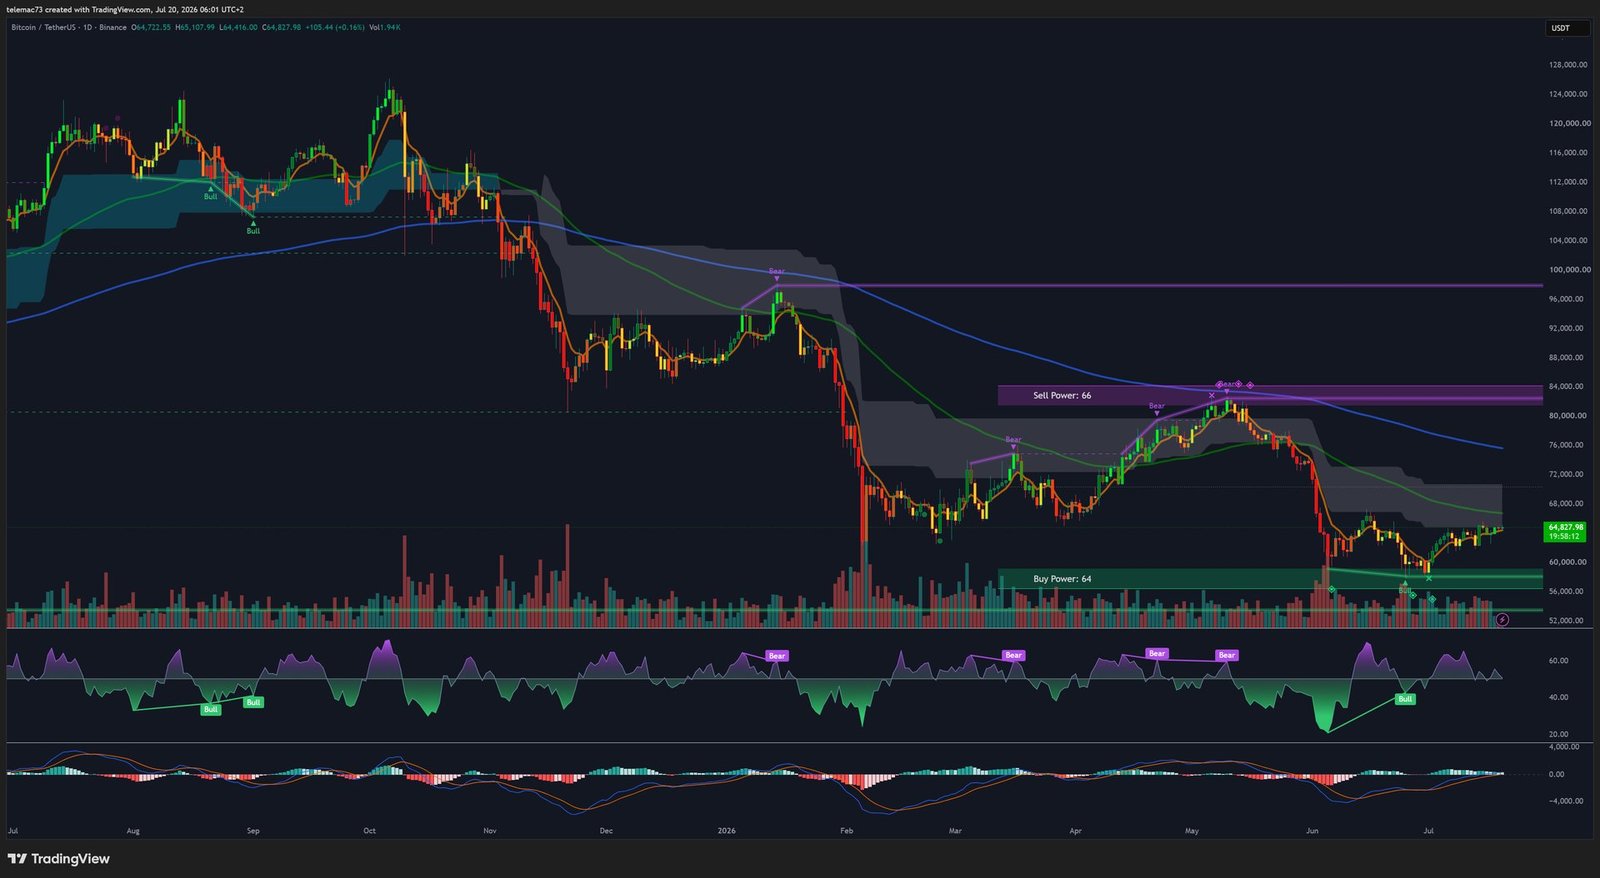
The market remains constrained by a long-term bearish trendline that price has failed to break convincingly, despite a technical bounce fueled by ETF inflows. The $58,000 zone has confirmed itself as a major institutional support; a daily close below it would open the door toward $53,600. The daily RSI is hovering around 50, a sign of a volatility squeeze rather than an apathetic market. More concerning: the 50-day EMA is dangerously converging with the 200-day EMA, raising the risk of a Death Cross should price fail to hold above $63,900.
4-Hour Chart (H4): Symmetrical Compression Triangle
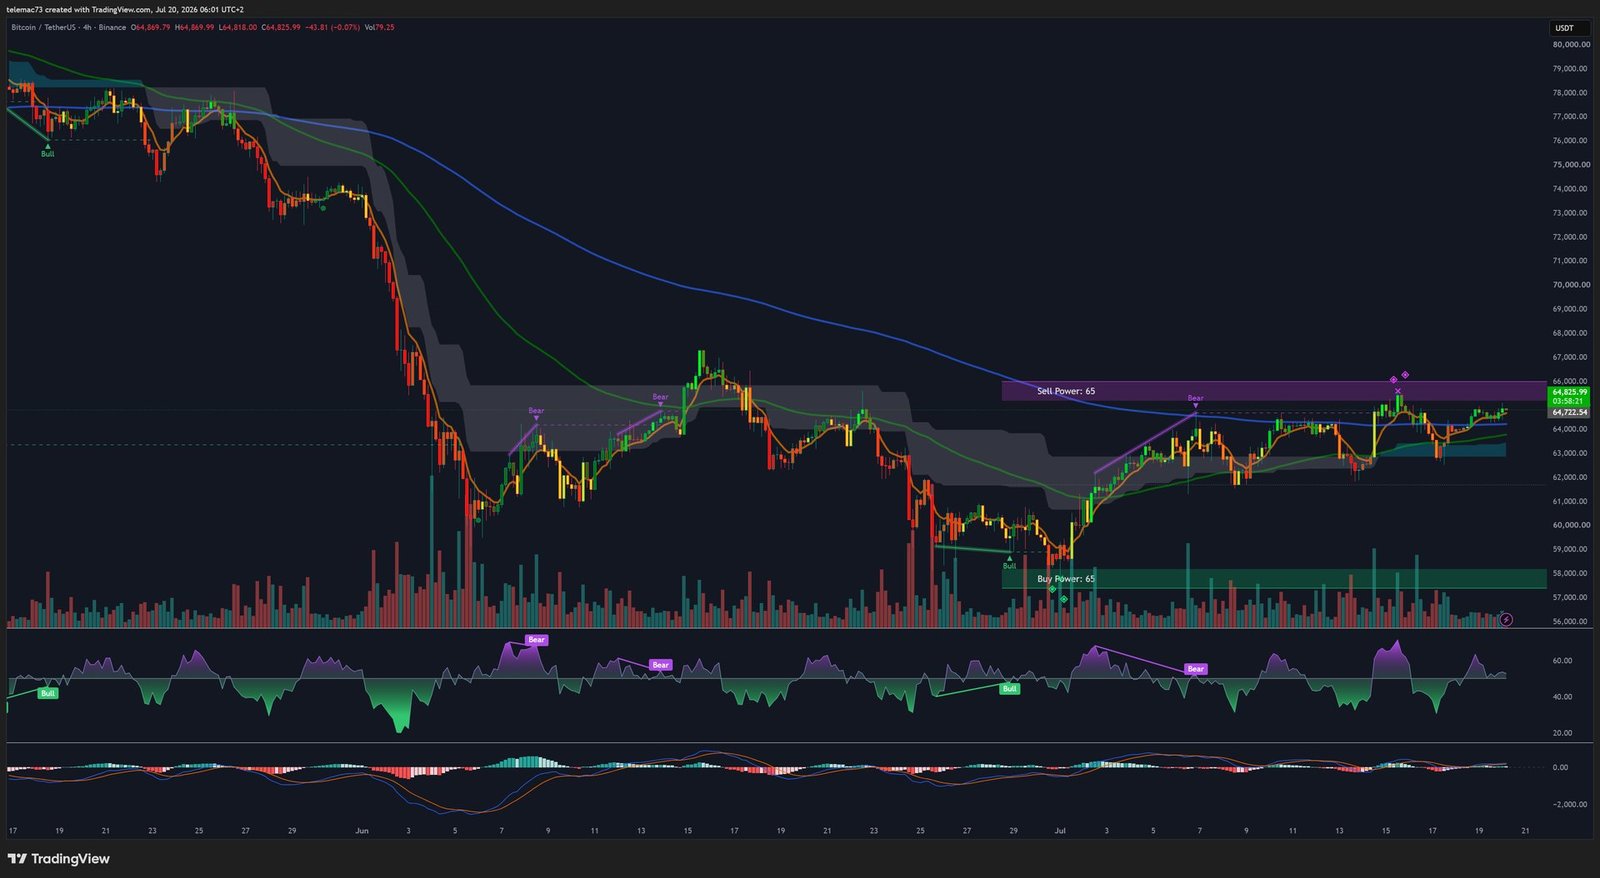
On the H4 timeframe, price has been carving out a large symmetrical compression triangle since the July 15 rejection at $65,000: lower highs against higher lows, awaiting a catalyst — most likely the late-July FOMC meeting. An H4 close above $64,800, accompanied by an RSI push through 60, would open the way to the upper liquidity void near $68,000. Conversely, a loss of the defensive pivot at $63,123 would trigger a swift move back toward $60,000, or even a test of $58,000.
Microstructure (M15) and Liquidity Mapping
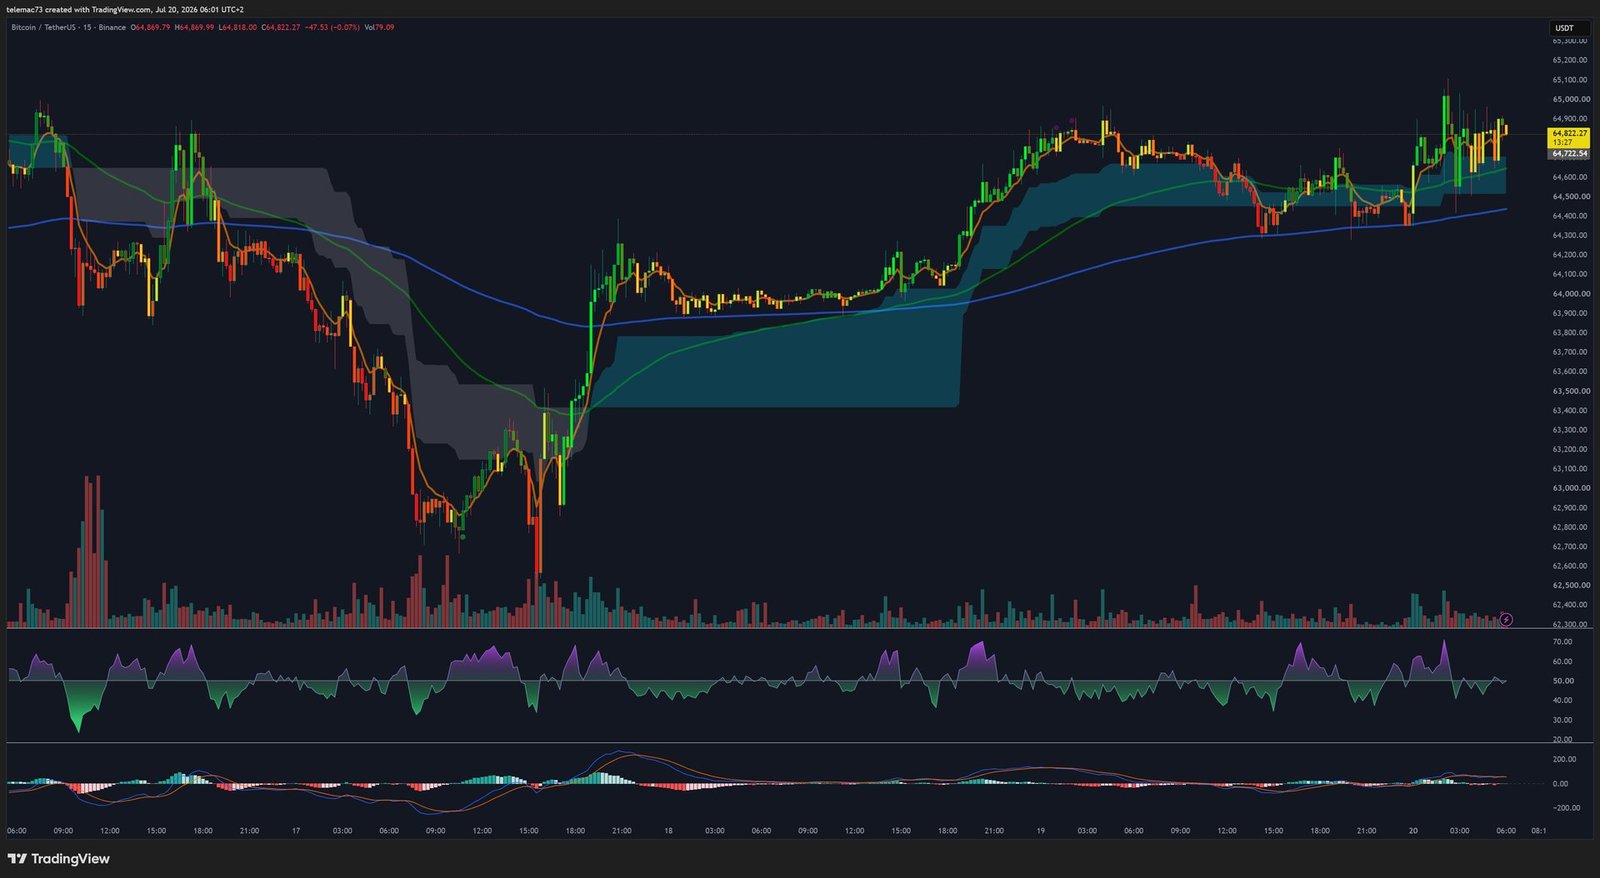
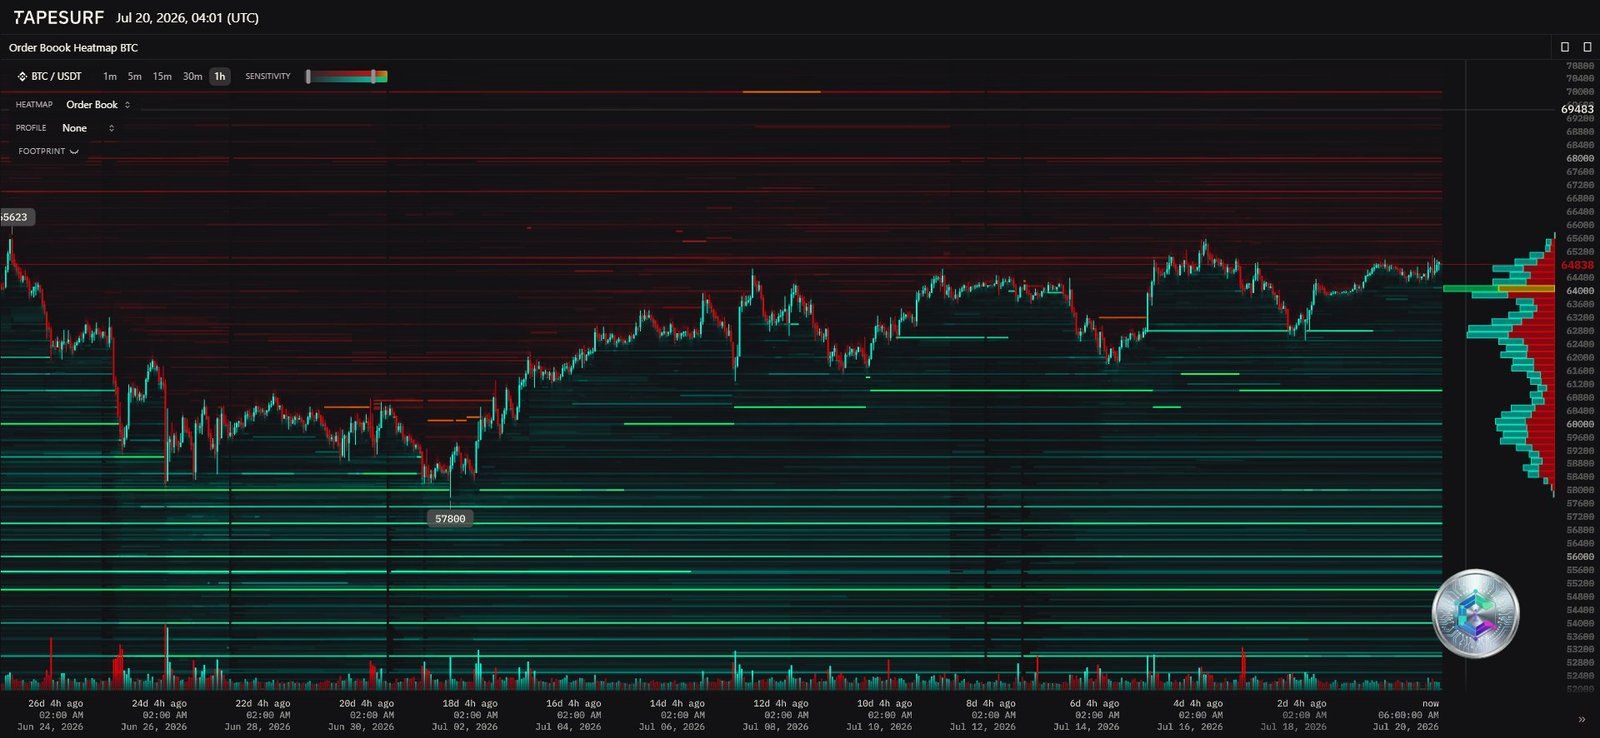
On the M15 timeframe, the market is stuck in a tight range between $63,000 and $64,500, dominated by high-frequency algorithms. The order-book heatmap reveals three key zones: a dense institutional sell wall between $65,000 and $65,300, a strategic buy wall around $63,123 — aligned with the liquidation threshold of the CFD contract mentioned above — and a genuine liquidity void between $60,000 and $62,500, a zone where any break of support could trigger a sharp, unopposed drop in price.
Key Levels to Watch
| Price Level (USD) | Classification |
|---|---|
| $68,000 – $69,000 | Macro-historical resistance, bear market invalidation |
| $65,000 – $65,300 | Sell wall identified on the heatmap |
| $64,800 | Intraday pivot, level of the dormant whale transfer |
| $63,944 | Current equilibrium point, H4 triangle POC |
| $63,123 | Defensive wall, liquidation threshold of the massive CFD contract |
| $58,000 – $60,000 | Deep structural support, whale accumulation zone |
| $53,600 | Capitulation floor in case of a broader macro collapse |
Two Scenarios for the Weeks Ahead
Bullish scenario: if ETF flows remain positive and whales continue to pull liquidity off exchanges, a supply shock could push price above the bearish trendline, smash through the $65,000 wall and target the $68,000–$69,000 zone, while removing the Death Cross risk entirely.
Bearish scenario: a loss of the $63,123 pivot on an H4 close would trigger a cascade of liquidations through the liquidity void, dragging price back to the $58,000–$60,000 support. A confirmed breakdown of that zone would validate a bearish 50/200-day moving average cross and confirm entry into a sustained bear market structure.
Bitcoin is therefore walking a knife’s edge: on one side, a Japanese regulatory breakthrough carrying long-term structural bullish potential; on the other, short-term macro pressure and extreme technical compression that will need to resolve in the coming weeks. Risk management around the $63,123 pivot will be decisive.
Disclaimer: This article is provided for informational and educational purposes only. It does not constitute investment advice, a recommendation to buy or sell, or a solicitation to trade digital assets. Cryptocurrency markets are highly volatile and carry significant risk of capital loss. Always do your own research (DYOR) and consult a licensed financial advisor before making any investment decision.

