
On January 13, 2026, Bitcoin is navigating a critical consolidation phase that could define the trajectory of the first quarter. Hovering around $91,188, the market faces a war of attrition between massive institutional accumulation and macroeconomic caution linked to US inflation data.
An Explosive Price Compression Ahead
Bitcoin is currently trading within a narrow range between $91,000 and $92,000. This apparent stagnation masks an intense market dynamic where two opposing forces clash. On one side, a massive sell wall identified at $95,000 blocks any impulsive rally attempts. On the other, strategic institutional purchases, notably by Strategy (MicroStrategy), create a solid floor around $91,000.
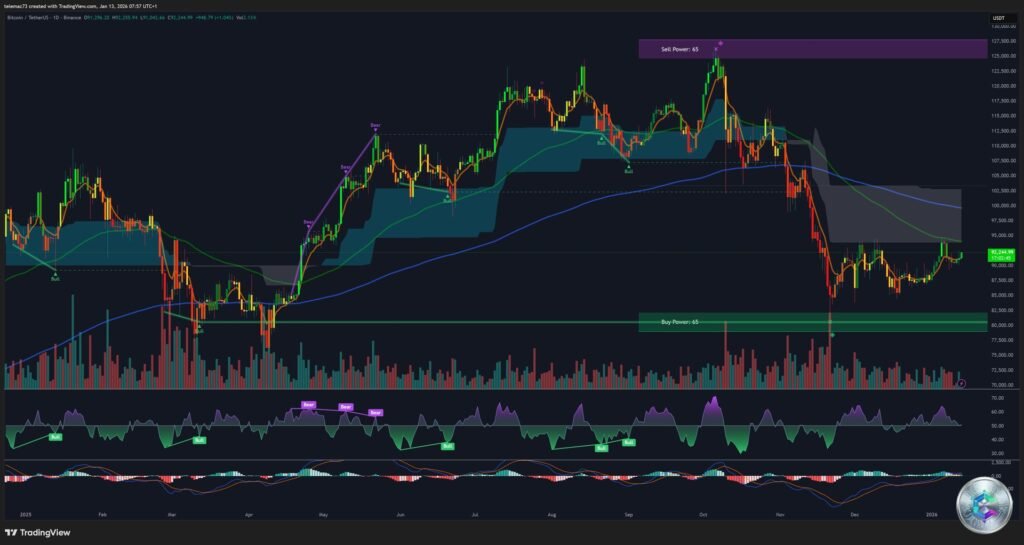
This price compression translates into declining implied volatility, a phenomenon that historically precedes violent directional movements. Analysis of charts across multiple timeframes reveals a market structure awaiting a catalyst.
The Critical Impact of CPI on Bitcoin’s Trajectory
The defining event of mid-January is the release of the US Consumer Price Index (CPI). Markets anticipate a consensus of 2.7% for both headline and core inflation. This data will dictate the Federal Reserve’s roadmap for the first half of 2026.
Three scenarios emerge based on the CPI reading:
- Disinflation scenario (CPI < 2.6%): A downside surprise would fuel the « soft landing » narrative and revive hopes for aggressive rate cuts. For Bitcoin, this would be the ideal catalyst to break through the $95,000 resistance as the dollar weakens mechanically.
- Neutral scenario (CPI = 2.7%): A reading in line with expectations would simply validate the status quo and probably wouldn’t be enough to trigger an immediate rally. The market might then seek to purge speculative positions before any bullish continuation.
- Resurgence scenario (CPI > 2.8%): An upside surprise would be disastrous for risk assets. It would force the Fed to maintain, or even tighten, its restrictive rhetoric. Bitcoin could then see its technical supports violently tested.
Multi-Timeframe Technical Analysis
4-Hour Tactical View: Compression and Indecision
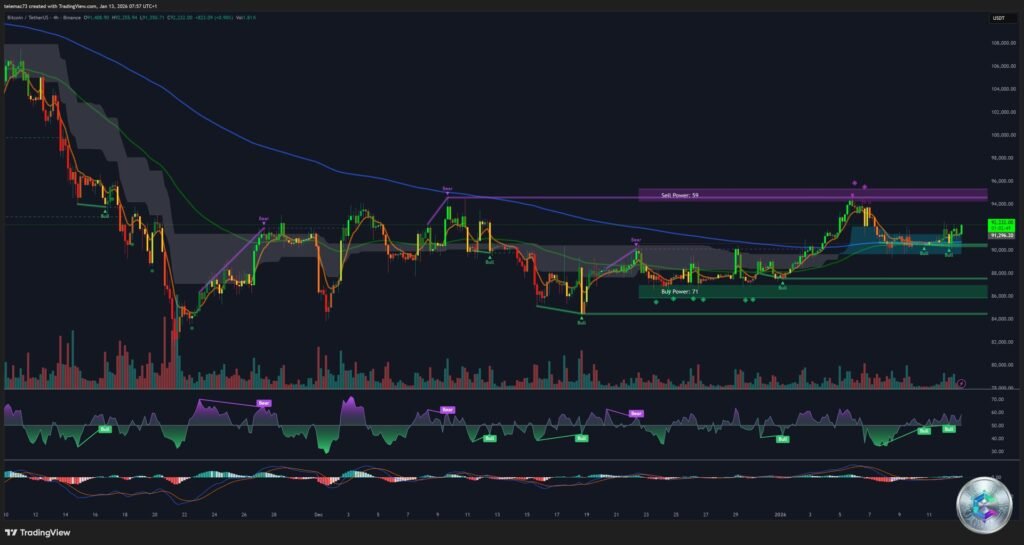
The 4-hour timeframe reveals significant volatility compression. BTC is imprisoned between $90,500 and $92,500 for several days. Candlesticks show numerous upper and lower wicks (« Dojis », « Spinning Tops »), testifying to total indecision. Buyers intervene as soon as the price touches $90,500, while sellers take control at $92,000.
15-Minute Execution View: A Minefield
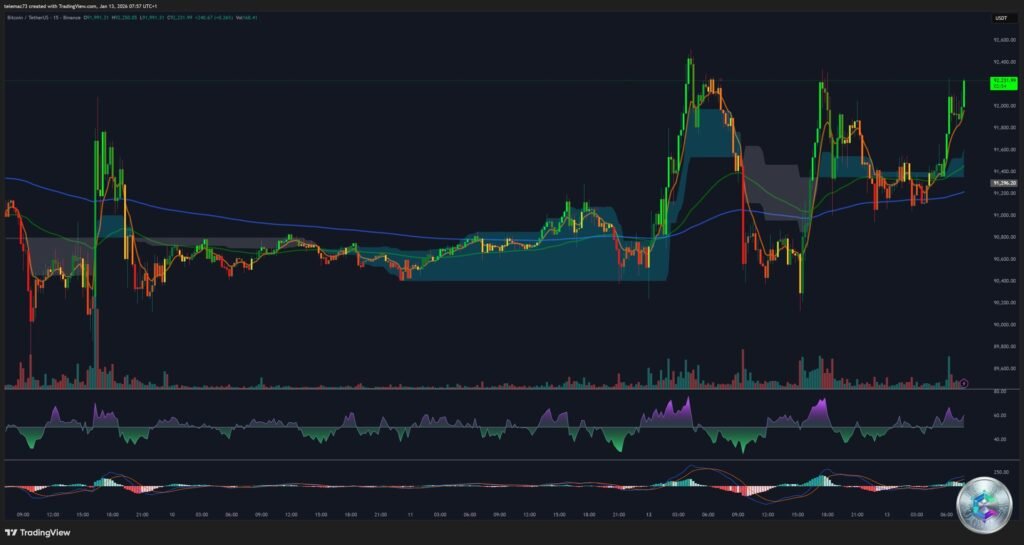
The 15-minute chart is currently noisy and erratic, typical of pre-economic announcement periods. Short-term moving averages constantly cross, generating false buy and sell signals. A recurring trend emerges: Asian sessions attempt to push the price higher, while European and American sessions sell these rebounds.
Market Microstructure: The Liquidation Map
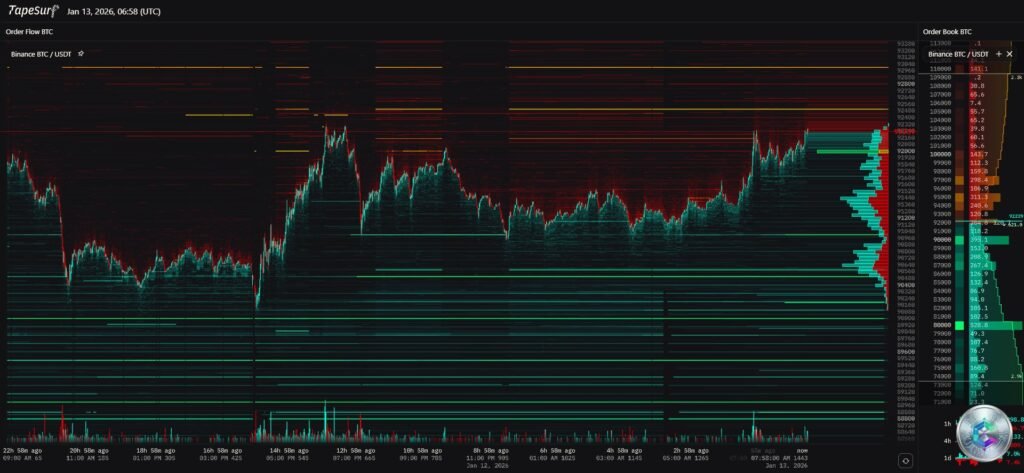
Analysis of the liquidation heatmap reveals crucial information about market structure. Two magnetic zones clearly emerge:
- $95,000 – Short Liquidations: This is the « maximum pain » level for short sellers. A move toward this level would trigger a cascade of forced buying (« Short Squeeze »), propelling the price toward $98,000 very quickly.
- $87,000 – $89,000 – Long Liquidations: A dense concentration of stops from retail traders betting on the rebound is located here. A quick wick into this zone to clean out these positions is a very likely scenario before any sustainable rally.
Examination of Binance’s order books corroborates this data. The « Big Boy Sell Wall » at $95,000 consists not only of liquidations, but also passive sell orders placed by institutions wishing to lighten their positions or block the rally to accumulate lower.
Institutional Accumulation: A Fundamental Pillar
Strategy’s recent acquisition of 13,627 BTC for $1.25 billion at an average price of $91,519 is crucial data. The fact that the current market price is slightly below this purchase price indicates the entity is at a slight unrealized loss on this tranche. Historically, these major players defend their entry levels, explaining the support strength around $91,000.
With total holdings reaching 687,410 BTC, this continued accumulation sends a strong signal to other institutions: the current valuation is perceived as attractive for the long-term horizon, despite short-term volatility.
The South Korean Revolution: A New Institutional Pillar
Asia is poised to transform the nature of its crypto market participation. After nine years of prohibition, South Korea’s Financial Services Commission (FSC) will authorize corporate investments in cryptocurrencies. Listed companies will be able to invest up to 5% of their equity in virtual assets, limited to the top 20 cryptocurrencies by market capitalization.
The potential entry of 3,500 South Korean corporate entities will create new structural demand. Unlike retail traders known for their speculative behavior, corporate treasuries have longer time horizons and more passive buying strategies. Final guidelines are expected for February 2026, and the market often begins pricing in these institutional flows before their effective arrival.
Forecast Scenarios and Key Levels
Based on technical, macroeconomic, and liquidity analysis, three probabilistic scenarios emerge:
Scenario 1: The « Shake-Out » Then Rally (Probability: 50%)
The order book is fragile to the downside and long liquidations are attractive at $87,000. The CPI comes in line with expectations (neutral), disappointing impatient buyers. Expected sequence: drop below $90,000, bearish acceleration to $87,000 – $88,000, then massive absorption by institutional limit orders and violent V-shaped rebound. Weekly close above $91,000.
Scenario 2: The Macro Breakout (Probability: 30%)
The CPI surprises to the downside (< 2.6%), the dollar plunges. Sequence: immediate post-announcement surge with strong volume, the $95,000 wall is absorbed by market orders, Short Squeeze propelling the price toward $98,000 - $101,500.
Scenario 3: The Deep Correction (Probability: 20%)
Very hot CPI (> 2.9%) or bad geopolitical news. Risk aversion dominates. Sequence: break of $87,000 without immediate rebound, test of the $80,000 – $84,000 zone (major Range Low).
Strategic Price Levels
| Level | Type | Importance | Recommended Action |
|---|---|---|---|
| $101,500 | Bullish Target | Extension | Final profit taking |
| $95,000 | Major Resistance | Very High (Sell Wall) | Partial profit taking |
| $92,000 | Local Resistance | Medium | Monitor H4 reaction |
| $90,650 | Local Support | Low | Long Scalping |
| $87,500 | Major Support | Very High (Buy Zone) | Strong Buy (Buy The Dip) |
| $84,000 | Critical Support | High | Last rampart |
Conclusion: Patience and Discipline
Bitcoin, on this January 13, 2026, stands at a crossroads. While the underlying trend remains bullish, supported by solid fundamentals (South Korean adoption, Strategy accumulation), the technical structure and short-term liquidity favor a volatility purge before continuation.
The market is currently a waiting game where patience is the most precious asset. For professional investors, the current zone ($91,000) is a « No Man’s Land. » The asymmetric opportunity lies either in buying on pullback toward $87,000, or in accompanying the breakout above $95,000.
The year 2026 promises to be one of maturity for Bitcoin. Today’s erratic movements are merely background noise of a major reconfiguration of the global financial system, where BTC is progressively establishing itself no longer as a simple speculative bet, but as an essential reserve asset.
⚠️ Important Disclaimer: This analysis is provided for educational and informational purposes only. It does not constitute investment advice, a buy or sell recommendation, nor a solicitation to conduct transactions in financial markets. Cryptocurrency markets are extremely volatile and carry significant risks of capital loss. Each investor must conduct their own research and consult a licensed financial advisor before making any investment decision. Past performance does not guarantee future results.