
The Bitcoin market is navigating a pivotal period at the beginning of 2026. After reaching an all-time high of $126,272 in October 2025, the world’s most capitalized digital asset now hovers around $89,000, awaiting the Federal Reserve’s monetary policy decision.
Macroeconomic Context: A Perfect Storm
The macroeconomic environment of January 2026 is characterized by major political uncertainty in the United States and a delicate monetary pivot. The market anticipates interest rates to be held between 3.50% and 3.75% at the FOMC meeting concluding on January 28.
This tactical pause by the Fed comes after three consecutive quarter-point cuts at the end of 2025, amid inflation at 2.6% year-over-year for the core CPI index. Jerome Powell’s position is described as « lame duck » (in the final term without influence), with his term expiring in May 2026.
A remarkable phenomenon is emerging: the movement dubbed « Sell America », triggered by tariff threats from the White House. This flow pushes investors to abandon traditional American assets in favor of foreign currencies and tangible assets. Bitcoin, by its decentralized nature, benefits from this rotation.
Multi-Timeframe Technical Analysis
Daily View: Consolidation After the Storm
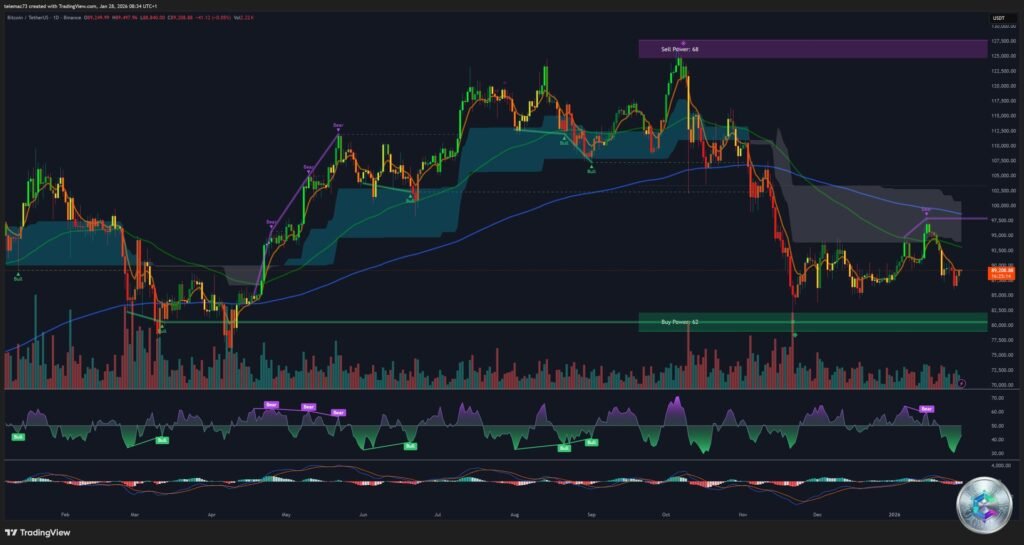
On the daily timeframe, Bitcoin is undergoing a consolidation process after a 25% drop over the past six months. The chart highlights a major support zone between $80,000 and $85,000, corresponding to both November 2024 lows and a zone of strong institutional demand.
The « Sell Power » is currently assessed at 68 on the daily chart, indicating that despite price stabilization, distribution pressure remains latent. The 365-day moving average, positioned around $101,000, acts as a key structural resistance.
4-Hour Dynamic: The Battle for $90,000
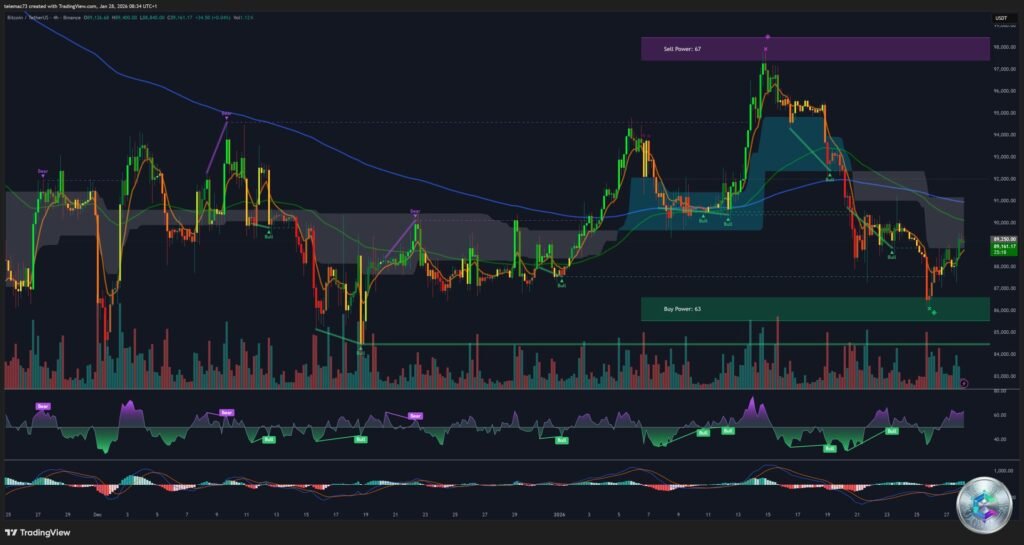
The 4-hour chart reveals a fierce battle between buying and selling forces. « Sell Power » stands at 67 versus « Buy Power » at 63, illustrating a slight advantage for sellers in the current zone.
Momentum indicators show signs of divergence. The price recently tested a resistance block around $98,000 before experiencing a sharp rejection, confirming that sellers are aggressively defending the area preceding $100,000.
A dynamic support zone between $85,000 and $87,000 has served as a bounce platform multiple times in January, absorbing liquidation cascades that reached $869 million on January 19.
Short-Term (15 Minutes): Extreme Compression
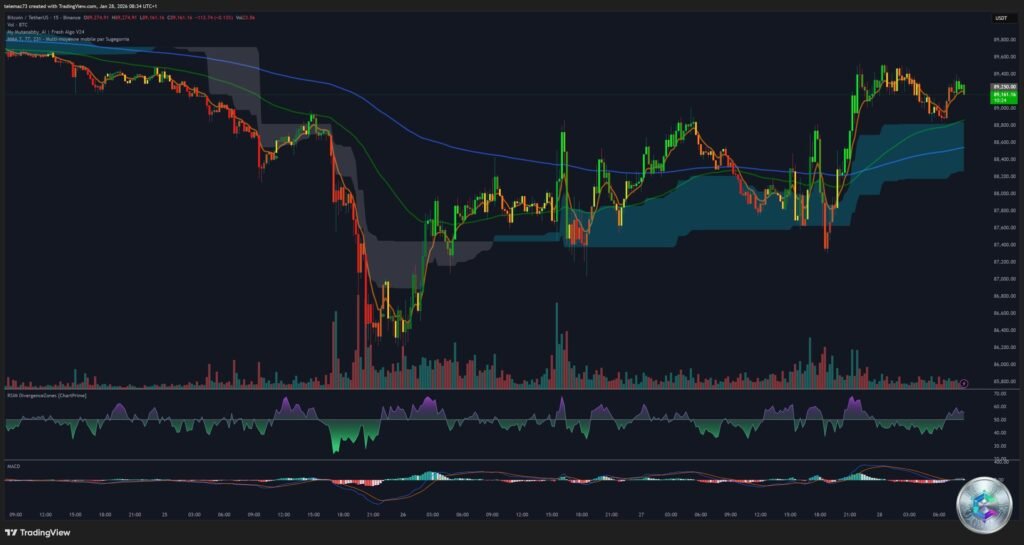
The 15-minute chart shows extreme volatility compression over the past 24 hours. The price oscillates in a narrow range, repeatedly testing the $89,200 level. This « coiling » phase is visible through the tightening of indicator clouds and MACD flatness.
Heatmap and Order Book: Liquidity Revealed
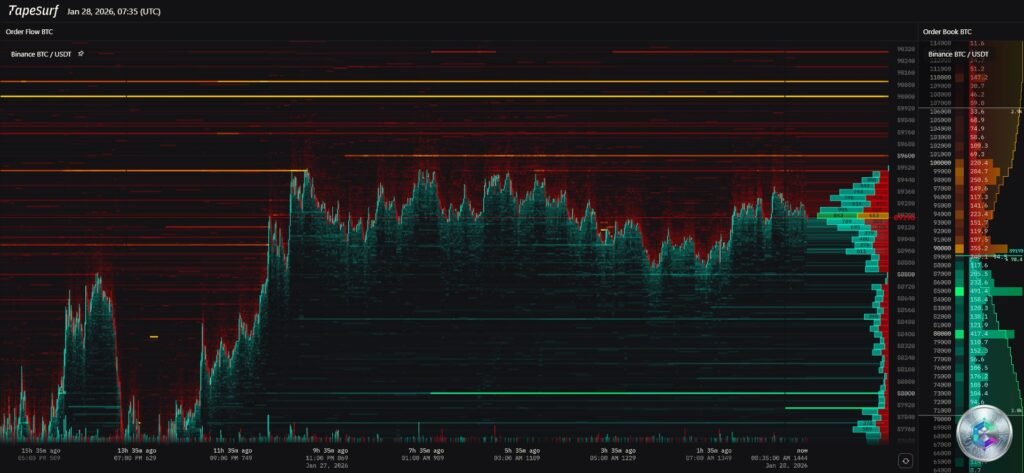
The BTC/USDT order book heatmap reveals crucial information about liquidity distribution:
- Sell Side (Ask): Intense red and orange lines are visible above the current price, notably at $95,000, $98,000, and especially at $100,000. These « sell walls » suggest institutions are placing massive orders to capture liquidity during upward attempts.
- Buy Side (Bid): Solid green and turquoise bands appear below the price, specifically between $80,000 and $85,000. This confirms the existence of an « invisible hand » of buyers ready to absorb any sharp drop.
The persistence of buy orders at $87,000 despite repeated tests indicates genuine absorption rather than market manipulation.
Institutional Flows and Bitcoin ETFs
The Bitcoin market in 2026 is structurally dependent on flows from US Spot ETFs. January data shows an institutional « de-risking » phase:
- The week ending January 23 recorded $1.73 billion in outflows, the largest since November 2025
- Bitcoin led this withdrawal with $1.09 billion in net outflows
- BlackRock’s IBIT and Fidelity’s FBTC ETFs were most affected
However, between January 13 and 15, ETFs absorbed $1.7 billion over three days, taking advantage of a temporary dip toward $86,000. This demonstrates that while institutions are reducing their overall exposure, they remain opportunistic at key support levels.
The average acquisition cost for the average ETF investor is estimated at $84,099. As long as Bitcoin remains above this threshold, the market structure remains technically bullish.
Critical Technical Levels
Immediate Resistances
- $91,924: 18-day moving average crossover level
- $94,095 – $94,766: Current consolidation ceiling
- $98,330 – $100,762: Major resistance zone inherited from late 2025
- $116,030: 13-week high, tipping point toward renewed euphoria
Protection Supports
- $88,000 – $88,500: Psychological support zone
- $86,062: Monthly low, safety net
- $84,099: Critical level, foundation of institutional confidence
- $80,619: November low, last bastion before $75,000
The Fear & Greed Index: A Contrarian Signal?
The « Fear & Greed » index at 27 is one of the most intriguing points of this analysis. The fact that the market is « frozen » by fear while Bitcoin is at $90,000 suggests we are not in a manic bubble, but in a phase of « institutional migration ».
Excessive speculation was purged during late 2025 liquidation cascades. The current sentiment is dominated by awaiting regulatory clarity and uncertainty surrounding Jerome Powell’s successor at the Fed.
Scenarios for H1 2026
Bullish Scenario (60% Probability)
If the Federal Reserve confirms its pause and Powell reassures about institutional independence, Bitcoin could break its consolidation upward. A decisive breach of $95,000 would trigger massive short covering, quickly targeting the $100,000 – $102,000 zone.
Long term, appointing a « dovish » successor as Fed chair in May 2026 could propel the asset toward targets of $120,000 to $150,000 by end of 2026.
Bearish Scenario (40% Probability)
A « hawkish » Fed surprise, coupled with continued ETF capital outflows, could force Bitcoin to test deep supports. A break of $84,000 would likely lead to a drop toward $75,000, or even $70,000.
However, the buying liquidity density visible on the Heatmap between $80,000 and $85,000 suggests such a drop would be quickly absorbed by long-term institutional investors.
Conclusion
Bitcoin stands at a critical crossroads on January 28, 2026. Technical and fundamental analysis converges toward a period of cautious waiting before the Fed’s decision. Levels to watch closely are the $89,113 pivot and the $94,095 resistance.
Gradual accumulation on pullbacks toward $85,000 appears to be the most prudent strategy, given the asset’s structural resilience and its growing role as a hedge against macroeconomic instability.
Bitcoin in 2026 is no longer a simple speculative asset; it has become a barometer of confidence in the global financial system.
Disclaimer: This article is provided for informational and educational purposes only. It does not constitute investment advice, a buy or sell recommendation, or an inducement to invest in cryptocurrencies. Cryptocurrency markets are extremely volatile and carry significant risks of capital loss. Always conduct your own research and consult a qualified financial advisor before making any investment decisions.