
Bitcoin is currently navigating a critical consolidation phase, hovering around $88,000 after failing to break through the psychological resistance of $98,000 in mid-January 2026. This comprehensive analysis examines the market’s technical structure, institutional flows, and macroeconomic context shaping Bitcoin’s trajectory at the start of the year.
Technical Structure: A Market Seeking Equilibrium
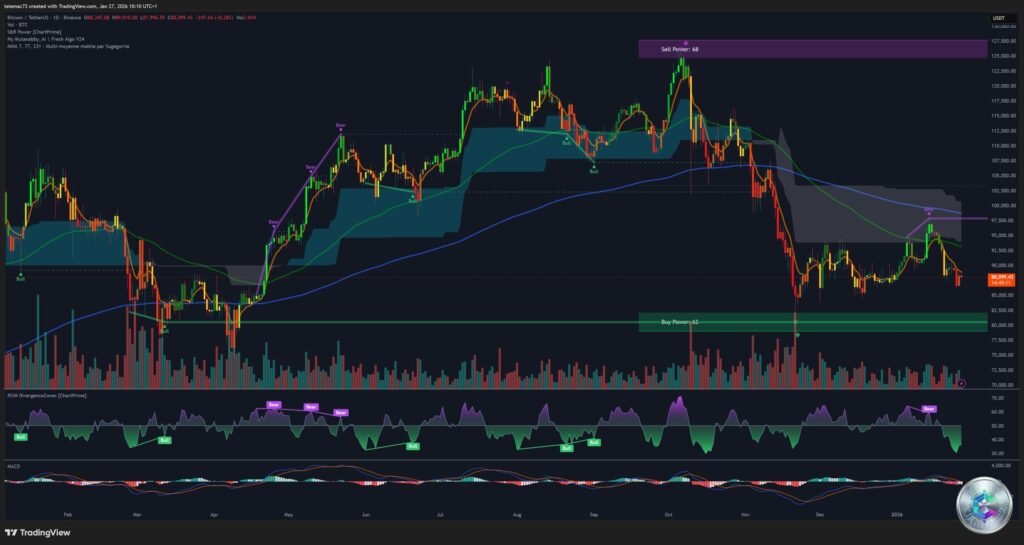
The daily chart analysis reveals a Bitcoin struggling to maintain its positions after a violent rejection from the $98,000 zone, identified as a « Sell Power » ceiling with a score of 68. The current price, stabilized around $88,099, reflects an intense battle between buyers and sellers.
Key Technical Levels
- Resistances: The $90,000-$92,000 zone now constitutes a major resistance, with massive sell order concentration. The trend pivot at $94,515 represents the critical threshold to invalidate the current bearish configuration.
- Supports: The institutional floor sits between $84,000-$87,000, with a particularly strong « Buy Power » zone at $80,000. Breaking this level would open a technical void toward $74,000-$68,000.
The MACD indicator on the daily chart shows a transition into negative territory, reflecting a significant slowdown in bullish momentum. The RSI, after reaching overbought zones, signals a necessary normalization rather than terminal distribution.
4-Hour Configuration: The « Bear Flag » Formation
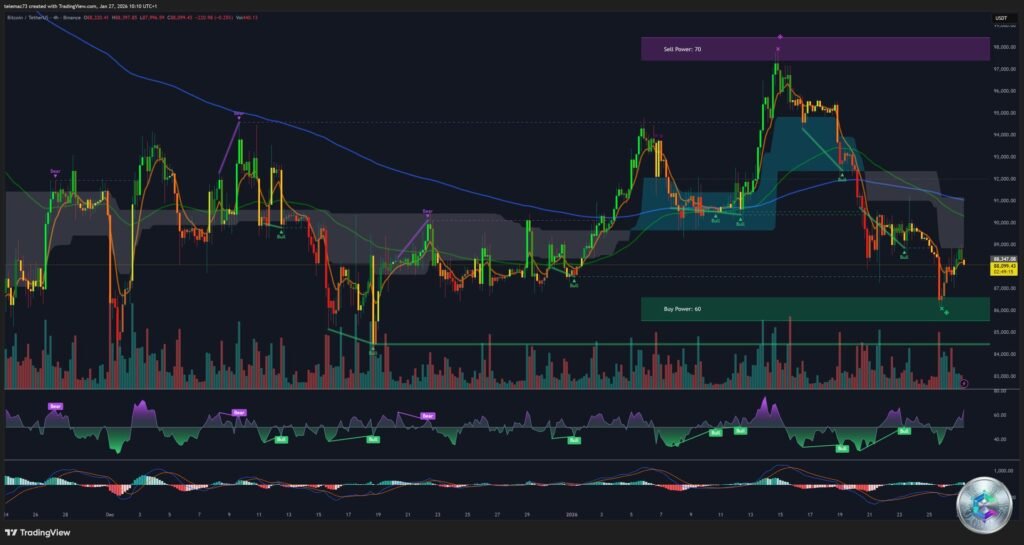
On the 4-hour timeframe, price action is drawing a « bear flag » pattern after breaking an ascending parallel trendline. This technical breakdown marks the beginning of a weakness phase confirmed by moving below the 50 and 200-period exponential moving averages.
A 4H candle close above $94,515 is imperative to invalidate this configuration and restore buyer advantage, opening the path toward a new test of $97,000.
Liquidity Analysis: The Heatmap Reveals the Stakes
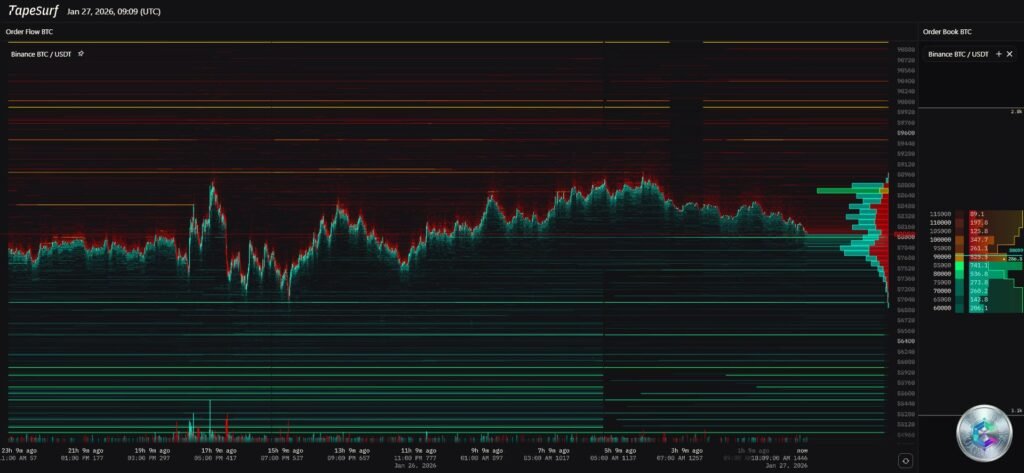
The liquidity heatmap as of January 27, 2026 reveals a massive concentration of sell orders in the $89,800-$90,500 range, described by analysts as a « crowded exit door. » This zone represents a level where numerous participants seek to liquidate long positions or initiate short sales.
Conversely, the order book on the buy side shows sustained interest around $86,300. A break of this liquidity barrier would open a technical void down to $84,246, reinforcing short-term capitulation risk.
Intraday Microstructure
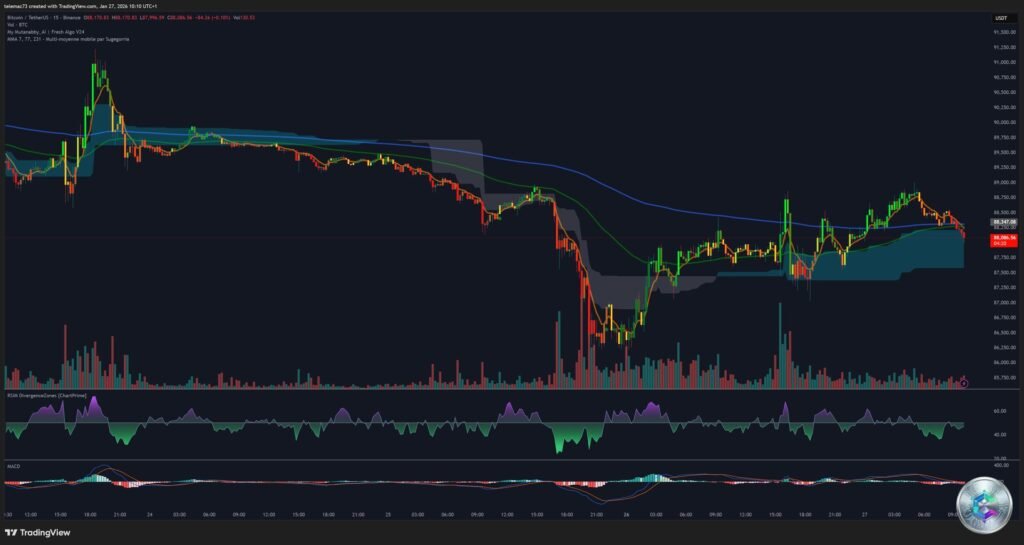
The 15-minute timeframe presents a volatile stabilization phase around the monthly open at $87,500. After suffering massive liquidations exceeding $800 million on leveraged positions, the market appears to be entering a period of « calm before the storm. »
Institutional Flows: The ETF Reversal
January 2026 has witnessed unprecedented volatility for U.S. spot Bitcoin ETFs. After recording a record week with $2.17 billion in net inflows mid-January, sentiment brutally reversed.
| ETF Product | Week 3 Flows | Week 4 Flows | Trend |
|---|---|---|---|
| BlackRock (IBIT) | +$1.03B | Marked slowdown | Extreme caution |
| Fidelity (FBTC) | +$351M | Net outflows | Rebalancing |
| Global Spot BTC ETFs | +$2.17B | -$1.73B | « Risk-Off » dominant |
For the week ending January 23, these funds recorded their largest weekly outflow since mid-November 2025, totaling $1.73 billion in redemptions. This reversal suggests institutional capital is conducting tactical rebalancing in favor of precious metals.
Geopolitical Context: The « Sell America » Trade
Bitcoin has been severely impacted by the Trump administration’s aggressive trade rhetoric. Threats to impose 100% tariffs on Canadian products and 10% against eight European countries have created shockwaves across global financial markets.
These tensions triggered a brutal Bitcoin drop below $91,000 on January 20, accompanied by massive liquidations exceeding $1 billion. The paradox lies in the fact that while Bitcoin should theoretically benefit from dollar weakness, it reacts short-term as an asset correlated with technology stocks facing liquidity shocks.
The Crucial Fed Meeting
The January 27-28, 2026 FOMC meeting is surrounded by unprecedented political tension. After three consecutive rate cuts in late 2025 (current range: 3.50%-3.75%), the Federal Reserve is expected to maintain the status quo.
Attention focuses on Jerome Powell’s future, whose mandate expires on May 15, 2026. Institutional uncertainty is a double-edged sword for Bitcoin: it reinforces the narrative of an alternative to the politicized fiat system, but creates a « data fog » that pushes investors to reduce risk exposure.
Bitcoin vs Precious Metals: The Notable Divergence
The most striking fact of early 2026 is the explosion in silver prices (+54% YTD, >$114/oz) and gold (>$5,000/oz), contrasting violently with Bitcoin’s near-flat performance (<1% YTD). This relative underperformance should not be interpreted as structural weakness, but rather as tactical capital rotation toward physical safe-haven assets.
The market appears engaged in a « repricing » process of safe-haven value, where Bitcoin must prove its resilience against immediate geopolitical shocks rather than slow monetary inflation.
Scenarios for February 2026
Bearish Scenario (Probability: 30%)
A combination of negative factors (hawkish Fed, tariff escalation, ETF outflows >$2B) would lead to breaking the $84,000 support. Next stabilization expected between $74,000-$68,000 (200-week moving average).
Consolidation Scenario (Probability: 50%)
Most likely: an extended sideways phase between $85,000-$95,000. Neutral Fed, stabilization of trade tensions, neutral ETF flows. The market awaits a clear catalyst before choosing direction.
Bullish Scenario (Probability: 20%)
Unexpected dovish signal from Powell, massive ETF inflow resumption (>$500M/day), diplomatic calm. Breaking $94,515 would trigger a « short squeeze » toward $98,000 and discovery phase toward $103,500.
Conclusion: Vigilance and Selectivity
Bitcoin’s analysis on January 27, 2026 paints a picture of maturity under tension. Bitcoin has become a thermometer of confidence in the American financial system and a shield against geopolitical uncertainty, but its current performance is hampered by precious metals competition and political instability at the Fed.
Technically, vigilance is essential. Maintaining price above $84,000-$87,000 is the foundation upon which hopes for a 2026 recovery rest. For institutional investors, the recommendation is to prioritize selectivity and rigorous management of technical levels, with the $94,515 pivot as the tipping point for any sustainable recovery.
Monitoring ETF flows and FOMC meeting statements will be decisive in defining Bitcoin’s trajectory for the rest of Q1 2026.