
January 31, 2026. Bitcoin closes the month in an atmosphere of extreme fear, trading around $83,700 — a drop of over 33% from its all-time high of $126,272.76 reached on October 6, 2025. With the hawkish nomination of Kevin Warsh as Fed Chair, massive BlackRock ETF outflows, and a record correlation with the S&P 500, the market is experiencing a structural cyclical correction. Here’s the full breakdown.
The Macroeconomic Shock: The Kevin Warsh Effect
On January 30, 2026, President Donald Trump officially nominated Kevin Warsh to succeed Jerome Powell as Chair of the Federal Reserve. Widely viewed as a monetary hawk, the nomination triggered a massive sell-off across risk assets: the Dow Jones lost over 139 points at the open. On Polymarket, nomination odds surged from 30% to 94% in just two hours, sparking a liquidation cascade across futures markets.
For Bitcoin, this translates to a significant repricing of the cost of capital. The US PPI report, released the same day and confirming persistent inflation, reinforced expectations that rates would stay elevated longer than previously anticipated. The Fear & Greed index plunged into the Extreme Fear zone, reading between 16 and 19 — a level historically associated with market bottoms.
Multi-Timeframe Technical Analysis
Daily Timeframe: Breaking the Moving Averages
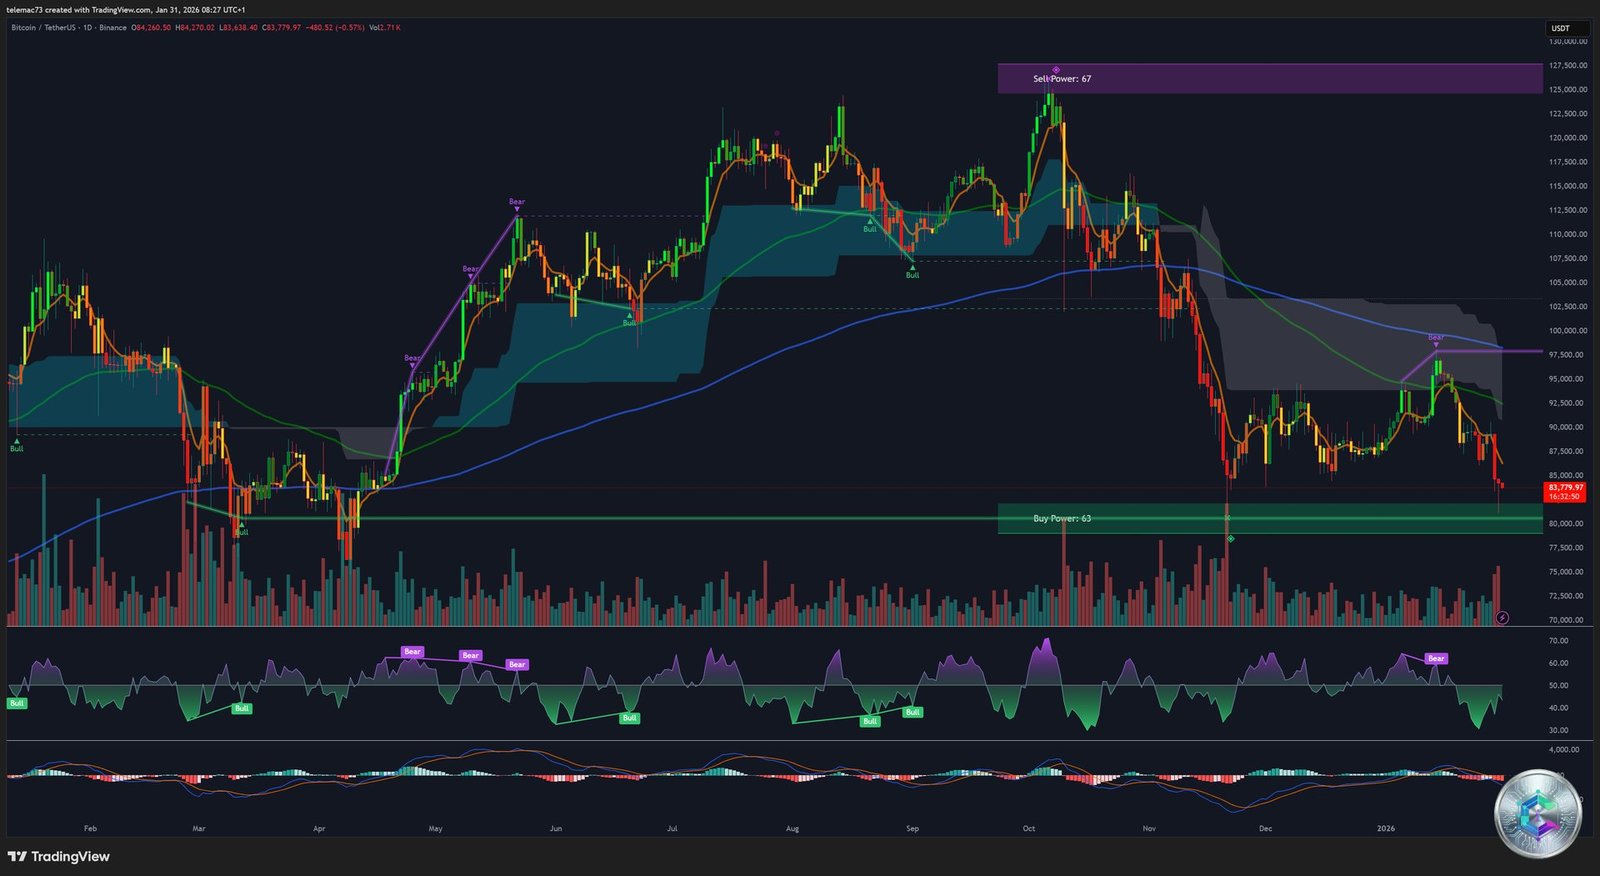
On the daily timeframe, the trend is unmistakably bearish. Bitcoin is now trading below all major moving averages. The 200-day EMA, sitting around $99,000, has been decisively broken — invalidating the long-term bullish structure that prevailed since 2024. The 50-day EMA around $91,900 now acts as dynamic resistance, creating a glass ceiling for any recovery attempt. The classic Lower Highs / Lower Lows pattern confirms a cyclical bear market. The daily RSI is approaching oversold territory without fully entering it, leaving room for an extension toward $75,000.
4-Hour Timeframe: The Liquidation Cascade
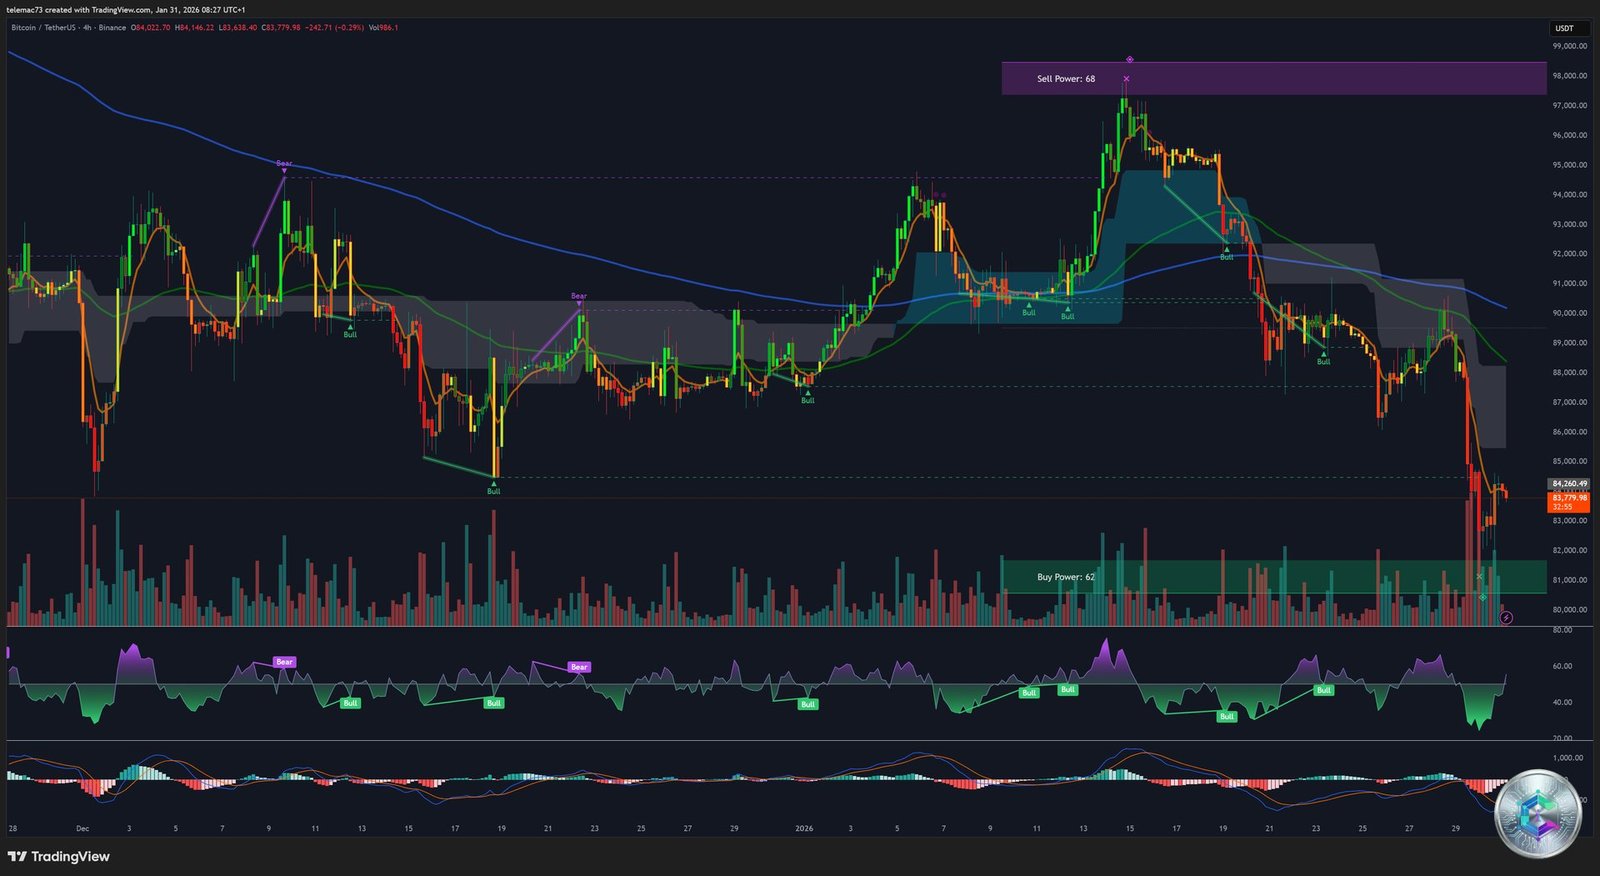
The breach of the psychological support at $90,000 triggered a chain reaction of stop-losses and forced liquidations, totaling over $1.75 billion in 24 hours. The Sell Power indicator reads 68, far outpacing Buy Power — selling pressure is being driven by short-term holder capitulation. Price found temporary support at $81,000, coinciding with the lows of November 2025.
15-Minute Timeframe: Consolidation in Fear
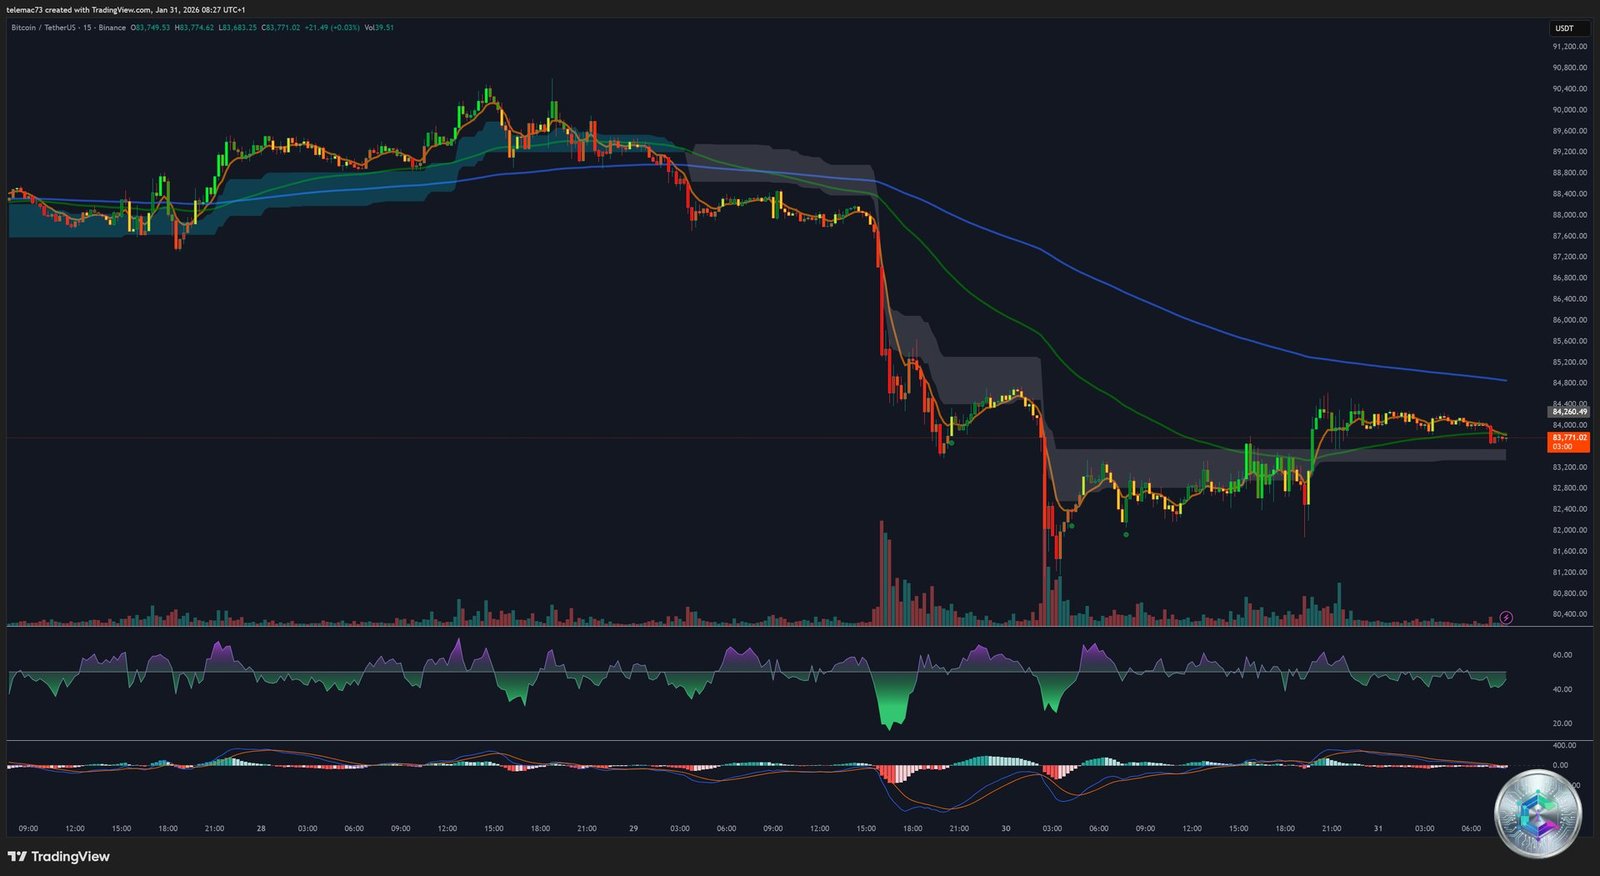
At the very short term, the 15-minute chart shows a compression or « coiling » phase. Price is attempting to stabilize around $83,700 after the systemic shock of January 30. Trading volumes have declined 8% over the past seven days, dropping to an average of $2.9 billion per day on spot markets. Professional traders are clearly in a holding pattern ahead of the next Fed decisions.
TapeSurf Heatmap: The Order Book Asymmetry

The heatmap reveals a deep asymmetry in liquidity distribution. A massive density of sell orders (red/orange zones) is concentrated between $90,000 and $94,000 — any rally toward these levels will be met with considerable institutional selling pressure. The order book shows more than 178 BTC waiting to be sold at the $90,000 level on Binance alone.
On the buy side, orders are more dispersed. A visible support zone exists between $80,000 and $81,000, but the book depth remains thinner than on the sell side. Should panic intensify, price could slide rapidly toward $75,000 — the next major cluster of institutional buy orders, linked to the lows of April 2025.
Key Levels: Supports, Resistances, and Pivots
| Level (USD) | Type | Strength |
|---|---|---|
| $100,000 | Psychological Resistance / Murray 8/8 | Extreme |
| $94,766 | Technical Resistance (January High) | Strong |
| $90,000 – $91,500 | Market Pivot / Former Support | Very Strong |
| $83,728 | Current Price | — |
| $81,000 | Recent Capitulation Support | Moderate |
| $80,500 | November 2025 Low | Strong |
| $75,000 | Long-Term Cycle Support | Critical |
The strategic pivot point for February is set at $88,000. As long as Bitcoin remains below this level, the structure is bearish and bounces should be treated with caution. A confirmed recapture of $88,000 would reopen the path toward $92,000.
Institutional Flows: BlackRock Capitulates, Fidelity Accumulates
January 30 recorded one of the largest net outflows in Bitcoin ETF history: $510 million withdrawn across the sector. BlackRock’s IBIT fund led the retreat with an outflow of $528 million, despite a historic AUM of nearly $62 billion.
The contrast is striking: Fidelity (FBTC) and Ark Invest (ARKB) posted modest inflows (+$7.5M and +$8.34M respectively). This rotation suggests that long-term « sticky » investors are quietly accumulating while speculative flows flee the largest vehicles — a classic distribution-to-accumulation shift during extreme fear.
Scenarios for February 2026
Scenario A — Final Capitulation (55%): ETF outflows accelerate, price breaks below $80,000 with a sharp wick toward $75,000. Sentiment hits full panic, creating conditions for massive long-term institutional accumulation.
Scenario B — Sideways Consolidation (35%): Bitcoin stabilizes between $81,000 and $87,000 in a re-accumulation phase. Volumes shrink, volatility compresses. Price eventually breaks higher toward the end of February.
Scenario C — V-Shape Reversal (10%): An unexpected event (geopolitical de-escalation or dovish Fed statement) triggers a short squeeze above $90,000. Attractive but unlikely given the current heatmap structure and BlackRock outflows.
The 30-day BTC/S&P 500 correlation at 0.91 confirms that Bitcoin is currently behaving as a proxy for tech risk, not as a store of value. The Rainbow Chart positions the price in the « Accumulate » band ($71,943 – $92,914) — for a 2- to 4-year horizon, the risk/reward becomes highly favorable despite the prevailing pessimism.
⚠️ Disclaimer: This article is for educational and informational purposes only and does not constitute investment advice or a recommendation to buy or sell any digital asset. Cryptocurrency markets are highly volatile and carry significant risks, including the potential for total loss of capital. Each investor should conduct their own research and consult a qualified financial advisor before making any investment decisions. CryptoInfo.ch assumes no liability for any losses resulting from the use of information contained in this article.