


Bitcoin (BTC) is trading at approximately $80,970 on May 11, 2026, in an unprecedented market environment. The convergence of massive institutional adoption via spot ETFs and the imminent arrival of a landmark U.S. regulatory framework is creating a market structure of unmatched complexity for professional operators. This multi-timeframe analysis breaks down price dynamics across three horizons, maps liquidity through heatmaps, and integrates the latest macro-fundamental developments to project the most likely trajectories ahead.
I. Macro-Fundamental Context: Regulation & Institutionalization
The CLARITY Act: A Regulatory Revolution in Motion
The digital asset industry has its eyes fixed on the Digital Asset Market CLARITY Act, with a Senate Banking Committee markup vote expected on May 14, 2026. The result of intensive bipartisan negotiations, this bill aims to draw a clear boundary between SEC and CFTC jurisdictions, definitively ending the « regulation by enforcement » model that has stifled institutional innovation for years. For Bitcoin, this legislation would mechanically reduce the regulatory risk premium — a first-order long-term appreciation catalyst.
A central point of contention concerns stablecoins: the current compromise would ban yield on idle dollar-pegged holdings to limit competition with bank deposits, while allowing transaction-based rewards. Traditional banks, fearing a massive outflow of insured deposits into the crypto ecosystem, are exerting intense pressure on lawmakers — illustrating how far the stakes now extend beyond the crypto sphere alone.
Bitcoin Spot ETFs: 9 Consecutive Days of Net Inflows Totaling $2.7B
U.S. Bitcoin spot ETFs delivered a remarkable performance in May 2026: nine consecutive days of net inflows totaling approximately $2.7 billion. The May 1 peak of $629 million in a single session demonstrates institutional demand that refuses to be deterred by price stagnation below $82,500. Beyond the sentiment signal, these flows carry a direct mechanical impact on supply structure: approximately 35,000 BTC were withdrawn from spot circulation over three weeks, placed in institutional custody primarily via Coinbase Custody.
BlackRock’s IBIT ETF dominates the landscape with over 810,000 BTC under management — worth more than $66 billion — surpassing the AUM of most of the same firm’s gold ETFs. This historic concentration means Bitcoin’s performance is now structurally tied to the health of the U.S. ETF complex and its capital flows.
The Kevin Warsh Wildcard: Monetary Transition Risk
A major risk looms over mid-May: Kevin Warsh is set to take the helm of the Federal Reserve on May 15, 2026. Historical data is stark — every Fed leadership transition has triggered a Bitcoin crash exceeding 77%: Yellen (-83%), Powell I (-84%), Powell II (-77%). Warsh inherits a particularly complex macro environment: oil at $115, CPI inflation at 3.3%, and a ten-week blockade in the Strait of Hormuz. His first communication regarding risk assets will be the most decisive signal for Bitcoin’s May 2026 trajectory.
II. Multi-Timeframe Technical Analysis
15-Minute Chart: Micro-Volatility & Liquidity Hunts
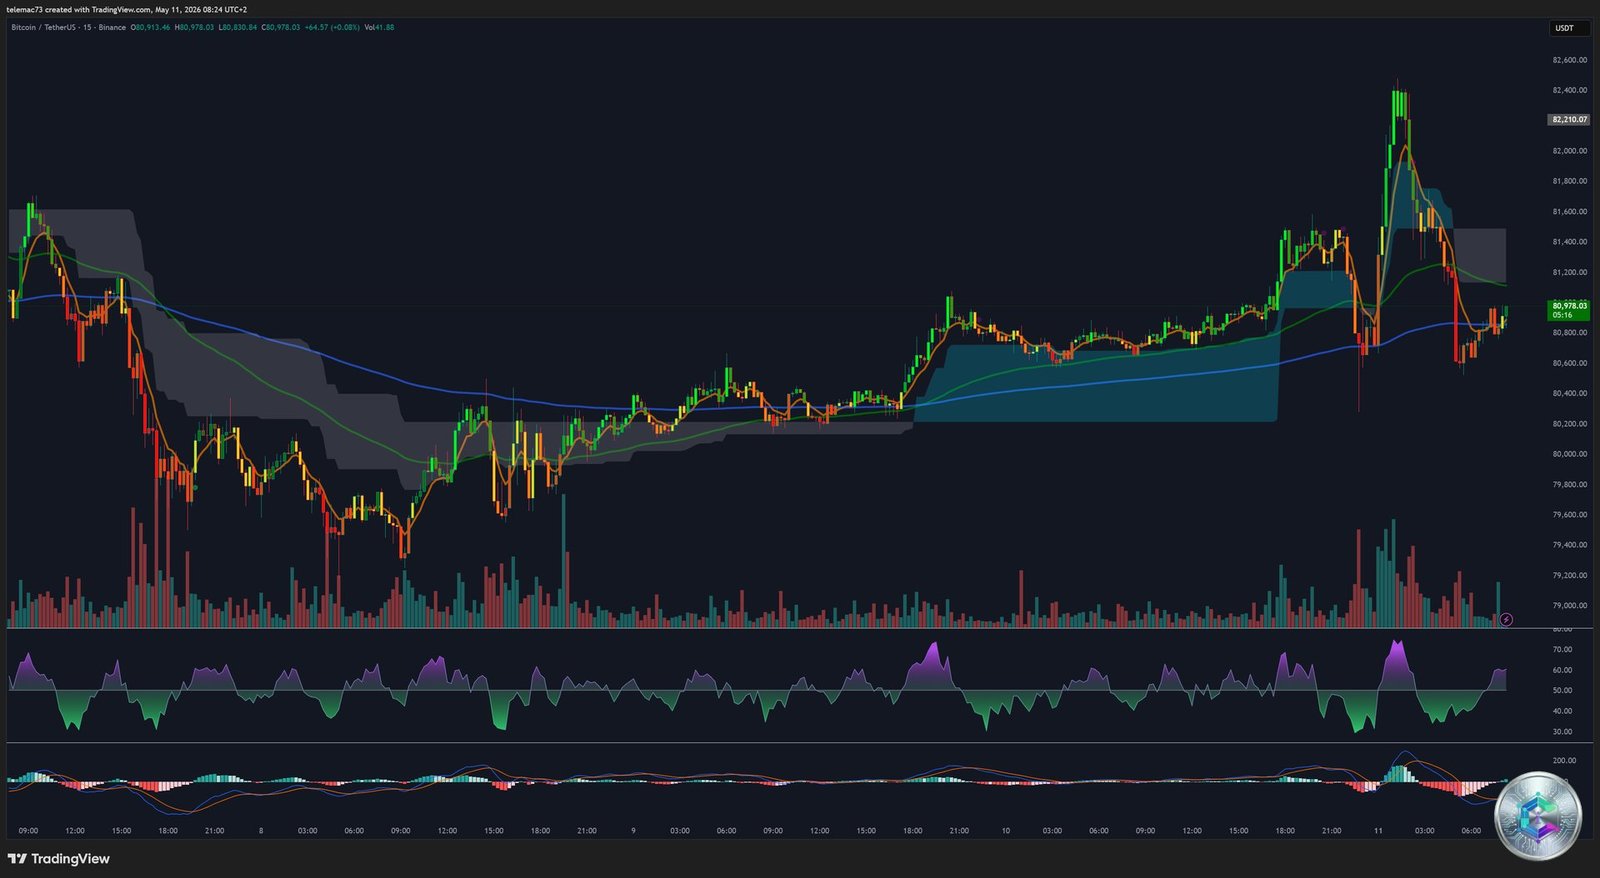
On the 15-minute chart, Bitcoin is struggling to maintain its momentum above a rising blue moving average. Long-wicked candles betray recurring episodes of liquidity hunts: a drop from $81,430 to $80,520 in just 45 minutes was quickly followed by a rebound toward $82,347, liquidating approximately $64 million in short positions. This dynamic illustrates the fragility of short-term positions while also confirming the resilience of institutional appetite at every bearish extreme.
The 15-minute RSI oscillates rapidly between 40 and 60, signaling a compression phase. Seasoned traders are watching for any « squeeze » above the immediate pivot at $82,000, a level that coincides with a recently filled CME gap — an inefficiency zone with a historical fill rate exceeding 90%.
4-Hour Chart: Intermediate Trend & Divergence Signals
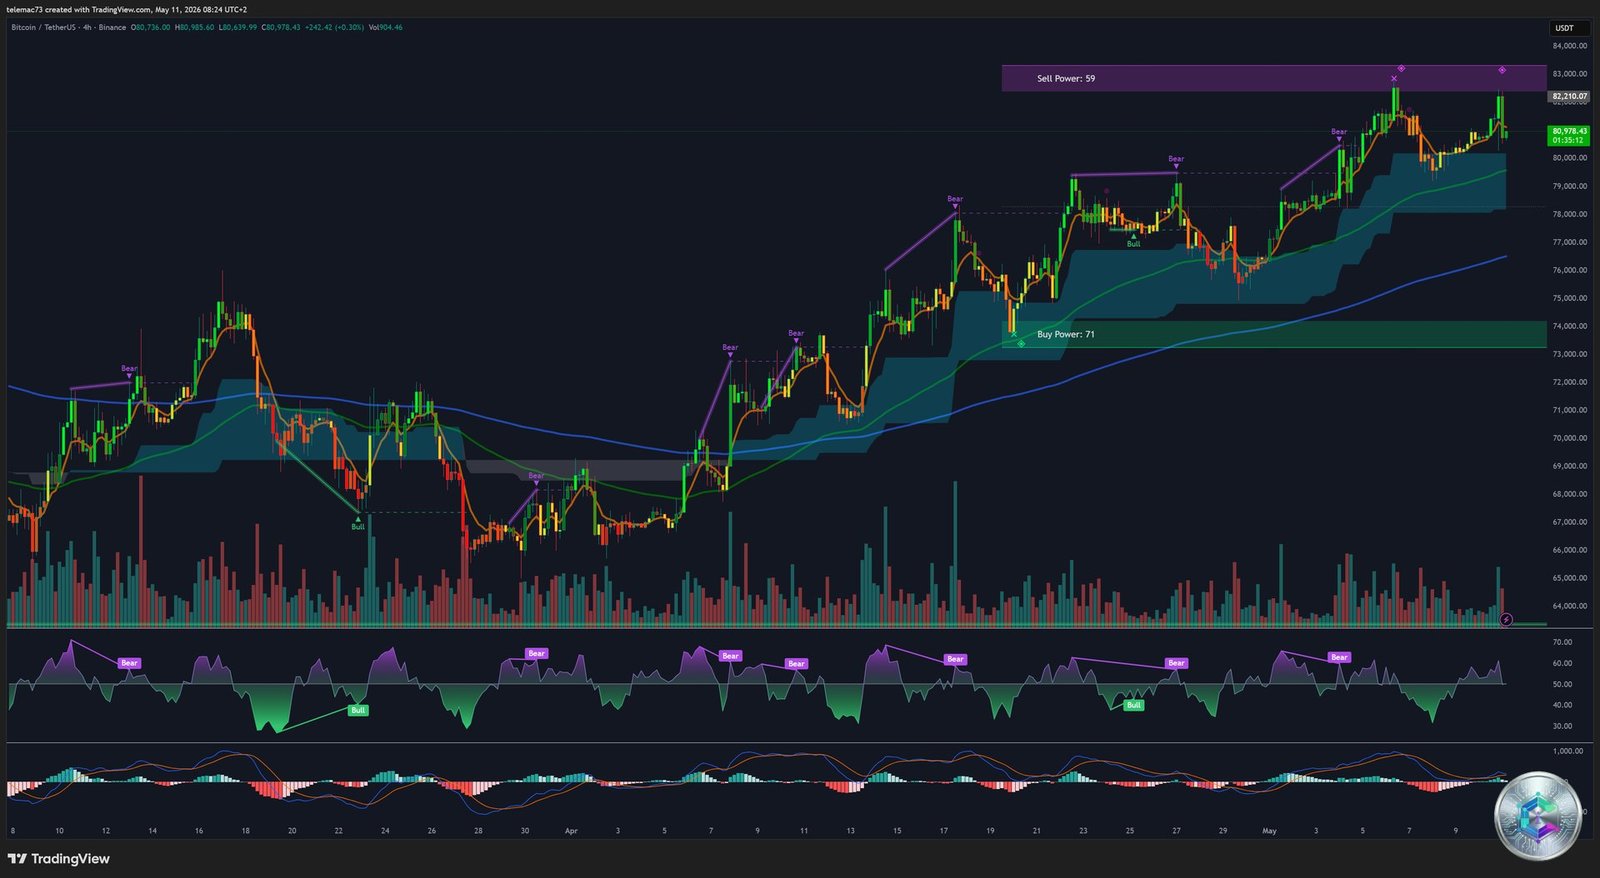
The 4-hour analysis reveals an overall bullish trend inscribed within an ascending channel, but dotted with warning signals (« Bear labels ») at the peaks. These markers flag bearish divergences between price and momentum indicators (RSI, MACD). The 4H RSI sits in neutral territory (30-70), with spikes near 70 during tests of the $82,500 resistance.
Notable moving average structure: the MA50 slopes slightly downward on this timeframe while the MA200 remains upward-sloping since May 5 — confirming underlying structural strength but immediate corrective weakness. Buy Power registers at 71 versus Sell Power at 59: buyers hold the upper hand, but momentum is fading. A series of « Bull Flags » has punctuated the rally from $70,000 — price appears to be forming a new flag between $80,000 and $82,500. A breakout to the upside would confirm a technical target toward $85,000.
Daily Chart: Cycle Structure & Pivot Levels
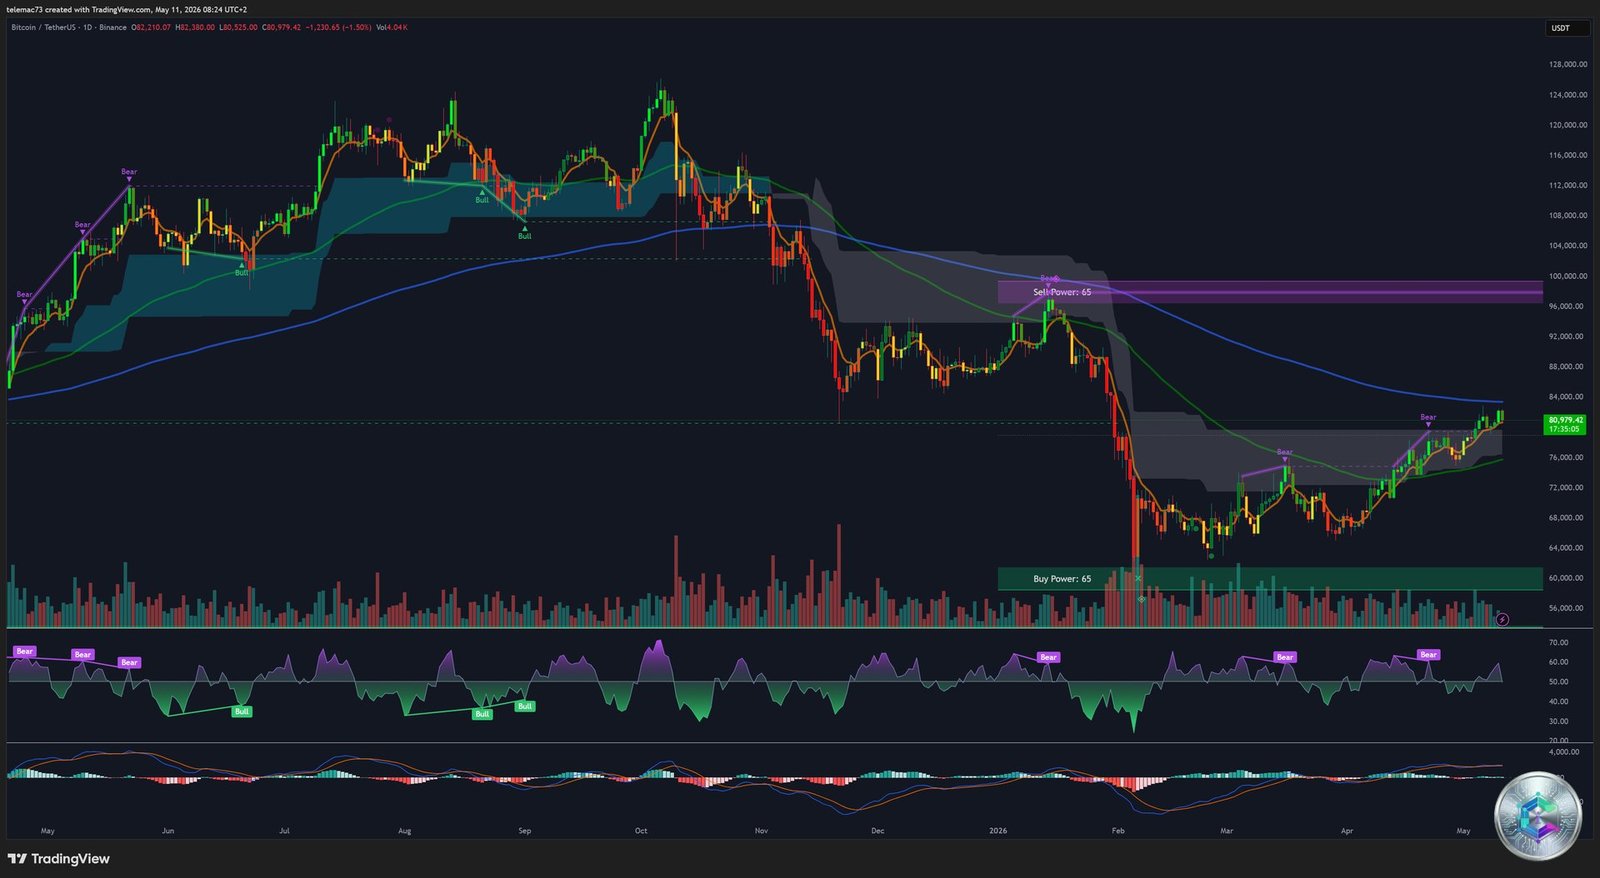
On the daily chart, Bitcoin is attempting to validate $80,000 as a structural support. After a prolonged consolidation below $70,000, the early-May bullish breakout propelled the asset toward yearly highs. However, the 200-day MA remains above price with a downward slope since April 10, 2026 — signaling that the macro trend remains technically fragile despite the rebound.
The NUPL (Net Unrealized Profit/Loss) indicator shows the market has not yet reached the « capitulation » zone required for a definitive cycle bottom, leaving open the possibility of a retreat toward $60,000 by year-end if the historical halving cycle script repeats. A recent bullish MACD crossover on the daily chart nonetheless constitutes a positive continuation signal worth monitoring closely.
| Technical Indicator | Value / State (May 2026) | Implication |
|---|---|---|
| RSI (4H) | Neutral (45-55) | Sideways consolidation |
| RSI (Daily) | > 50, approaching 70 | Bullish momentum, watch for overbought |
| MACD (Daily) | Recent bullish crossover | Trend continuation signal |
| MA50 (4H) | Downward slope | Short-term bearish pressure |
| MA200 (4H) | Upward slope | Strong structural support |
| TRIX | > 0 | Bullish exponential MA strength |
III. Liquidity Mapping: Heatmap Analysis
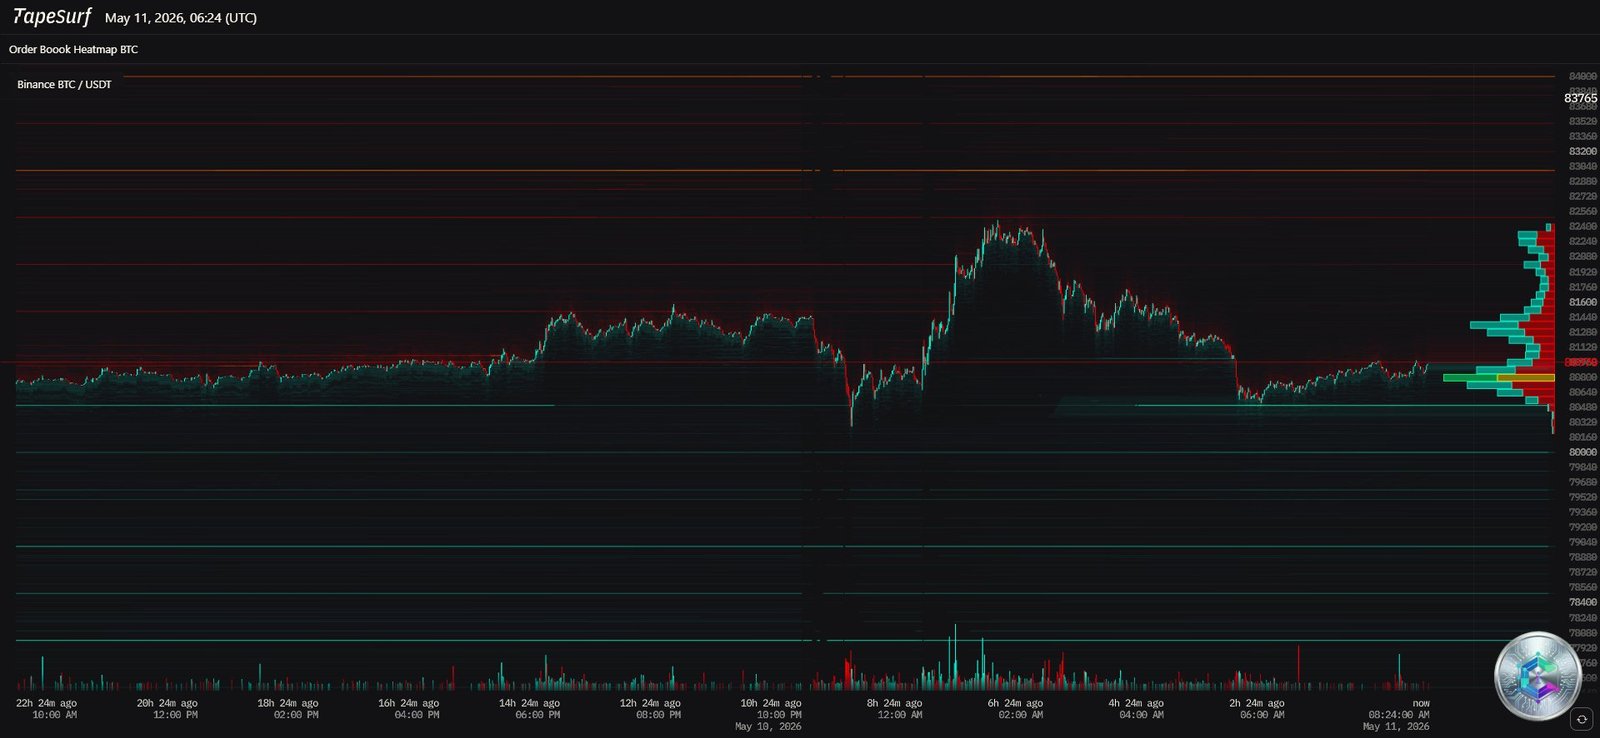
The liquidity heatmap is the true « X-ray » of the order book. The fundamental rule: liquidity acts as a magnet for price. The analysis identifies several critical zones that will condition the next directional moves.
A massive sell cluster (Whale Wall) is clearly visible at $83,765 — the primary lock before any expansion toward $90,000. Its absorption or rejection will define the next high-magnitude move. On the flip side, dense support zones are identified at $80,000 and $78,000. A break of these levels would trigger a cascade of long position liquidations toward the liquidity pockets sitting at $76,000.
Liquidation data confirms the market is currently « long-heavy »: approximately $270 million in long positions were liquidated during the failure to hold $82,500. The funding rate remains moderate however, indicating leverage has not yet reached extreme overheating territory — a necessary condition for healthy growth toward new all-time highs.
| Liquidity Zone | Price ($) | Dominant Order Type | Potential Impact |
|---|---|---|---|
| Critical Resistance | 83,765 | Sell — Whale Wall | Likely rejection or massive short squeeze |
| Immediate Pivot | 82,000 – 82,500 | Mixed | Short-term decision zone |
| Psychological Support | 80,000 | Buy — ETF Flows | Floor defended by institutional buyers |
| Panic Support | 76,000 – 78,000 | Buy — Liquidation Clusters | Major technical bounce zone |
IV. Halving Cycle Analysis: 2024–2028 Positioning
We are in May 2026 — two years after the fourth halving of April 2024, which reduced the miner reward to 3.125 BTC per block. This phase of the cycle is historically characterized by slow accumulation or a mid-cycle correction following a peak. The current cycle top was reached in October 2025 at approximately $126,000, placing the market in a digestion and redistribution phase.
Two competing theses dominate the outlook for the rest of 2026: the Extended Cycle thesis (supported by consistent ETF flows, predicts stabilization between $70,000 and $100,000 without a major crash) and the Historical Crash Scenario (based on on-chain NUPL data and Fed transitions, projects a cycle bottom between $45,000 and $50,000 around October–November 2026). Network hashrate is at historic highs, but miner profitability is under pressure from energy costs and relative price stagnation.
| Cycle | Halving Date | Price at Halving | Cycle Peak | Peak Date |
|---|---|---|---|---|
| Cycle 1 | Nov 28, 2012 | $12.35 | ~$1,100 | Late 2013 |
| Cycle 2 | Jul 9, 2016 | $640 | ~$19,700 | Dec 2017 |
| Cycle 3 | May 11, 2020 | $8,821 | ~$69,000 | Nov 2021 |
| Cycle 4 | Apr 20, 2024 | ~$65,000 | ~$126,272 | Oct 2025 |
V. Systemic Risks & Exogenous Factors
Quantum Vulnerability
The « Project Eleven » report highlights a long-term risk: quantum computing migration. Bitcoin’s current encryption standards could become vulnerable to next-generation quantum computers. While this risk is not immediate for May 2026, it is beginning to weigh on the « eternal store of value » narrative and is progressively being integrated into institutional risk models.
Tax Pressure & Corporate Exposure
New U.S. tax laws for 2026 are constraining certain accumulation strategies — most notably MicroStrategy’s — potentially forcing sales of up to 20% of holdings to manage unrealized capital gains accounting. This « accounting-driven » selling pressure, independent of market sentiment, could act as an artificial price ceiling in the coming months.
Bitcoin vs. Gold: The Ultimate Safe-Haven Test
Gold has asserted its dominance in 2026, reaching $5,595 per ounce. Central banks continue to accumulate massively (over 1,000 tonnes per year), creating a sovereign demand base that Bitcoin has not yet fully conquered. In the event of an Ormuz blockade escalation or global inflation resurgence, the correlation between Bitcoin and gold will be the ultimate test of BTC’s maturity as an institutional safe-haven asset.
VI. Key Levels, Scenarios & Operational Recommendations
Technical Level Map (May 2026)
- 🔴 R3 — $90,000: Target for a confirmed ascending wedge breakout on record ETF inflows
- 🟠 R2 — $85,000: Massive profit-taking zone identified on the daily chart
- 🟡 R1 — $82,500 / $83,765: Heatmap sell wall and former channel high — critical immediate barrier
- ⚪ PIVOT — $80,970: Current price, institutional flow equilibrium point
- 🟢 S1 — $78,000: Institutional buy zone identified by liquidity clusters
- 🔵 S2 — $72,000: Structural support — a break would invalidate the recovery structure
- 🟣 S3 — $60,000: Long-term cycle support — long-term holder buy zone
🚀 Bullish Scenario: The Legislative Breakout
If the CLARITY Act receives a favorable committee reception on May 14, the « risk-on » sentiment could propel BTC above $83,765. A massive short squeeze would then mechanically engage, targeting $85,000 then $90,000 before month-end. In this scenario, the daily RSI would enter overbought territory (>70) without immediate correction, driven by institutional FOMO and short-position buybacks.
🔻 Bearish Scenario: The « Warsh Crash »
An aggressive monetary stance from Kevin Warsh on May 15, paired with higher-than-expected inflation data, could trigger panic selling. Price would quickly lose the $80,000 support, targeting liquidity at $76,000. If that level fails to hold, a return toward $72,000, or even $60,000, should be anticipated to flush the leverage accumulated by recent ETF buyers.
Operational Recommendations for Professional Traders
- Tape Reading at $83,765: Declining volume on approach → likely rejection. Fast absorption with growing Open Interest → confirms move strength.
- Funding Rate Watch: Neutral or negative funding during a price rally is extremely bullish — it signals spot (ETF)-driven upside rather than fragile speculative leverage.
- Temporal Risk Management: Reduce leveraged exposure 24 hours before the May 14–15 events to avoid liquidations from bidirectional volatility (« whipsaws »).
Conclusion
Bitcoin in May 2026 is no longer the wild asset of previous cycles. Anchored in the U.S. financial system via ETFs and awaiting a landmark legislative framework with the CLARITY Act, its market structure has fundamentally evolved. The nine-day streak of $2.7 billion in net inflows testifies to structural institutional demand that refuses to be intimidated by technical resistances.
However, short-term fatigue signals are real: bearish divergences on the 4H chart, a massive sell wall at $83,765 on the heatmap, and the Warsh wildcard looming large. A consolidation phase or retracement toward $78,000 remains likely before any attempt to breach $90,000. The key to May lies in the 48 critical hours around May 14–15: the CLARITY Act on one side, the Federal Reserve on the other. Two opposing catalysts for a market structure under tension — momentum indicator vigilance remains essential before taking on large-scale positions.
⚠️ Disclaimer: This article is written for educational and informational purposes only. It does not constitute investment advice or a recommendation to buy or sell cryptocurrencies or any other financial asset. Cryptocurrency markets are extremely volatile and carry significant risks, including the total loss of invested capital. Always conduct your own research (DYOR) and consult a qualified financial advisor before making any investment decision.

