


As May 2026 begins, Bitcoin (BTC) is navigating a tight range between $80,140 and $81,900, consolidating above the major psychological threshold of $80,000. This position represents a 36.5% correction from the all-time high of $126,272 reached on October 6, 2025, yet it primarily reflects remarkable structural resilience: the asset has gained nearly 32% from its annual low of $60,057 recorded in February. Far from a capitulation, the market stands at a critical technical and fundamental confluence — the subject of this comprehensive analysis.
A Market Fundamentally Transformed by Institutionalization
The 2026 Bitcoin market no longer belongs to retail speculators of past cycles. It is now firmly anchored in massive institutional flows, passive management through spot ETFs, and corporate treasury strategies of unparalleled sophistication. This structural metamorphosis demands a new analytical framework — geopolitical, macroeconomic, and quantitative — to understand price formation and anticipate the next directional moves.
The Geopolitical Chessboard: From the Strait of Hormuz to Diplomatic De-escalation
Bitcoin’s valuation has become inseparable from the global geopolitical context. The Strait of Hormuz — through which approximately 20% of global oil trade transits — has emerged as an unexpected vector of cryptocurrency volatility. Early 2026 US-Iran tensions, particularly around a tanker toll plan potentially involving Bitcoin settlements to circumvent Western sanctions, reinforced the thesis of Bitcoin as an alternative sovereign reserve accessible to sanctioned states.
The situation changed radically in early May with the emergence of a diplomatic peace agreement between Washington and Tehran. The collapse in crude oil prices (–8% intraday) immediately triggered a dovish reassessment of Fed rate expectations, propelling a relief rally across all risk assets. The Dow Jones approached 50,000 points, the S&P 500 hit new all-time highs — and Bitcoin broke through the $80,000 resistance with conviction. Meanwhile, Admiral Samuel Paparo (INDOPACOM) publicly acknowledged in April the use of an active Bitcoin node in US military experiments, describing the protocol as a tool of « power projection » in cyberspace. This security establishment endorsement structurally strengthens Bitcoin’s institutional legitimacy in the United States.
Institutional Architecture: Spot ETFs and Treasury Engineering
The primary engine of the current price structure lies in the absorption capacity of US Bitcoin spot ETFs. These vehicles drained $2.44 billion in net inflows in April 2026 — an absolute annual record. The pace continued into May, with daily inflows exceeding $532 million on May 4th, concentrated around BlackRock’s IBIT and Fidelity’s FBTC. Unlike futures contracts, these flows require the physical acquisition of BTC from exchanges, mechanically exacerbating supply shortages. Flow analysis suggests that large entities (whales) have absorbed approximately 270,000 BTC in recent weeks, with an average cost basis around $80,300 — a psychological floor now fiercely defended by their asset management algorithms.
On the corporate treasury front, MicroStrategy holds 818,334 BTC (3.9% of total supply, valued at over $66.5 billion). The major revelation of May 5th: management intends to selectively sell marginal fractions of its holdings to fund dividends on its perpetual preferred stock STRC (which has already raised $8.5 billion in traditional markets). Michael Saylor demonstrated that an annual BTC appreciation rate of just 2.3% is mathematically sufficient to cover these obligations indefinitely — transforming Bitcoin, historically a zero-yield bearer asset, into fiat-denominated yield-generating collateral. A silent revolution in the very taxonomy of the asset.
On-Chain Dynamics: Confirming a Structural Inflection
May 2026 on-chain metrics confirm a decisive transition. On May 4th, 14,600 BTC were realized in profit in a single day — the highest daily peak since December 2025. The STH-SOPR (Short-Term Holder Spent Output Profit Ratio) sits at 1.016 and has maintained a position above the equilibrium threshold of 1.00 since mid-April: moved coins are being sold at a profit — a sign of structural health, not capitulation.
The contrast with the February-March trauma is striking: the market had then suffered cumulative net losses of –398,000 BTC. In May, this balance has returned to +20,000 BTC over 30 days — the first sustained positive reading since December 2025. While still far from the euphoria of bull market peaks (130,000 to 200,000 BTC in net profit), this confirms that the corrective dynamic is structurally over. The market’s foundation is cleansed, capital confidence restored.
Microstructure: The Liquidation Heatmap
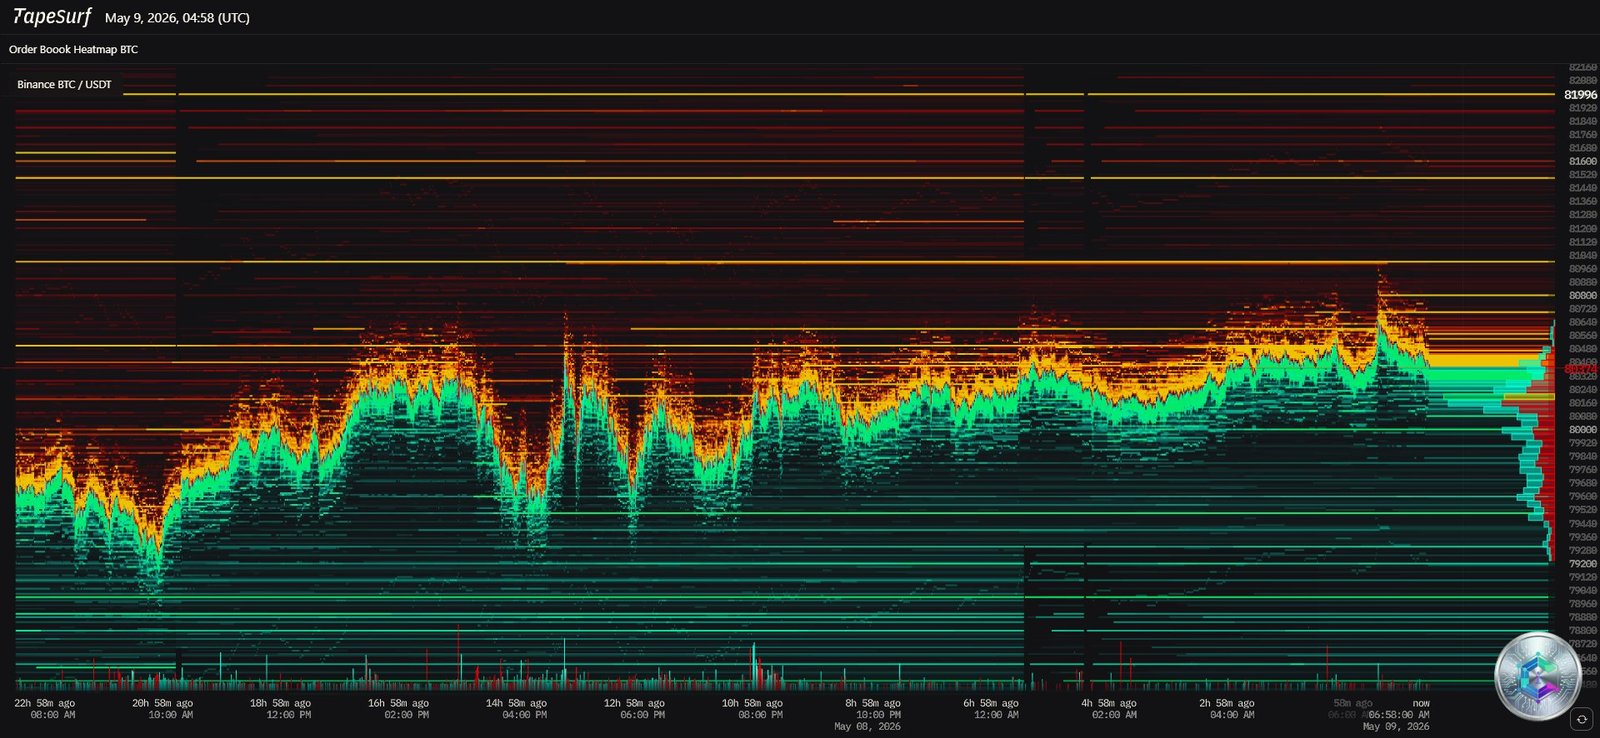
The order book heatmap analysis (TapeSurf, Binance BTC/USDT) reveals an eloquent stratification of major market participants’ intentions. Modern markets, driven by market-making algorithms and institutional liquidity hunting strategies, have an inherent propensity to gravitate toward maximum density pockets:
- $87,000 – $91,000 (Yellow/Red — Maximum Density): Colossal concentration of short positions. A breakout above $85,000 would trigger an extremely violent short squeeze, mechanically propelling the price beyond $90,000 through algorithmic suction.
- $80,000 – $84,000 (Green/Cyan — Moderate to High Density): Leveraged long support base currently under test. Critical zone: repeated testing erodes it. A clean break below $80,000 would trigger a devastating liquidation cascade for over-leveraged operators.
- $76,000 – $79,000 (Dark Zone — Low Density): Liquidity gap. In a downside scenario, price would traverse this zone at vertiginous speed, as support algorithms are absent from this stratum.
Daily Chart Technical Analysis: The Macro View
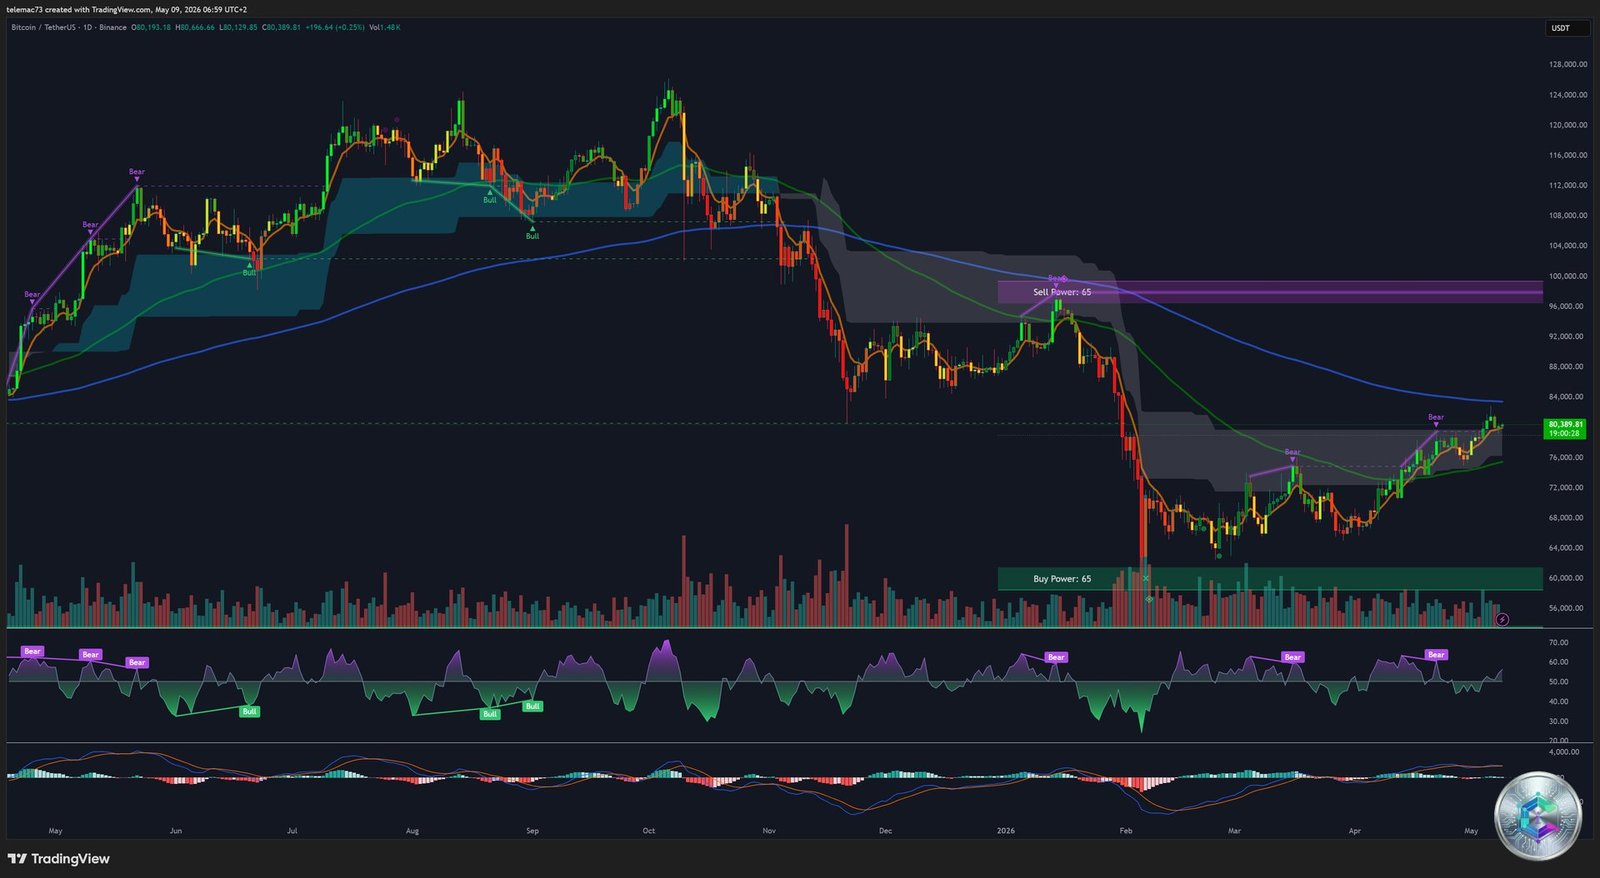
On the daily chart, Bitcoin displays a vigorous recovery architecture following the plunge from $116,000 to the depths of $60,000. The 200-day moving average (SMA: $79,075 / EMA: $79,491) represents the absolute Rubicon of institutional technical analysis — the universally accepted line of demarcation between a structurally bullish and bearish market. By maintaining above it, Bitcoin transforms this formerly insurmountable resistance into an essential dynamic support level.
The moving average framework reveals a directional conflict typical of post-shock accumulation zones: the short-term MAs (5, 20 days) accompany the recent impulse with buy signals, while intermediate MAs (50, 100 days) retain a bearish bias — reflecting the corrective overhang. The RSI 14 at 49.26 is particularly eloquent in its neutrality: neither overbought nor oversold. Considerable theoretical space remains for robust bullish expansion before the critical threshold of 70. Pivot points define the key intervention levels: Central Pivot at $80,143, Classic S1 at $79,996 as the bulwark of bullish integrity, with Fibonacci resistances between $80,230 and $80,372 as the first immediate targets.
4-Hour Analysis: The Bull Flag vs. Rising Wedge Duel
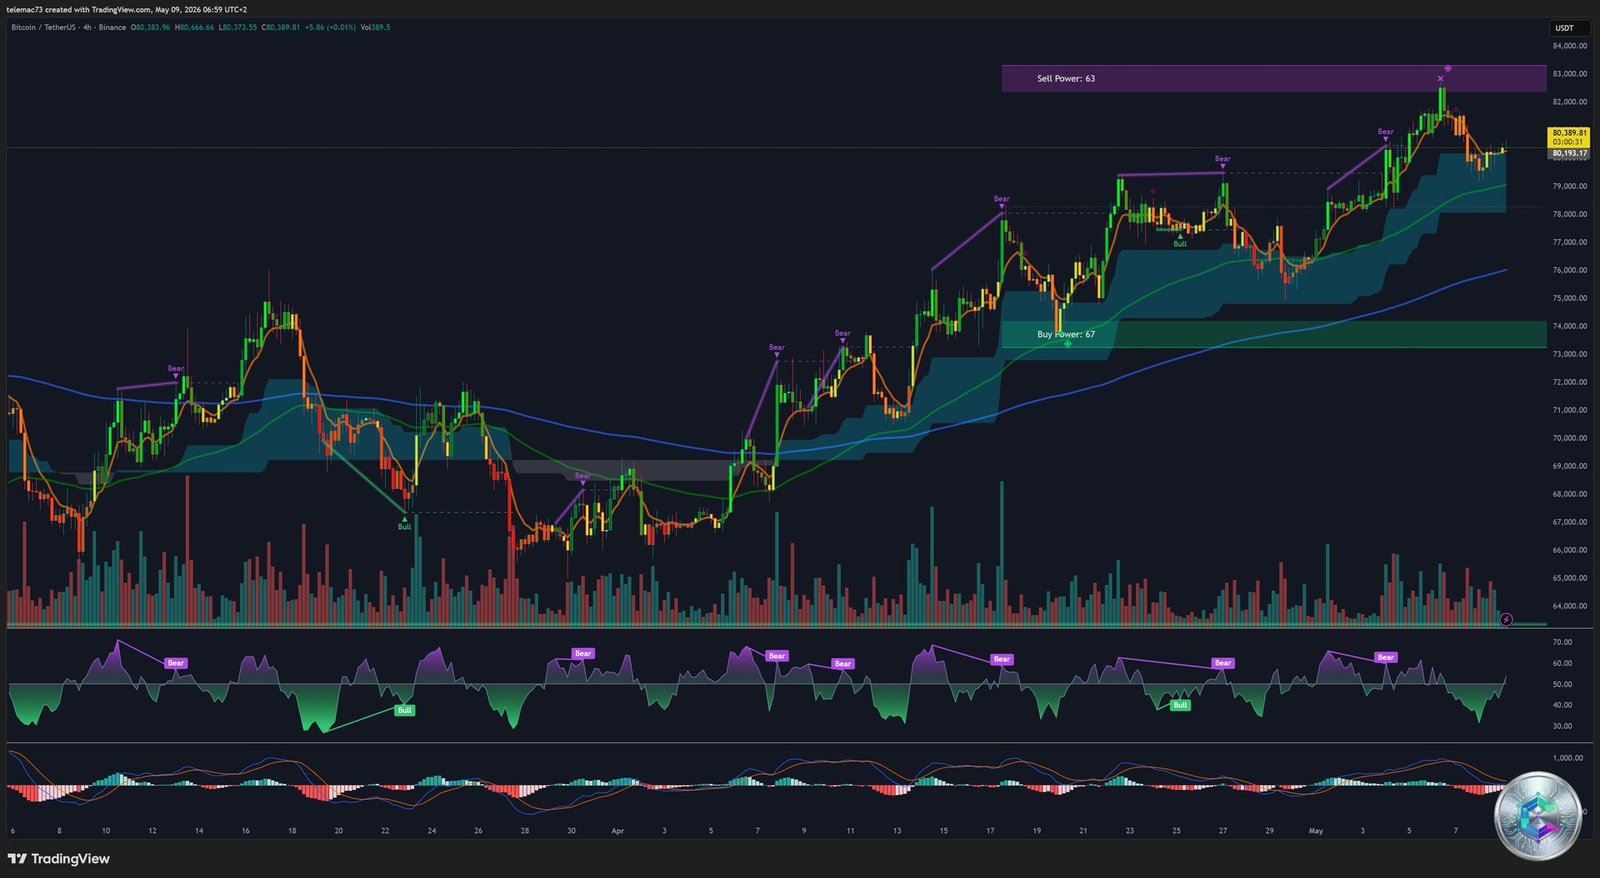
The 4-hour chart is the theater of a crucial interpretive battle between two superimposed technical patterns with diametrically opposed implications.
📈 The Bull Flag: Price action draws a violent impulse (the « flagpole ») followed by an orderly consolidation within a slightly ascending channel (the « flag »). This continuation pattern has a success rate exceeding 68% in recent quantitative contexts. Its validation requires an impulsive breakout above the upper channel resistance, accompanied by significant volume expansion (ideally ≥ 180% of average volume). The projected target would then be the $84,900–$85,000 zone, opening the path toward $90,000.
📉 The Rising Wedge: The same architecture can be interpreted as a rising wedge — higher highs, but with a progressive deceleration of momentum. Statistically, this pattern resolves to the downside in 83% of cases. Momentum indicators (RSI/stochastic on 4H) exhibit nascent bearish divergences. If the critical support zone of $80,965–$81,105 (Volume Point of Control) yields, the projected drop would send the asset toward $76,588, or even $74,000 in a full measured move scenario.
15-Minute Analysis: The Algorithmic Microstructure Chessboard
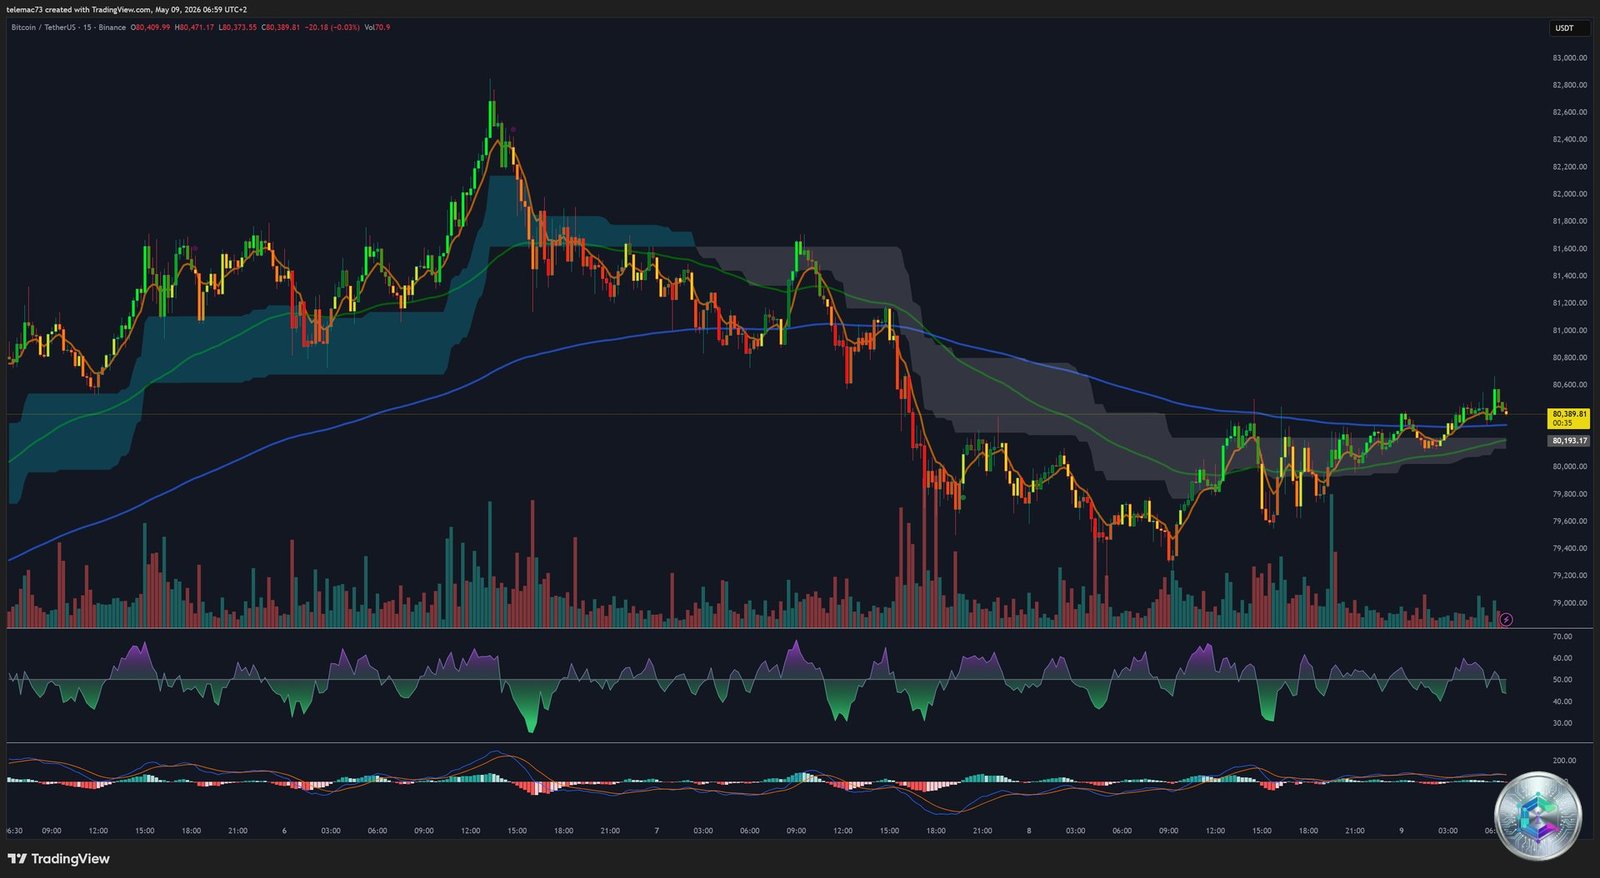
The 15-minute chart reveals the hyperactivity of HFT (High-Frequency Trading) algorithms within an extremely tight corridor: $81,250 – $82,320. Aggressive selling waves crash against an invisible yet impenetrable support, immediately countered by mechanical « V-shaped » bounces. Oscillators swing frantically from deep oversold zones to overbought peaks — a market responding to mathematical levels rather than fundamentals.
Camarilla pivots find their full operational relevance here: their L3/H3 bands, tightly clustered around the opening price, create an ideal playground for scalping robots programmed on mean-reversion theory. The challenge on this timeframe is not to trade the range, but to detect its rupture: an abnormal expansion of the Cumulative Volume Delta (CVD) combined with an explosion in ATR will signal that a major macro entity is about to break the Camarilla containment to initiate an authentic and persistent directional move on the 4H.
Bitcoin Dominance and the Eclipse of Altcoins
Bitcoin’s overwhelming dominance in May 2026 is symptomatic of a particularly punishing environment for alternative cryptocurrencies. Authority figures such as Arthur Hayes, at the Consensus Miami 2026 summit, have articulated devastating theses: the ongoing systemic correction, combined with institutional concentration on ETF-approved assets, could ultimately render 99% of altcoins fundamentally worthless in terms of long-term market capitalization capture.
The central postulate is that Bitcoin’s valuation has decoupled from technological innovation narratives to become almost exclusively correlated with fiat money supply expansion and central bank liquidity conditions. When liquidity contracts (Fed rates maintained between 3.5% and 3.75%), institutional capital massively flees the asymmetric risk of altcoins to take refuge in the absolute decentralization and unparalleled institutional liquidity of the Bitcoin network.
Probabilistic Synthesis: Two Directional Scenarios
🟢 Bullish Scenario — Moderate to Strong Probability
Validation requires a convincing daily close above the resistance zone of $82,320–$85,000, accompanied by institutional volume expansion. This breakthrough would immediately invalidate the rising wedge threat and confirm bull flag continuation. More significantly: this breakout would trigger the cascade of short liquidations concentrated between $87,000 and $91,000 (visible on the heatmap), generating a mechanical and self-fulfilling short squeeze that would propel the price toward the paradigmatic target of $100,000 in the medium term. The sustained return to an on-chain profitability regime (+20,000 BTC/30d) provides the psychological cushion needed for long-term holders to refrain from flooding the market with supply during this ascent.
🔴 Bearish Scenario — Moderate Probability
If institutional supply manages to stifle demand at the upper 4H channel resistance, the rejection will materialize through the loss of the critical support at $80,965. The market would then engage in a punitive sweep of the leveraged longs accumulated between $80,000 and $84,000. The drop would fluently traverse the $79,000–$76,000 liquidity gap, support algorithms being absent from this stratum, with a potential retracement toward $74,300–$72,000. This scenario would not invalidate the long-term macro-bullish trend — it would simply impose a period of forced deleveraging and exhausting lateral compression before the next expansion phase, likely deferred to the following quarter.
Conclusion: A Historic Inflection Point
The Bitcoin market in May 2026 has definitively transcended the speculative arena of past cycles. It has evolved into a highly financialized asset class, hypersensitive to global macro-energy asymmetries, orchestrated by avant-garde corporate capital engineering, and disciplined by uncompromising algorithmic levels. The outcome of the titanic battle unfolding within the tight range of $79,000–$82,000 will determine the market’s directional polarity for the second half of 2026. The two forces at play are of comparable magnitude — it is the next weekly close on institutional volumes that will dictate the verdict.
⚠️ Disclaimer: This article is written for educational and informational purposes only. It does not constitute investment advice, nor a recommendation to buy or sell digital assets or any other financial instrument. Cryptocurrency markets are extremely volatile and carry a high risk of capital loss. Please consult a licensed financial advisor before making any investment decision.

