
Introduction: Bitcoin Under Maximum Structural Pressure
The digital asset ecosystem is navigating a period of singular structural complexity. As of June 1, 2026, Bitcoin (BTC) hovers around $72,970, trading below the psychological $73,000 threshold amid diverging technical signals, intensifying macroeconomic headwinds, and unprecedented institutional dynamics.
The central thesis of this analysis centers on a stark dichotomy: on one side, an institutional environment showing clear signs of derisking (risk exposure reduction); on the other, a price structure struggling to hold critical historical support levels. By integrating macro-financial data, order book fingerprints, and multi-timeframe technical signals, we can model with precision the probabilities of a major directional move in the weeks ahead.
1. Macroeconomic Context: The Fed in Hawkish Mode
1.1. Restrictive Monetary Policy and Bond Yields
The May-June 2026 macroeconomic landscape is dominated by persistent tightening of global liquidity conditions. The Federal Reserve maintains a target range for the federal funds rate between 3.50% and 3.75%. However, market narratives have undergone an aggressive revision: following inflation reports significantly above analyst projections, CME FedWatch expectations have radically shifted.
Markets now price in approximately 40% probability of another rate hike at the June 16-17 FOMC meeting — a probability that was near-zero just one week ago. For the July meeting, this probability has surpassed the critical 50% threshold.
The 10-year US Treasury yield hovers around 4.6%, while the 30-year touched a historic high of 5.197% in May 2026 — a level unseen since the 2007 financial crisis. At these yields, risk-free sovereign bonds exert massive gravitational force on institutional capital, directly competing with Bitcoin. The 2022 parallel is striking: the rate surge from 1.5% to 4.2% catalyzed BTC’s collapse from $47,000 to below $16,000.
1.2. Geopolitics, Energy Markets and the US Dollar
US-Iran tensions maintain an elevated risk premium across global energy markets. Brent crude holds above $100 per barrel, fueling structurally « sticky » inflation that forces the Fed to maintain its restrictive stance. For Bitcoin, this creates a dual headwind: no accommodative QE injection is possible, and a stronger DXY mechanically exerts deflationary pressure on all dollar-denominated assets.
2. Institutional Flow Analysis: The Historic ETF Exodus
2.1. May 2026: A Month of Institutional Hemorrhage
May 2026 marks a critical inflection point. US Bitcoin spot ETFs recorded net outflows of $2.30 billion — the largest monthly purge of the year and the most violent since November 2025. The asymmetry is structurally alarming: BTC declined only 3.69% in May, yet outflows were ten times greater than those seen in February 2026, when BTC dropped 14.8%.
| BTC Spot ETF Indicator | Volume (May 2026) | Comparison |
|---|---|---|
| Monthly Net Outflows | – $2.30B | April: + $1.97B |
| Worst Week (May 11-17) | – $1.26B | Worst since late January 2026 |
| BTC Performance (May) | – 3.69% | Feb: -14.8% for only -$206M outflows |
| Historical Net Cumulative | $55.79B | April peak: $58.09B |
| Daily Outflow IBIT (BlackRock) | – $68.9M | FBTC (Fidelity): -$36.3M |
2.2. The June Paradox: Seasonality vs. Distribution Pressure
Historically, June shows a median return of +2.58% for BTC, with only five negative monthly closes over twelve years of price history. Yet structurally lower June trading volumes can amplify volatility in either direction. The analytical suspense of the coming weeks will hinge on whether seasonal tailwinds can absorb the massive distribution pressure from institutions and long-term holders.
3. TapeSurf Heatmap: Order Book X-Ray
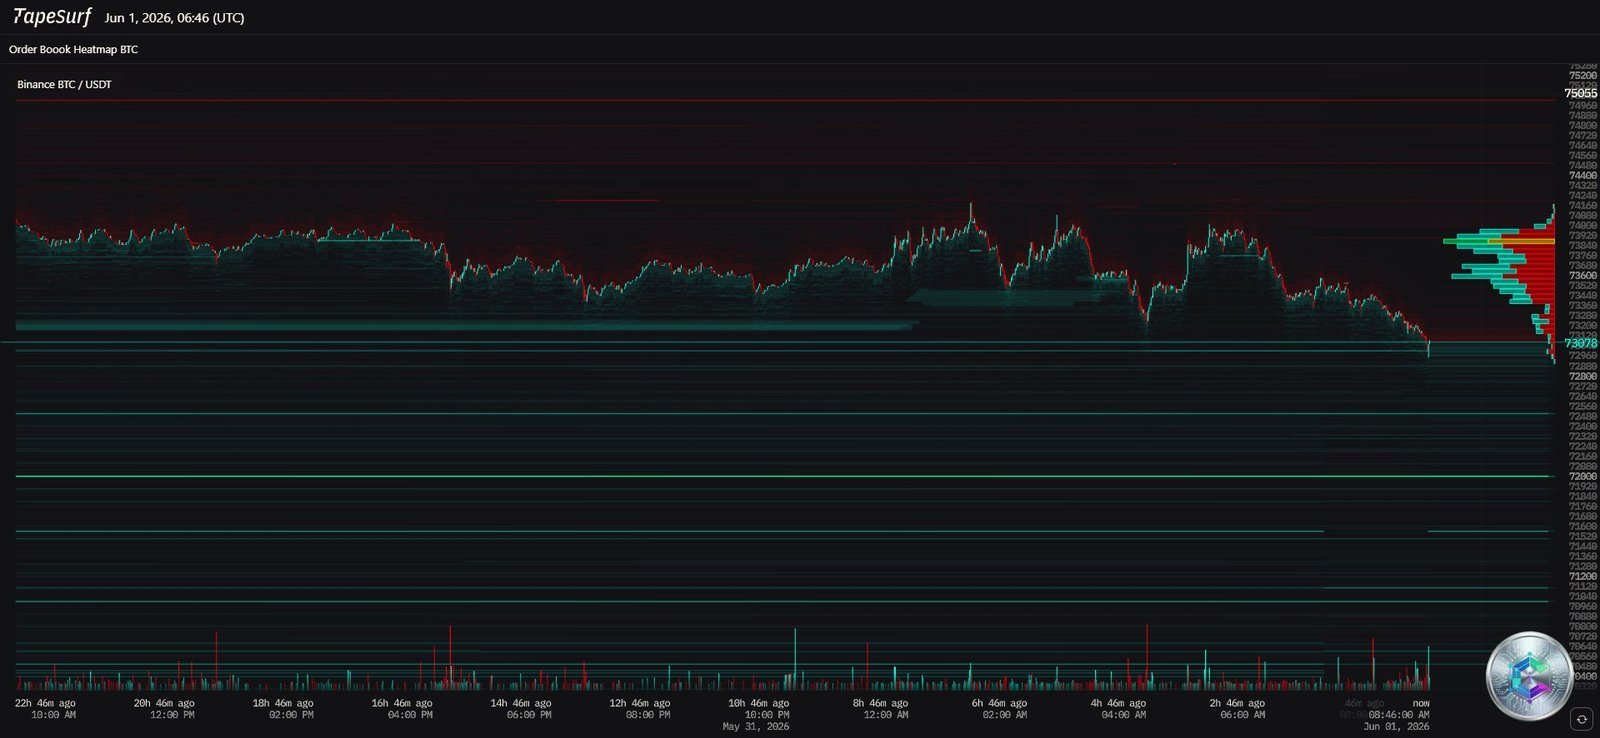
3.1. Anatomy of a Glaring Asymmetry
The TapeSurf heatmap analysis reveals three decisive elements:
- The Hegemonic Sell Wall: A dense concentration of bright red lines spans from $73,600 to $75,000, signaling massive limit sell orders. This « titanium wall » blocks any bullish progression attempt and acts as the primary market ceiling.
- The Buy Liquidity Void: Below current price (under $72,900), cyan/green lines are sparse and dim. This imbalance creates a « path of least resistance » downward, where even moderate sell orders cause disproportionate slippage.
- The Liquidation Magnet: Data identifies a dangerous liquidity gap between $66,000 and $60,500, with over $350 million in leveraged long positions concentrated around $60,500.
4. Multi-Timeframe Technical Analysis
4.1. Daily Chart (1D): Structural Breakdown Underway
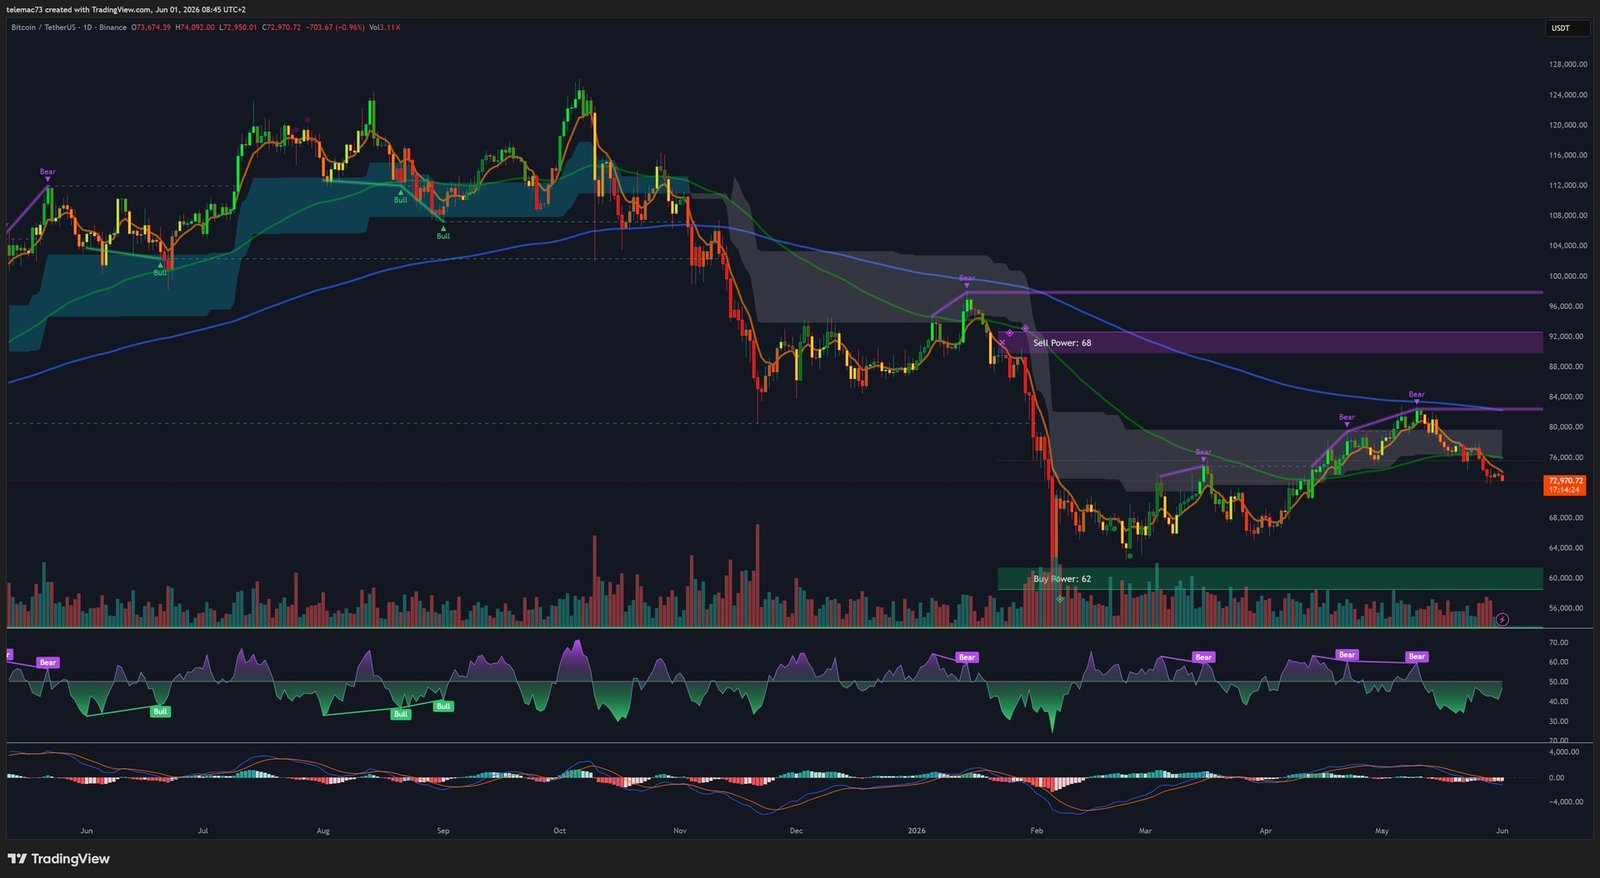
The daily chart exposes a classic Bear Flag continuation pattern. Each rebound attempt (Lower Highs) is systematically sold. Indicators confirm the bearish picture:
- MACD: Growing red histogram bars below zero, with a « Death Cross » forming — a toxic signal for bulls.
- RSI: Around 40, aggressively sloping downward, with no visible bullish divergence. The weakness has room to extend further.
- Moving Averages: The 50-day MA caps prices from above. The 200-day MA, now declining since late April, acts as the ultimate macro support around $61,400.
4.2. 4-Hour Chart (4H): Seller Hegemony
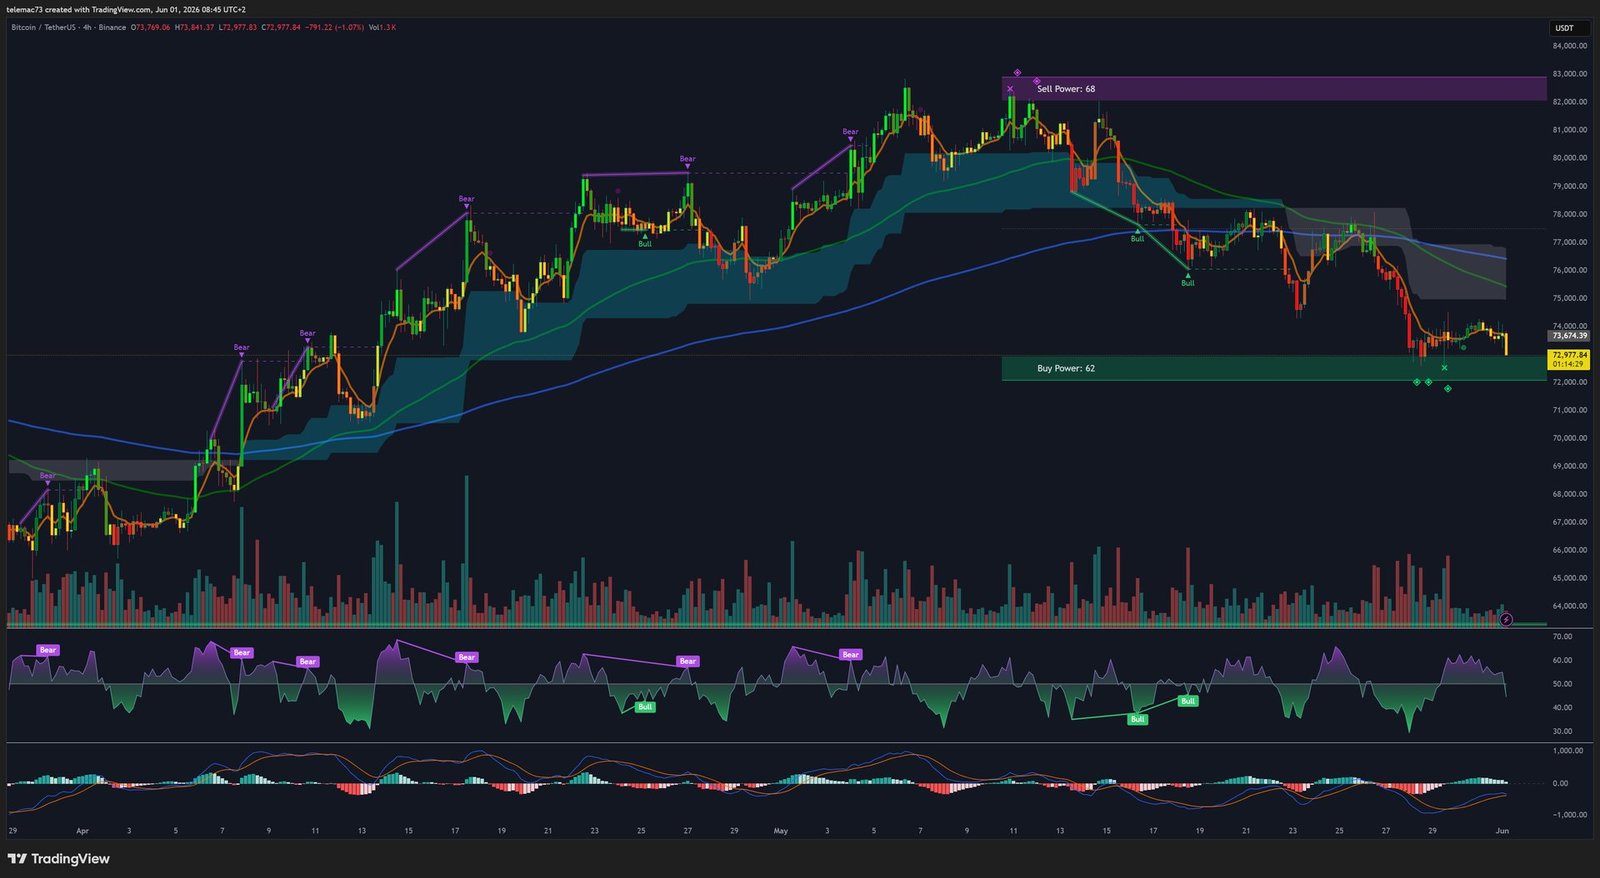
On the 4H, flow asymmetry is quantified: Sell Power at 68 vs. Buy Power at 62. Price has violently broken through the Ichimoku cloud (now acting as resistance), and a compression triangle resolved to the downside in a large bearish momentum candle. MACD is deeply red; RSI flirts with the 30-35 zone — momentum fully belongs to sellers.
4.3. 15-Minute Chart (15m): Local Capitulation and Extreme RSI
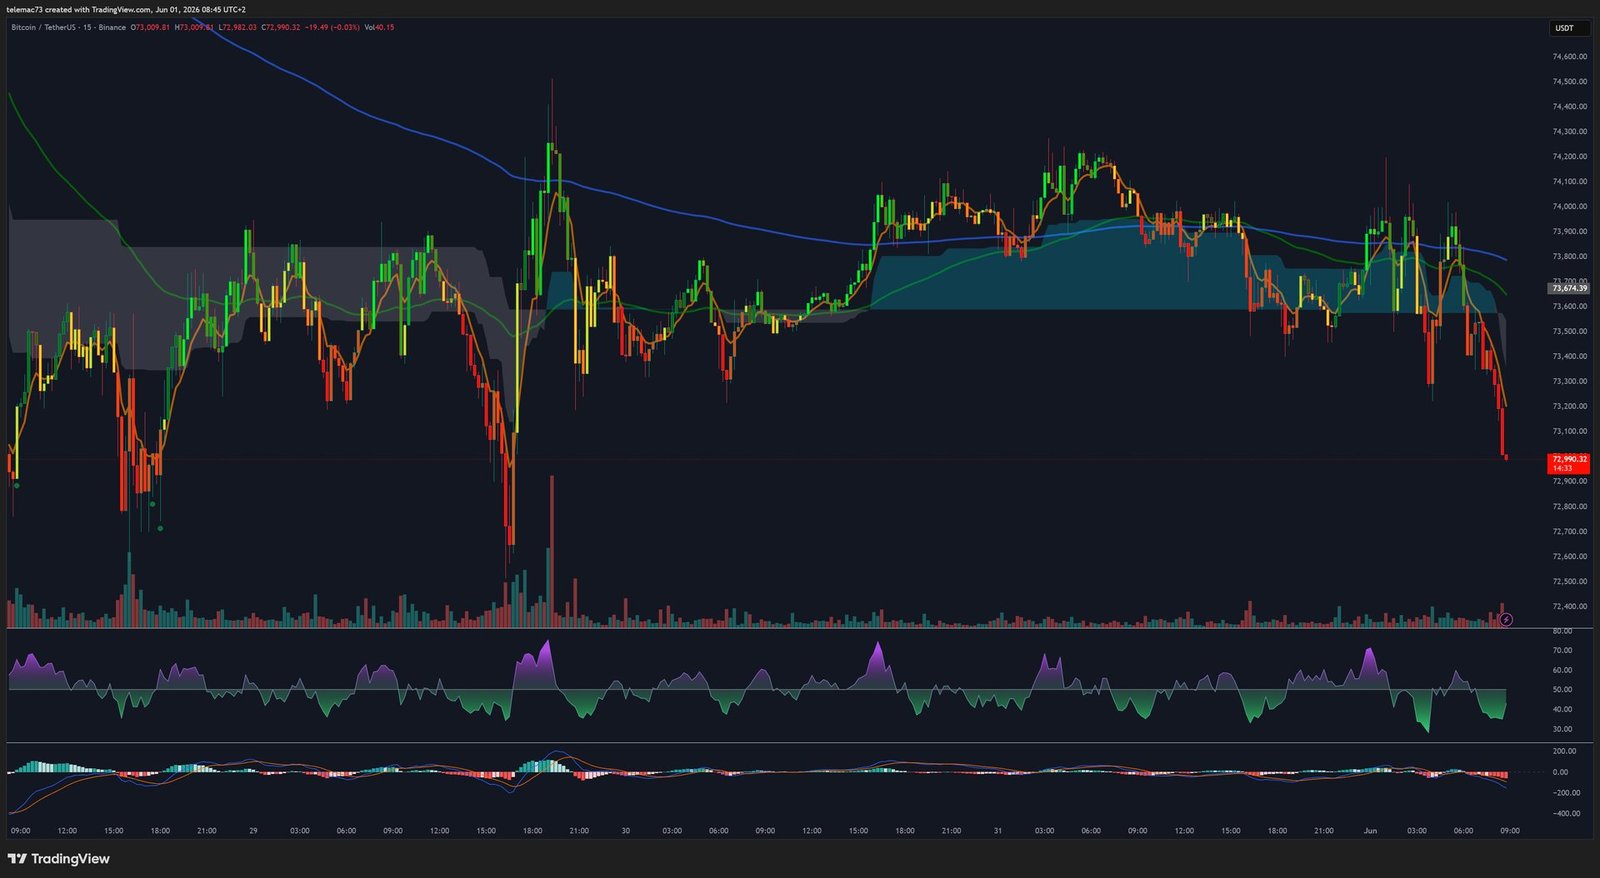
The 15m reveals an uninterrupted cascade of bearish candles, with the RSI plunging to historically extreme levels (estimated around 15-20). This statistical anomaly typically triggers automated mean-reversion buying algorithms, producing a mechanical bounce (« dead cat bounce ») — but that bounce will immediately collide with 4H resistances and the $73,600 sell wall identified on the heatmap.
5. Key Level Matrix and CME Gaps
| Level Type | Price (USD) | Analytical Basis |
|---|---|---|
| Macro Bullish Resistance | $82,366 – $84,000 | Fibonacci extension — only valid in case of full structural reversal |
| Structural Resistance | $79,108 | Upper Fibonacci retracement, former bullish trend break |
| Glass Ceiling (Sell Wall) | $73,600 – $75,000 | TapeSurf heatmap — visually confirmed massive sell limit orders |
| Central Pivot Point | $73,835 | Daily pivot — price below confirms bearish bias |
| Consolidation Support | $68,000 – $70,000 | Major Fibonacci retracement, identified institutional demand |
| Hourly Support | $66,000 – $66,700 | Pre-liquidation floor, upper edge of the liquidity void |
| Ultimate Support (Magnet) | $60,500 – $61,400 | 200-day MA + $350M leveraged longs awaiting liquidation |
CME Gaps also play a critical role: unlike 24/7 spot markets, CME Bitcoin futures create continuity gaps over weekends. These gaps carry a statistically high probability of being « filled, » acting as invisible gravitational recall forces that explain seemingly irrational mid-week price movements.
6. Synthesis and Probabilistic Scenarios
Scenario 1 — Liquidation Cascade (Primary Bias)
The confluence of bearish signals is overwhelming: $2.3B ETF hemorrhage, sovereign yields >5%, impenetrable sell wall at $73,600, daily Bear Flag breaking down, MACD Death Cross forming. In this scenario, the 15m RSI bounce exhausts quickly. The market endures a new bearish impulse that breaks $68,000, sucking price through the liquidity void toward $60,500 — where $350M in leveraged longs await liquidation in a final capitulation event and a generational accumulation zone ahead of Q4.
Scenario 2 — Unexpected Short Squeeze (Alternative Scenario)
If US inflation surprises to the downside in early June, or geopolitical tensions ease unexpectedly, the hawkish narrative evaporates. A breakout above $75,000 would trap billions in short positions identified above $70,000. Forced covering of those positions would propel BTC through the 4H Ichimoku cloud, targeting $79,108 and potentially $80,000 – $90,000 (Polymarket predictive markets consensus). The daily MACD would then curve to print a « Golden Cross, » validating Bitcoin’s historically positive June median return (+2.58%).
Conclusion
Bitcoin’s market topology on June 1, 2026 is ruthlessly complex. The $72,970 price level rests on technically eroding foundations, pinched between massive institutional withdrawal ($2.3B in May) and a prohibitively expensive cost of capital (US 10-year at 4.6%). Bears control momentum across short and medium timeframes. Asymmetric risk points heavily toward the activation of the $60,500 liquidity magnet.
Any capital deployment in this environment requires a formal invalidation of the bearish bias through a clear recovery above the pivotal $73,835 threshold, confirmed by significant institutional volume. Without this catalyst event, technical gravity will reassert itself inevitably.
⚠️ Disclaimer: This article is produced for educational and informational purposes only. It does not constitute investment advice, a recommendation to buy or sell any digital asset, or any form of financial guidance. Cryptocurrencies are highly volatile and speculative assets. All investments carry risk, including the total loss of capital. Please consult a licensed financial advisor before making any investment decision.