
On March 6, 2026, Bitcoin (BTC) is trading in a narrow range between $70,417 and $70,922, amid an atmosphere of absolute panic among retail market participants — with the Fear & Greed Index collapsing to an anxiety-inducing score of 18 (Extreme Fear). Yet beneath this surface-level panic, fundamental, on-chain, and technical data reveal a far more nuanced reality: a silent institutional accumulation and algorithmic preparation for a major directional move.
🌍 1. Macroeconomic Environment: Bitcoin Under High Pressure
1.1 The Energy Shock and Structural Inflation
One of the most significant systemic catalysts of early March 2026 is the unprecedented surge in LNG maritime freight rates, which have brutally jumped from $40,000 to a crushing peak of $300,000 per day. This major logistical shock immediately reignites fears of runaway inflation, forcing the Federal Reserve to maintain restrictive interest rates — mechanically weighing on all risk assets, Bitcoin included.
The rising energy costs also directly impact Bitcoin miners, whose operating margins are being squeezed, potentially forcing them to liquidate portions of their BTC reserves. Adding to this pressure is the imminent release of the US Non-Farm Payrolls (NFP) report, pushing institutional portfolio managers to aggressively de-risk their positions.
1.2 The Relentless Hegemony of the US Dollar (DXY)
The US dollar has posted a spectacular +8% YTD gain in 2026, representing the most formidable headwind for Bitcoin. A strong dollar makes BTC acquisition more expensive for international investors, while attractive bond yields significantly raise the opportunity cost of holding non-yield-generating assets.
1.3 Geopolitics: Global Realignments and Bitcoin as a Safe Haven
India is executing a major strategic pivot, quietly distancing itself from BRICS partners to strengthen ties with the United States and Israel. Meanwhile, attacks on Middle Eastern oil infrastructure have sent Brent Crude surging +6.4% to $77.57 per barrel, triggering a classic flight-to-safety move — gold breaking above $5,400/oz (+1.88%).
Particularly noteworthy: Iran’s largest crypto exchange, Nobitex, recorded an unexplained spike in capital withdrawals — powerfully illustrating Bitcoin’s thesis as a censorship-resistant asset and last-resort store of value during acute sovereign crises.
| Macro Factor | Data (March 2026) | BTC Impact |
|---|---|---|
| LNG Freight Rates | $40K → $300K/day | ⬇️ Short-term bearish |
| DXY Dollar Index | +8% YTD | ⬇️ Structural bearish |
| Nobitex Withdrawals (Iran) | Unquantified spike | ⬆️ Moderately bullish |
| Brent Crude | +6.4% at $77.57/barrel | ↔️ Mixed |
| NFP (US Jobs) | Pending March 6 | ⚡ Volatility event |
📊 2. Market Microstructure: The Silent Institutional Accumulation
2.1 The Spectacular Resurgence of Spot Bitcoin ETFs
Spot Bitcoin ETFs have just weathered the most severe drawdown of their young history since their landmark January 2024 launch: a massive $8.9 billion in cumulative net outflows. The average realized cost basis for ETF holders sits around $79,000, mechanically placing the vast majority of institutional buyers in an underwater position.
However, data from early March 2026 signals a lightning-fast structural reversal: in just five trading sessions, $1.5 billion in fresh capital has re-entered these vehicles. March 2nd marked a genuine psychological inflection point with $458.2M in net inflows and zero outflows across all twelve US-listed funds. On March 4th, BlackRock’s IBIT ETF alone absorbed $306.6M in a single session.
| ETF Provider | Ticker | Flows (Early March 2026) |
|---|---|---|
| BlackRock | IBIT | +$882M (weekly) |
| Fidelity | FBTC | +$156M (weekly) |
| Bitwise | BITB | +$148M (weekly) |
| Grayscale | GBTC | +$102M (weekly) |
| ARK Invest | ARKB | +$5.7M (daily, March 2) |
In total, Spot Bitcoin ETFs now manage a monumental $88.4 billion in AUM, representing approximately 6% of total Bitcoin supply in circulation. The return of these large-scale capital flows at what Wall Street perceives as « discounted » prices strongly suggests that smart money is systematically buying the dip.
2.2 On-Chain: Seller Exhaustion and Whale Accumulation
The composite Bitcoin Bull Score remains at a rock-bottom 10/100, suggesting the recent bounce toward $74K is more of a technical relief rally than the genesis of a new bull cycle. Nevertheless, structural selling pressure is collapsing: spot demand has improved from -136,000 BTC at the start of 2026 to just -25,000 BTC in early March.
More critically: Long-Term Holders (LTH) have literally shut the distribution spigot. Their 30-day selling rate has fallen from 904,000 BTC in late November to just 276,000 BTC — the lowest level recorded since June 2025. Simultaneously, whale wallets (100,000 to 1,000,000 BTC) have been silently accumulating since February 19th.
2.3 Short Squeeze and Derivatives Microstructure
During the extended consolidation between $63,000 and $70,000, perpetual futures funding rates were deeply negative — retail market consensus was overwhelmingly short. When ETF spot flows pushed prices beyond $70,000 and then $73,000, a forced liquidation cascade estimated at $80–110M in just 45-60 minutes amplified the move. This dual engine — institutional spot ETF demand as the foundation, short liquidation cascade as the pyrotechnic amplifier — explains both the bullish impulse and the subsequent rejection below $74,000.
📈 3. Multi-Timeframe Technical Analysis
3.1 Daily Chart: The Macroeconomic Structure
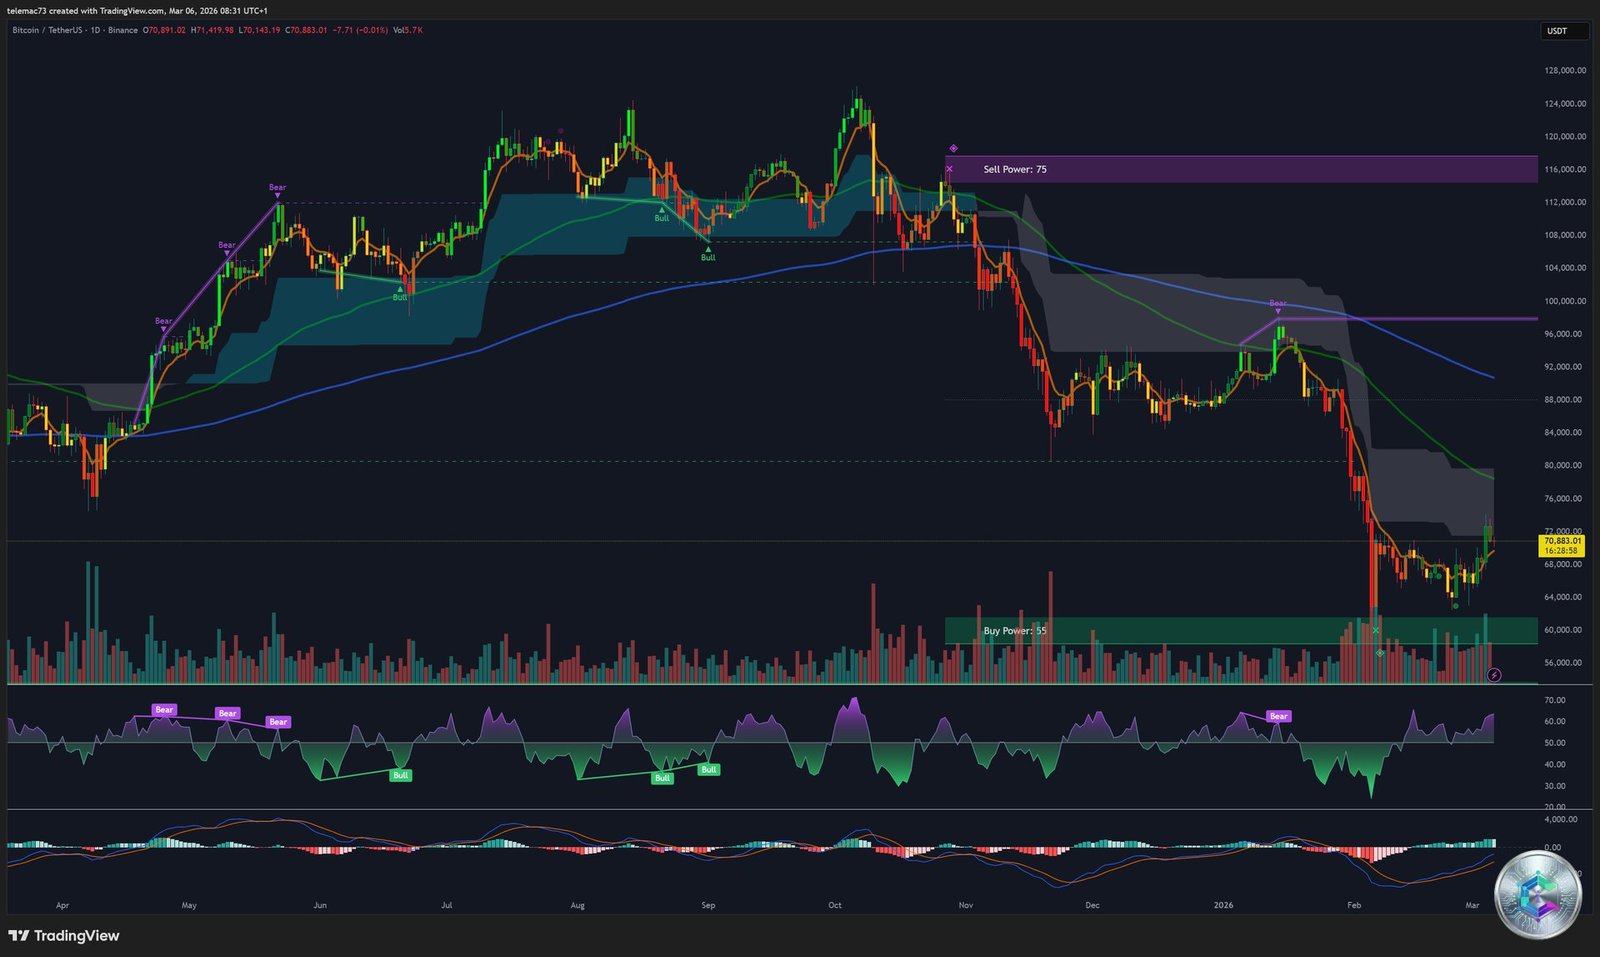
The daily chart illustrates the complete cycle: a distribution top at ~$126,000 in late 2025, followed by a violent descent to a capitulation low of approximately $60,000. Critical levels to monitor:
- 200-day EMA at $72,604: the structural demarcation line between bull and bear market. Bitcoin currently trading below it validates the ongoing bearish regime.
- Major resistance corridor: $73,750 – $74,400: two-year systemic market pivot. A confirmed daily close above would officially trigger a new secular bull run.
- Bollinger Bands: midline at $68,011, upper band at $72,140, lower band (ultimate support) at $63,882.
- ADX at 39.63: titanic directional force, setting the stage for a violent breakout from the current range.
3.2 4-Hour Chart: Indecision and Volatility Compression
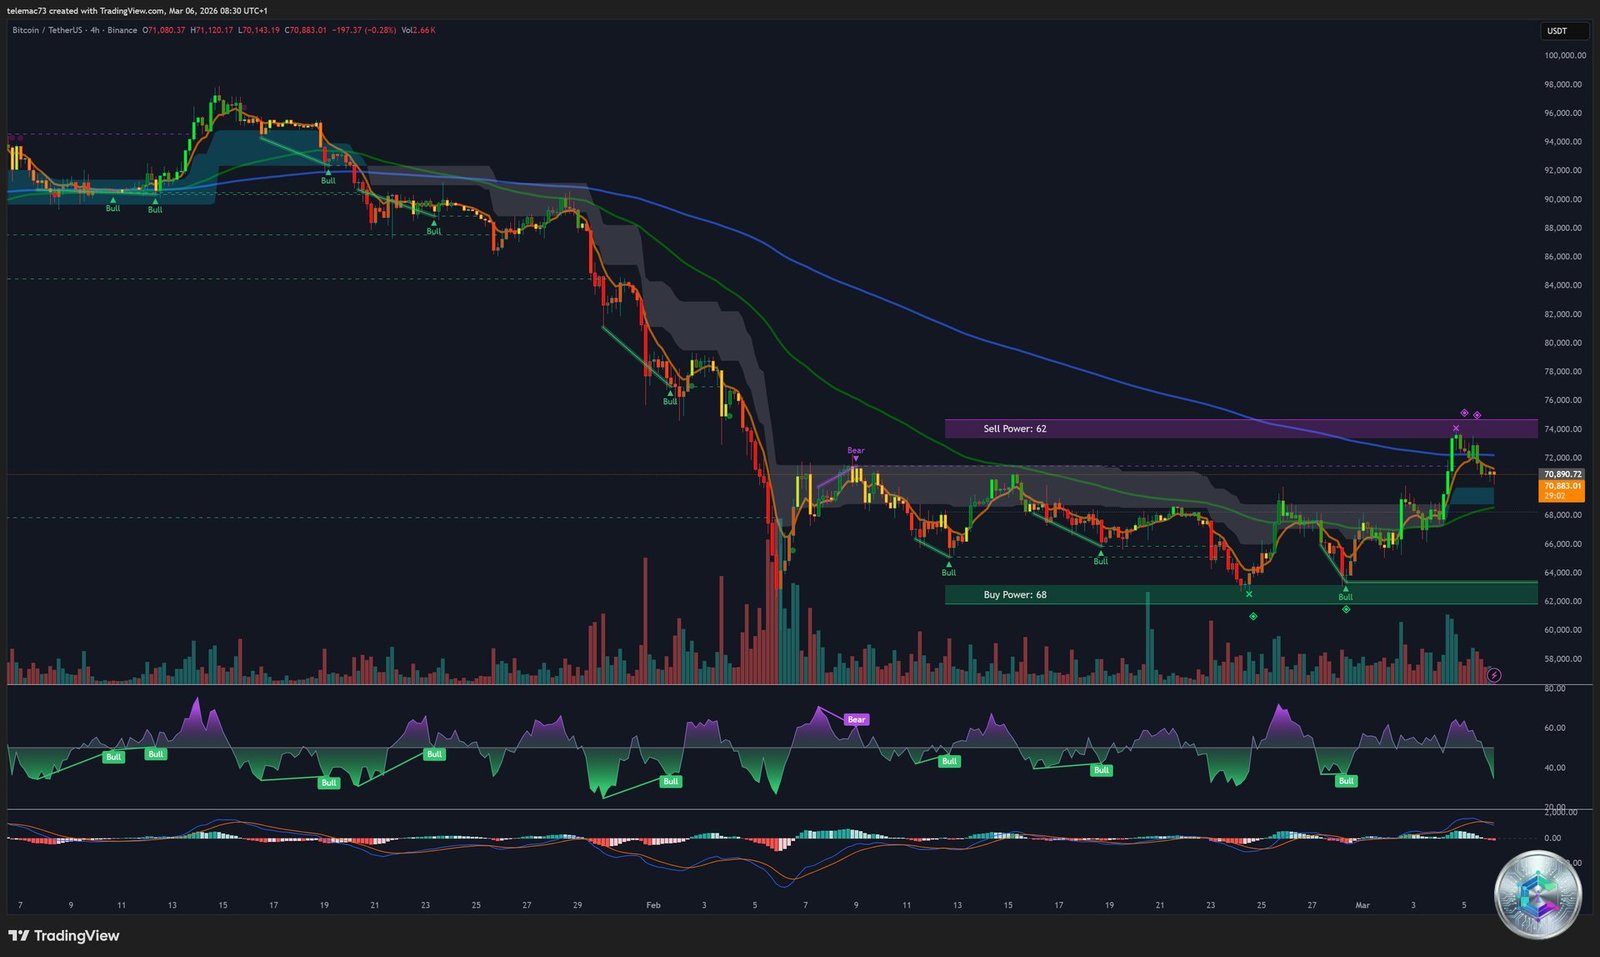
The 4H timeframe highlights an asymmetric compression within a tight $67,800–$69,000 channel, forming a potential bull flag whose resolution will dictate a 5–10% directional move.
- RSI at 48.34: strict mathematical neutrality — bullish energy has not been prematurely exhausted.
- Stochastic %K at 79.57 / %D at 76.32: dangerously flirting with overbought territory (80 threshold), raising the probability of an imminent rejection if spot volumes don’t support the breakout.
- MACD: histogram at 1,339.83 pts with a bullish signal-line crossover — the textbook technical signature of institutional absorption.
3.3 15-Minute Chart: High-Frequency Noise
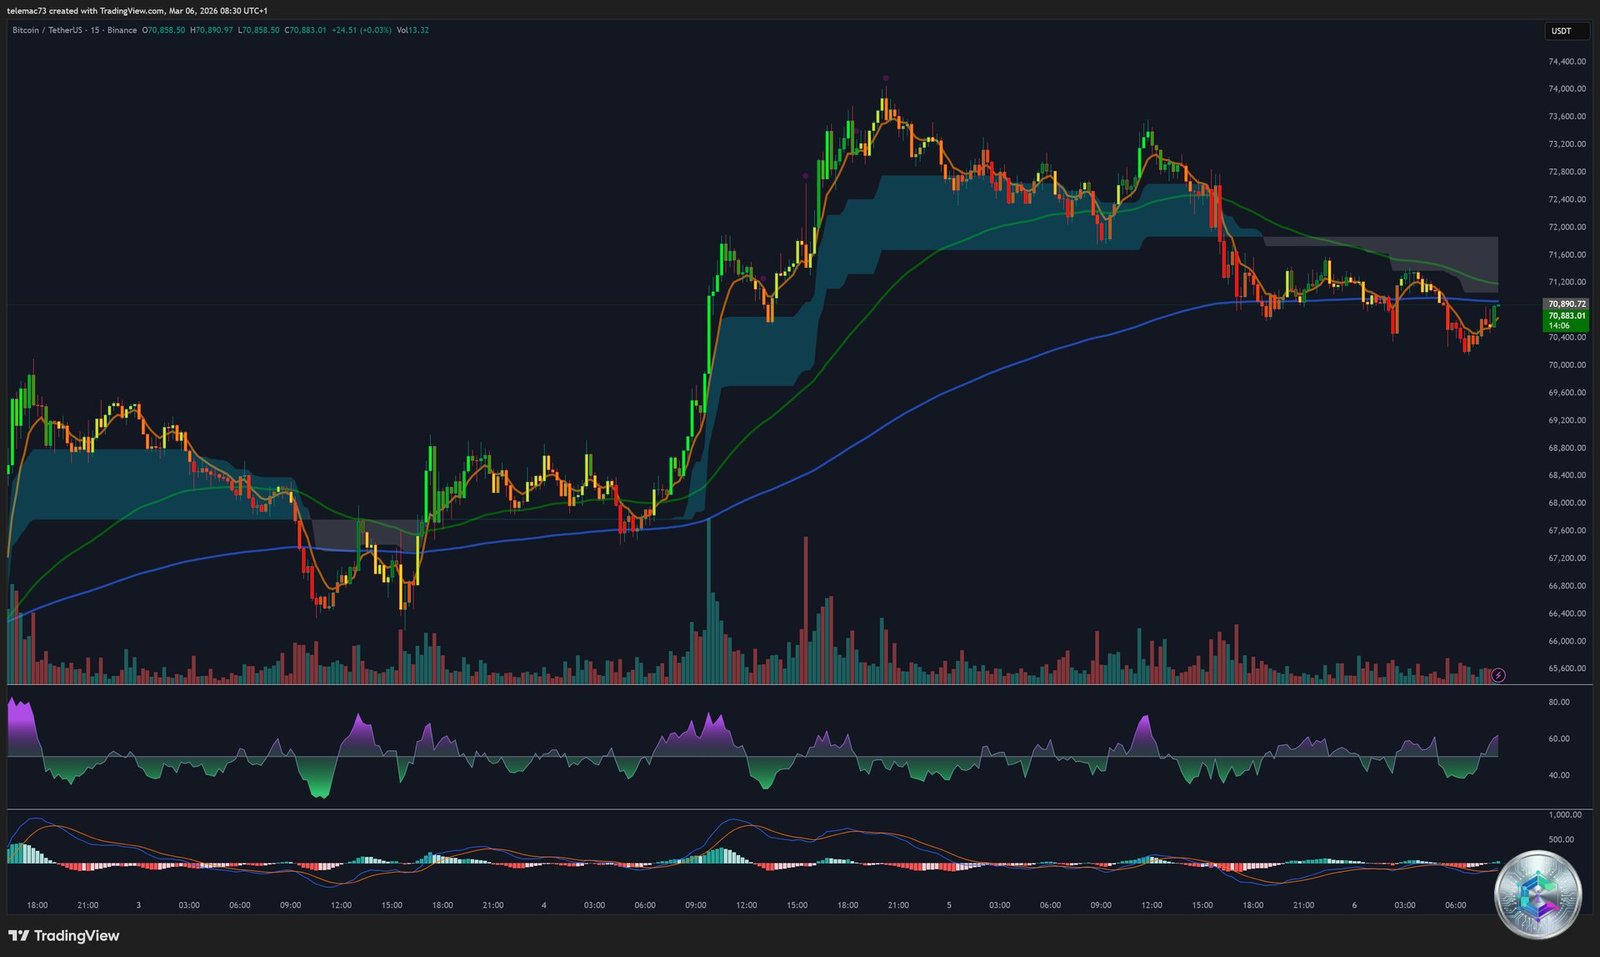
The 15-minute timeframe reveals the predatory behavior of HFT algorithms: long-wick candles evidencing relentless stop-hunts on both sides, with no sustained directional momentum. The CCI at 199.24 (extreme overbought, critical threshold at +100) justifies the current ~1.91% intraday pullback, as algorithms automatically take profits following micro-resistance breakouts.
| Price Level (USD) | Technical Category | Reaction Probability |
|---|---|---|
| $79,000 | Macro Resistance (On-Chain) | 🔴 High — Institutional cost basis wall |
| $73,750 – $74,400 | Major Resistance Corridor | 🔴 Very High — 2-year systemic pivot |
| $72,604 | 200-Day EMA | 🟠 High — Bear/Bull market divider |
| $70,073 | Short-Term Bullish Pivot | 🟡 Moderate — Intraday breakout level |
| $69,490 | Bearish Invalidation Pivot | 🟡 Moderate — Technical sell signal |
| $68,011 | Bollinger Midband | 🟠 High — Dynamic pullback support |
| $63,882 | Lower Bollinger Band | 🔴 High — Extreme elastic rebound zone |
| $60,501 | Extreme Monthly Support | 🔴 Very High — Last-resort institutional absorption |
🔥 4. Liquidity Heatmap: The Magnetic Effect
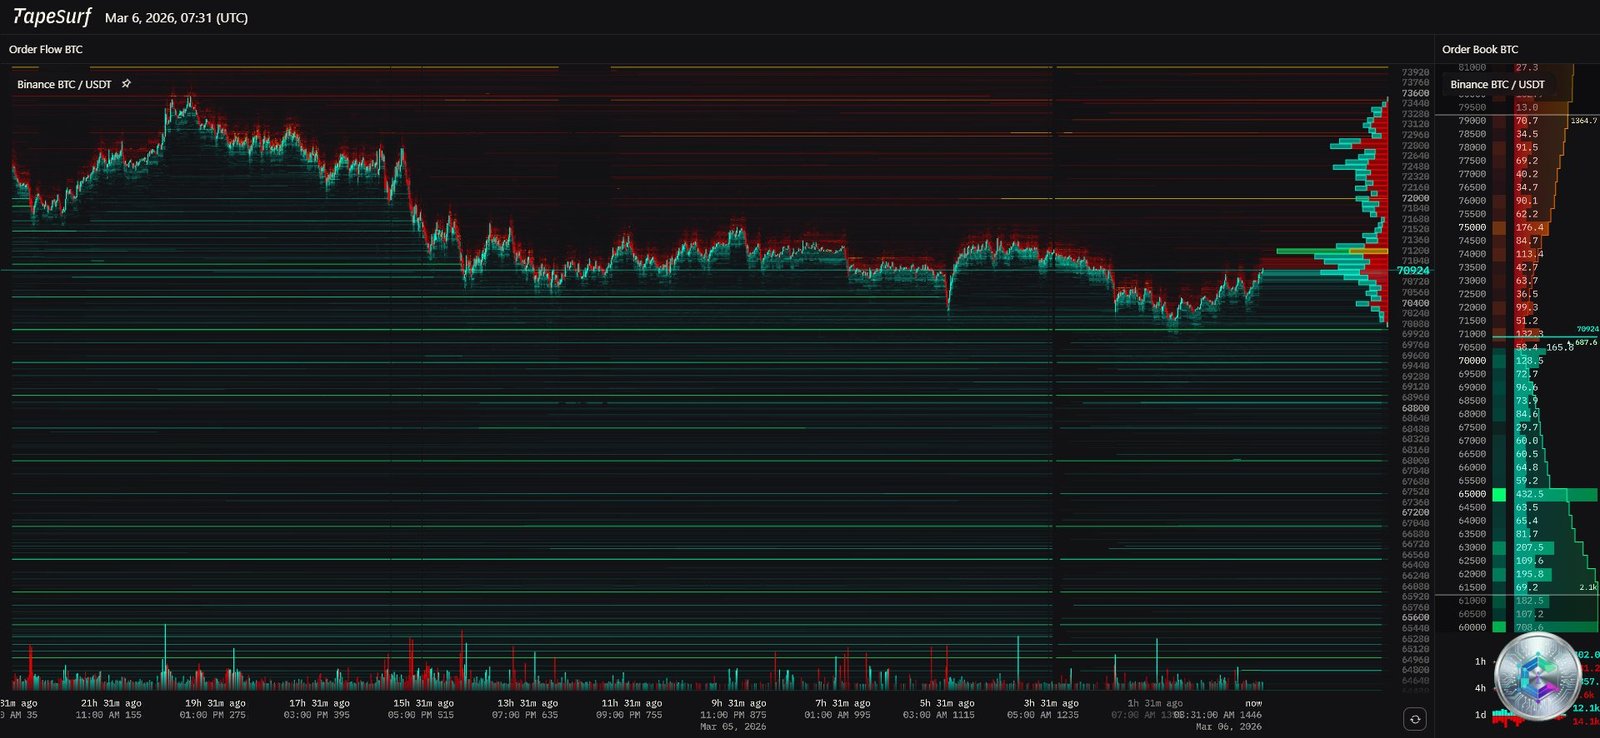
The TapeSurf heatmap reveals an extremely polarized risk topography. Bright red lines above the current price indicate a massive concentration of short liquidations between $73,000 and $75,000. Green lines below signal long liquidations between $65,000 and $68,000.
According to the magnet effect theory, major market makers and predatory HFT algorithms actively hunt these zones to execute massive orders without costly slippage. The algorithms’ primary short-term objective will be to « clean out » one of these two zones — upward (short squeeze toward $74,400+) or downward (long liquidation toward $65,000) — before initiating a sustained trend move.
⚖️ 5. The 2026 Regulatory Revolution: Definitive Institutionalization
5.1 GENIUS and CLARITY Acts: The Supreme Federal Stakes
The entire institutional ecosystem is hanging on the imminent passage of two systemic pieces of legislation: the GENIUS Act (regulatory framework for stablecoins) and the CLARITY Act (complete security/commodity taxonomy for digital assets). On March 4, 2026, Donald Trump published a scathing manifesto accusing traditional banks of deliberately sabotaging these laws through lobbying, warning that legislative inaction would push the « Crypto Agenda » into the hands of China.
5.2 Historic Banking Integration
Institutional developments are accelerating at a breathtaking pace:
- Morgan Stanley has filed for a National Trust Bank Charter with the OCC via « Morgan Stanley Digital Trust, N.A. » to provide direct custody of crypto assets under full federal supervision.
- Kraken Financial has secured a master account from the Kansas City Federal Reserve, becoming the first digital asset bank with direct, frictionless access to Fedwire — reducing fiat-to-crypto friction to near zero.
- The SEC submitted on March 3rd an interpretive guidance proposal to the White House OIRA to definitively clarify the application of federal securities laws to crypto asset categories.
5.3 Pioneering State Initiatives
Indiana signed the « Bitcoin Rights Bill » (HB 1042) on March 3, 2026: legal enshrinement of self-custody rights, prohibition of discriminatory local crypto taxes, and — most revolutionary of all — a legal mandate that all state public pension plans must offer a direct cryptocurrency investment option by July 2027. California opened its DFAL licenses on March 9th, permanently structuring regulatory compliance for Silicon Valley tech firms.
| Regulatory Development | Impact | Catalysis Probability |
|---|---|---|
| GENIUS Act / CLARITY Act | Unified stablecoin framework + taxonomy | 🟢 Extremely High |
| OCC Charter — Morgan Stanley | Direct federal crypto custody | 🟢 Very High |
| Kraken Fedwire Account | Instant atomic settlements | 🟢 High |
| Indiana Bitcoin Rights Bill | Mandatory pension fund crypto exposure | 🟡 Immense long-term |
| FATF Recommendations | Programmable stablecoin censorship | 🟡 Moderate |
🔢 6. Quantitative Modeling and 2026 Price Projections
6.1 JPMorgan’s Thesis: Gold Parity
JPMorgan projects Bitcoin reaching between $170,000 and $266,000 by end of 2026, based on a risk-adjusted volatility parity formula with gold. By adjusting Bitcoin’s implied market cap according to the ratio of gold’s annualized volatility to Bitcoin’s, the bank posits that a risk-normalized 1-for-1 allocation will drive this valuation. The deployment of Kinexys (JPMorgan’s internal crypto infrastructure department) materially backs this ambition.
6.2 Standard Chartered Slashes its Forecast
Standard Chartered has drastically cut its 2026 target from $300,000 to $150,000, citing the saturation of corporate treasury (DAT) buying and modeling zero incremental treasury purchases going forward. Buying pressure now rests almost exclusively on ETF inflows, modeled at 200,000 BTC per quarter. Analyst Geoff Kendrick also declares that Halving cycle analysis is now « obsolete » given the overwhelming power of ETF capital flows.
6.3 Institutional Price Target Summary for 2026
| Institution / Analyst | 2026 Price Target | Valuation Model |
|---|---|---|
| JPMorgan | $170K – $266K | Gold volatility parity + Kinexys |
| Goldman Sachs | ~$200K | Macro inflation + institutional adoption |
| Standard Chartered | ~$150K – $180K | ETF flows 200K BTC/Q, zero DATs |
| Grayscale | ~$150K – $250K | Halving supply shock + ETFs |
| Citigroup | ~$143K | Internal stochastic projection model |
| Henrik Zeberg | ~$110K – $150K | Liquidity expansion cycle |
| Prof. Carol Alexander | ~$75K – $150K | Institutional volatility probability channel |
| Bear Case Black Swan | ~$50K | Break of $60K support + -30% capitulation |
Near-term monthly projections target a potential support test at $60,501 (-14.7% from current levels), while the ultra-bullish quarterly scenario targets $121,963 (+71.9%), contingent on a Fed dovish pivot and GENIUS & CLARITY Act adoption. The modeled « fair value equilibrium » for 2026 lands around $97,867.
🎯 7. Strategic Synthesis: Bitcoin at the Crossroads
Bitcoin’s market structure on March 6, 2026 presents a high-tension directional asymmetry configuration. Four fundamental vectors define the dynamics:
- Persistent macroeconomic headwinds: DXY +8%, LNG inflation shock, imminent NFP — a heavy lid on risk assets in the short term.
- Historically robust on-chain fundamentals: LTH refusing to capitulate, whales accumulating, floating supply contracting — fertile ground for an asymmetric bullish supply shock.
- Irreversible regulatory revolution: GENIUS Act, Morgan Stanley charter, Kraken Fedwire access, Indiana Bitcoin Rights Bill — the permanent institutionalization of Bitcoin is underway.
- Technical structure under maximum compression: The asset is trapped between $63,882 (Bollinger support) and $74,400 (2-year pivot resistance). A confirmed daily close above $74,400 would officially trigger a new secular bull cycle. Failure would condemn price toward the $60,500–$63,500 range.
This tense silence currently reigning over the markets is not the death rattle of a bear market. It is the precarious oxygen void that always precedes a massive tectonic redeployment of institutional capital into this singular asset.
Key levels to monitor closely:
- 🟢 Resistances: $72,604 (EMA 200d) → $73,750–$74,400 (pivot corridor) → $79,000 (ETF cost basis)
- 🔴 Supports: $70,073 (ST pivot) → $69,490 (bearish invalidation) → $68,011 (Bollinger midband) → $63,882 (lower Bollinger) → $60,501 (extreme monthly support)
⚠️ Important Disclaimer: This article is written for purely educational and informational purposes only. It does not constitute investment advice, a recommendation to buy or sell, or a financial solicitation of any kind. Cryptocurrency markets are extremely volatile and carry significant risk of capital loss. Past performance is not indicative of future results. Please consult a licensed financial advisor before making any investment decisions.