
As February 2026 draws to a close, Bitcoin is navigating turbulent waters. Trading in a tight range around $67,228 – $67,315, with daily volatility between 0.88% and 1.31%, this apparent calm masks a far more complex reality: a nearly 50% decline from its All-Time High of $126,000 reached in October 2025. A comprehensive breakdown of a market standing at a crossroads.
Macro-Financial Framework: The Forces Weighing on BTC
The idea of Bitcoin as a fully uncorrelated asset from traditional markets now belongs to the past. The massive integration of institutional capital through ETFs and corporate treasuries has transformed BTC into an asset highly sensitive to global monetary policy shifts.
The Strong Dollar: Bitcoin’s Primary Headwind
US macroeconomic data for Q1 2026 has forced markets to drastically recalibrate their expectations. CPI stands at 2.4% year-over-year with a 0.2% monthly gain — insufficient to justify a Fed pivot. January 2026 Non-Farm Payrolls surprised to the upside with +130,000 jobs created, while the unemployment rate contracted to 4.3%.
The result: the Fed’s « higher for longer » doctrine remains firmly in place. The DXY index is rebounding strongly from its 95-96 support zone toward the 97 level, exerting asymmetric downward pressure on all risk assets — Bitcoin included.
| Indicator | Period | Value | BTC Impact |
|---|---|---|---|
| CPI (Annual) | January 2026 | 2.4% | Neutral to mildly bearish |
| CPI (Monthly) | January 2026 | 0.2% | Neutral |
| NFP | January 2026 | +130,000 | Strongly bearish |
| Unemployment Rate | January 2026 | 4.3% | Strongly bearish |
| DXY | February 2026 | ~97.00 | Strongly bearish |
Geopolitical Tensions and Nasdaq Correlation
The macro-financial environment is further clouded by the threat of new US tariffs targeting Europe and Asia, and escalating US-Iran tensions. These factors are fueling a flight to the dollar and weighing on all risk assets. The Nasdaq — structurally correlated to BTC — is struggling to hold 25,000 points, posting five consecutive rejections from the 26,000 level, a troubling technical signal.
On-Chain Fundamentals: Supply Under Pressure
Miner Capitulation: An Invisible Glass Ceiling
The most persistent bearish driver comes from the primary supply side. In February 2026, the average Bitcoin production cost is estimated at $87,000. With spot price hovering around $67,000, the mining industry is operating at a theoretical deficit of $20,000 per mined coin.
To remain solvent, miners are forced to continuously liquidate their reserves — the so-called « miner surrender » phenomenon. This constant distribution creates an invisible glass ceiling absorbing buying liquidity. This ceiling will only break once the price sustains above $87,000.
ETFs: Short-Term Hemorrhage, Long-Term Infrastructure
Spot Bitcoin ETFs have recorded net outflows of approximately $5 billion over recent weeks, driven by portfolio rebalancing, tax-loss selling, and CTA fund liquidations. The memory of the October 10, 2025 crash — the largest derivative market collapse in crypto history with over $20 billion in positions wiped out — weighs heavily on institutional psychology.
Yet a major announcement counterbalances this pessimism: the CME Group will launch 24/7 crypto futures and options trading on May 29, 2026, responding to explosive institutional demand (notional volume hit $3 trillion in 2025). This infrastructure paves the way for superior institutional inflows in the next cycle.
Microstructural Analysis: The Order Book Heatmap

The Heatmap reveals a « pincer » structure with two massive liquidity walls flanking the current price:
- Lower cluster (~$66,000): Dense concentration of retail stop-losses and institutional bid walls. A break below this level would trigger a cascade of liquidations.
- Upper cluster (~$71,000): The graveyard of short sellers. A move toward this level would theoretically trigger a violent short squeeze.
- Current neutral zone ($66,000 – $69,000): A liquidity vacuum amplifying volatility compression — a directional breakout is imminent.
Multi-Timeframe Technical Analysis
Daily Chart (1D): Structural Bearish Trend
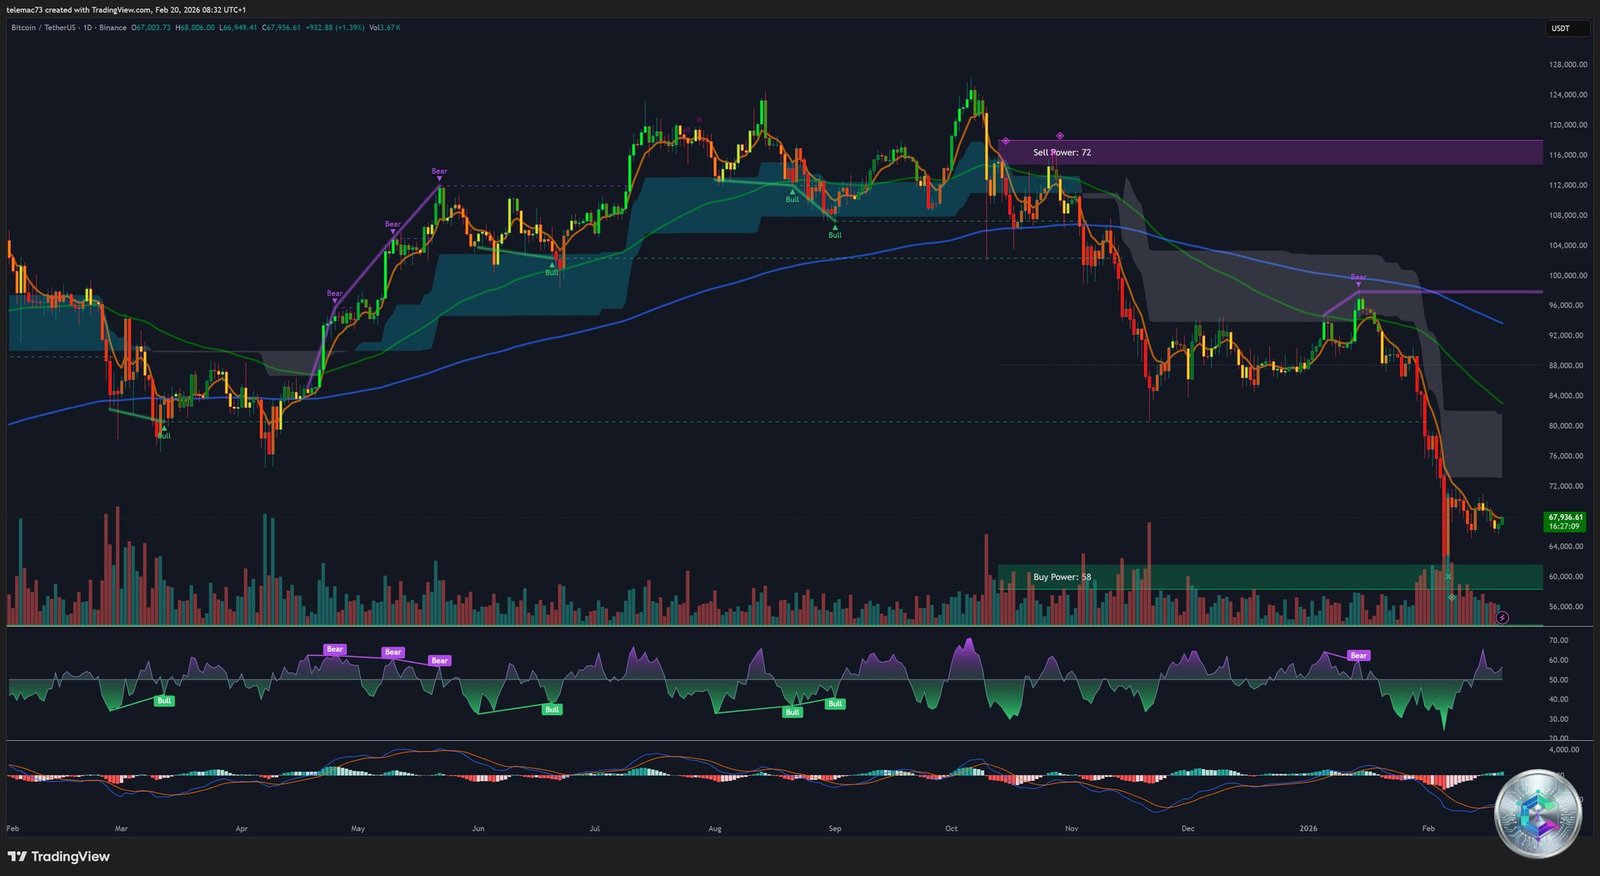
Bitcoin is trading below all of its key EMAs (20, 50, 100, and 200-day), confirming a structurally bearish long-term trend. However, encouraging signals are emerging: BTC has precisely hit the mathematical target of a massive bearish wedge that developed from November 2024, the RSI has visited oversold territory comparable to the 2022 bear market lows, and the MACD histogram shows a nascent contraction — a sign of exhausting bearish momentum.
4-Hour Chart (H4): Hermetic Consolidation
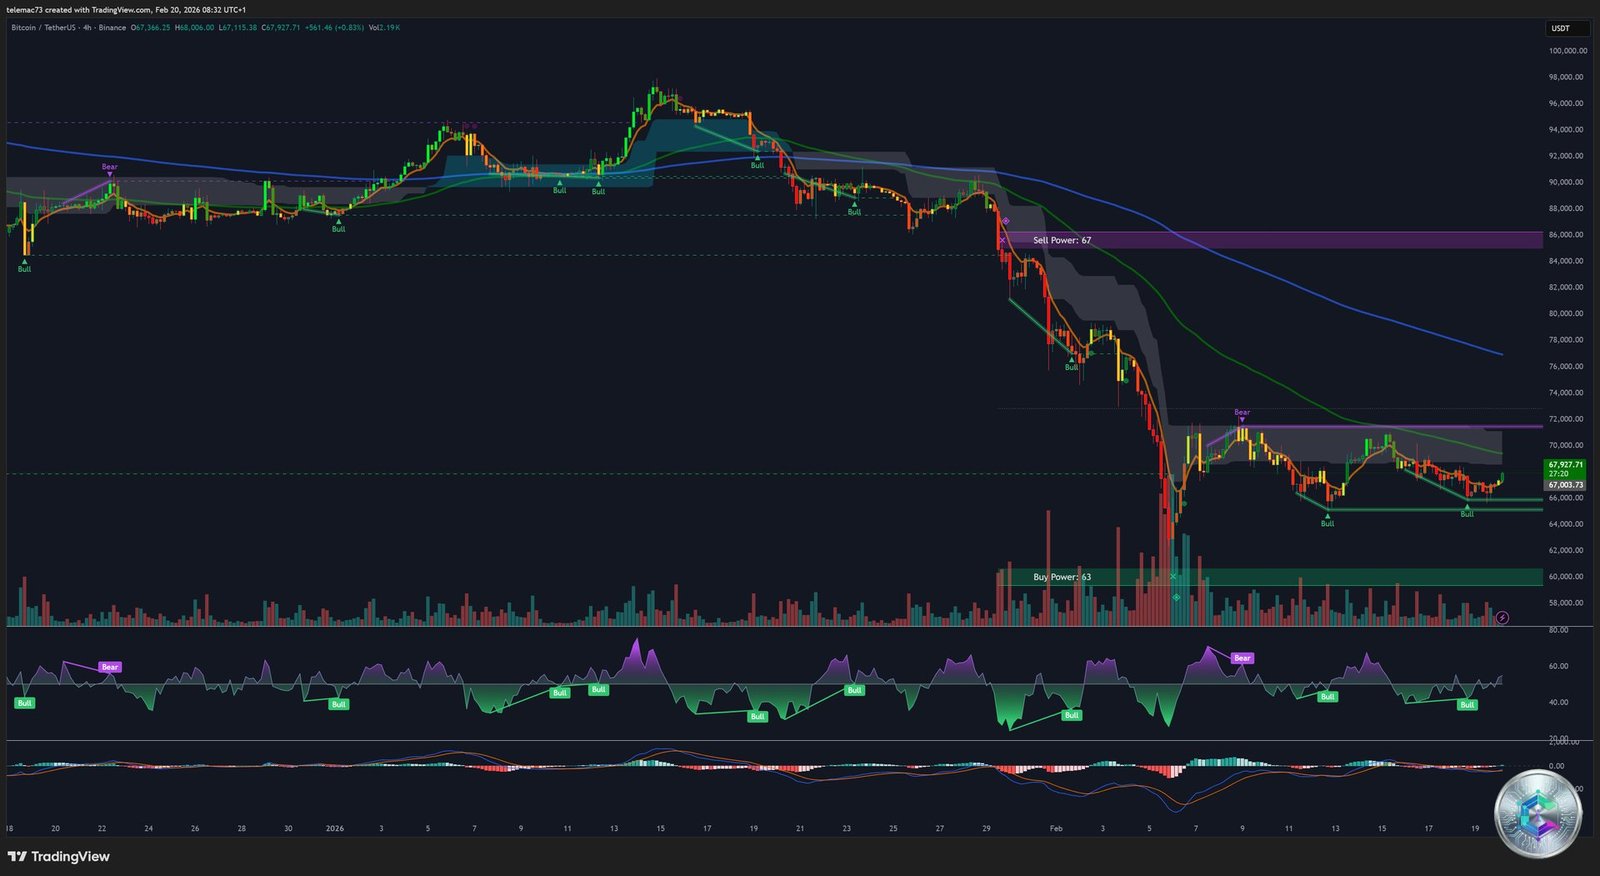
On the H4, Bitcoin is locked within a $65,000 – $70,000 range. The key resistance is the dynamic 20-day EMA near $73,300 — until that level is convincingly broken to the upside on a closing basis, selling pressure will prevail.
15-Minute Chart (M15): A Promising Bullish Divergence

The M15 is tracing a geometrically perfect descending channel within the macro consolidation. The most powerful signal: a classic bullish divergence on the RSI — price prints lower lows while the oscillator forms higher lows. This decoupling, identical to the April-May 2024 patterns that preceded explosive rebounds, suggests an imminent dissipation of short-term selling pressure.
Strategic Price Matrix: Supports, Resistances & Pivots
| Price Level (USD) | Category | Rationale |
|---|---|---|
| $150,000 – $225,000 | 🎯 Long-Term Target | Institutional bull run targets if cycle recovery is confirmed |
| $80,000 | 🔑 Secular Pivot | Monthly close above = bear market invalidation. Failure = continued decline |
| $75,000 | ⬆️ Major Resistance | First step toward full market recovery |
| $72,000 – $73,500 | ⬆️ H4 Resistance / EMA 20D | Dynamic wall — must be cleared to escape lateral consolidation |
| $71,000 | 🧲 Upper Liquidity Magnet | Heatmap cluster — potential short squeeze trigger |
| $67,000 – $69,000 | ➡️ Current Neutral Zone | Liquidity vacuum — directional breakout imminent |
| $65,000 – $66,000 | ⬇️ Minor Support | Consolidation floor, retail psychological barrier |
| $60,000 – $62,000 | 🛡️ Major Structural Support | Confluence with 200-week MA — critical lifeline |
| $48,000 – $50,000 | 🔴 Final Capitulation Zone | Institutional « Deep Value » accumulation — catastrophic scenario |
Behavioral Asymmetry: Retail Panic vs. Whale Accumulation
The Crypto Fear & Greed Index has collapsed to 7/100 — clinical « Extreme Fear. » Google searches for « Bitcoin going to zero » have exploded, reaching the catastrophic levels of 2022. Yet while retail investors panic, on-chain data tells a completely different story:
- Entities holding 1,000–10,000 BTC accumulated a net ~30,000 BTC in January 2026 (~$2 billion)
- February 19, 2026: transfer of 3,107 BTC (~$206M) to Coinbase Institutional (likely OTC block trades)
- February 20, 2026: a Satoshi-era whale dormant for 13.2 years moved 909 BTC — originally acquired below $7 — to new addresses
Probabilistic Scenarios for End of 2026
🟢 Bull Case — Target: $150,000 – $225,000
This scenario requires the simultaneous alignment of three key catalysts: (1) A genuine Fed monetary pivot with rate cuts and DXY weakening. (2) Technical recapture and defense of the $80,000 level on a monthly close. (3) CME 24/7 futures launch in May 2026 generating structural institutional inflows. Standard Chartered maintains its six-figure target for Q4 2026.
🔴 Bear Case — Risk: $48,000 – $50,000
If US employment remains robust and the Fed holds rates, resistance at $70,000–$73,300 will continue to hold. A weekly close below $60,000 would activate cascading sell algorithms, triggering the « final drawdown » toward the institutional « Deep Value » zone of $48,000–$50,000. This scenario would push a new all-time high to 2027 or beyond.
Sector Rotation: Where Is Smart Money Going?
While Bitcoin consolidates, large players are rotating into specific narratives: Solana (SOL) at ~$83-84 (+2%) for its scalability, Monero (XMR) (+2.6%) on the « privacy coin » narrative, Gaming tokens (AXS +200%) via aggressive algorithmic buying, and tokenized gold (XAUT, PAXG) as an inflation hedge.
Conclusion: Not Dead, Not Reborn — In Metamorphosis
Bitcoin in February 2026 is not dying. It is undergoing a necessary and cathartic macro-structural purge. On one side: a hostile monetary environment suffocating credit-fueled expansion. On the other: institutional infrastructure methodically consolidating. The current volatility compression in the $67K-$69K liquidity vacuum cannot last indefinitely — a violent directional breakout is building. The direction of that breakout will hinge on a single arbiter: the Federal Reserve’s next move.
⚠️ Disclaimer: This article is written for educational and informational purposes only. It does not constitute investment advice or a recommendation to buy or sell any asset. Cryptocurrency markets are extremely volatile. Only invest what you can afford to lose and consult a licensed financial advisor before making any investment decisions.