


In mid-July 2026, Bitcoin is trading around $64,693, an impressive technical recovery after a plunge toward $58,000 in late June. Yet the asset remains far below its all-time high of $126,198 set in October 2025. Caught between a still-restrictive macro backdrop and a market that has repeatedly proven its ability to absorb enormous supply shocks, Bitcoin now finds itself pinned beneath a major resistance zone. Here is our full read on the situation, from the macro fundamentals down to order-book microstructure.
The macro overhang: sticky US inflation complicates the picture
The main brake on a stronger rebound remains monetary. The PCE index, the Federal Reserve’s preferred inflation gauge, unexpectedly accelerated to 4.1% in June 2026, dashing hopes of a swift policy pivot. The Fed kept its benchmark rate in a restrictive 3.50%-3.75% range at its June meeting, with the next FOMC decision due July 29.
Elevated real rates mechanically weigh on non-yielding assets like Bitcoin, and this dynamic directly drove the wave of liquidations seen in late June, which dragged price down to a 21-month low around $58,076.
A market that has already absorbed far worse
To put current pressure into perspective, it’s worth recalling the resilience the market showed against far more violent supply shocks. In 2024, the German government liquidated nearly 50,000 BTC seized in a piracy case, generating roughly $2.89 billion in proceeds by spreading transfers across multiple exchanges and market makers to limit price impact. Around the same time, the distribution of billions of dollars to Mt. Gox creditors reignited fears of a wave of forced selling.
The market ultimately absorbed both shocks, and the average German liquidation price at the time (around $57,900) remained etched in as a strong psychological support zone—one that isn’t far from the low touched in late June 2026. That market memory matters: it partly explains why buyers returned this year to fiercely defend a comparable price zone.
Spot ETFs, the new barometer of institutional demand
Spot Bitcoin ETFs have become one of the best gauges of traditional finance’s appetite for the asset. Over the first half of 2026, these vehicles recorded cumulative net outflows of roughly $5.4 billion, with May and June marking their worst consecutive months on record—a direct consequence of rising PCE inflation and the resulting risk-management rebalancing by portfolio managers.
The most interesting signal came in early July: in just three trading sessions, ETFs captured about $510 million in net inflows, pulling the month back into positive territory. That quick reversal suggests capital is treating the current discount to the ATH as an attractive entry point rather than the start of a prolonged bear market. In practice, this means Bitcoin’s price action is increasingly synced with Wall Street trading hours and issuers’ ability to sustain positive flows.
What the order-book heatmap reveals
The combined liquidity heatmap as of July 19, 2026 offers a valuable read on market makers’ intentions. With spot price around $64,695, the most striking feature is a massive sell wall starting at $64,800 and thickening up to $65,000 and beyond—a buildup of resting orders that acts as a mechanical ceiling, difficult to break without sustained buying pressure.

On the bid side, liquidity is more fragmented below $63,000 but becomes notably denser in the $57,000-$58,000 zone—a floor that lines up with both June’s macro capitulation point and the historical average German liquidation price mentioned above. Should the $65,000 wall give way under sustained buying, a short-squeeze scenario could push price toward the next liquidity pocket around $67,000-$68,000.
The big picture: the daily chart confirms a momentum shift
On the daily timeframe, price structure carved a low marked by a long capitulation wick near $57,000, before staging a sharp bullish reversal up to current levels. Two institutional blocks now frame the market: a « Buy Power » support between $56,000 and $58,000, which held perfectly during June’s crash, and a « Sell Power » resistance between $65,000 and $67,000, right where price currently sits.
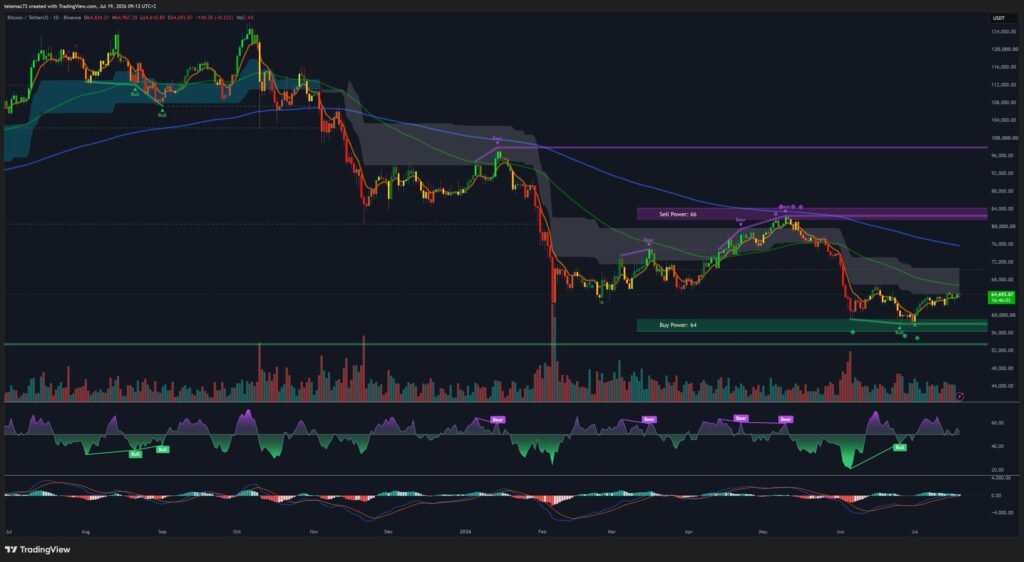
The 14-period RSI, after plunging into extreme oversold territory during the drop to $57,000, has crossed above its neutral midline into bullish territory, with no visible bearish divergence so far. The daily MACD tells a similar story: it confirmed a bullish crossover (Golden Cross) while both lines were still in negative territory—a signal generally regarded as robust by trend-following funds. A clean daily close above $65,500 would definitively invalidate the bearish structure inherited from prior months and open the door toward $70,000.
The 4-hour bull flag: compression before the decision
On the 4-hour timeframe, the bounce from the « Buy Power » zone ($58,000-$59,000) took the shape of a near-vertical impulse, followed by a consolidation forming a bull flag combined with a compression triangle beneath the « Sell Power » resistance ($64,800-$65,000). This phase reflects methodical absorption of supply by buyers, without meaningful loss of ground.
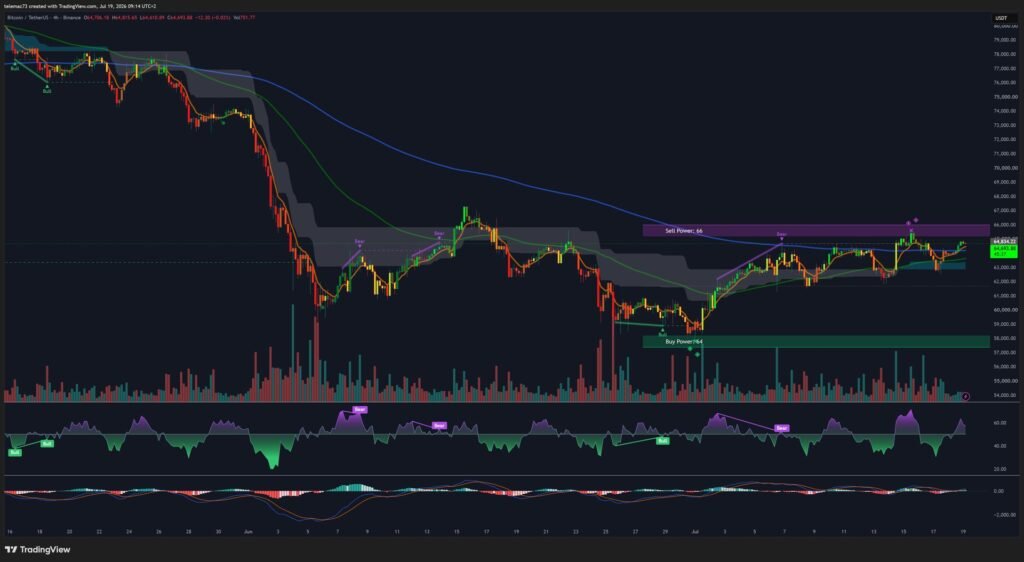
A volume-confirmed breakout above $65,000 would, based on the classic flagpole measured move, project a target beyond $70,000. Some caution is warranted, though: the H4 RSI is flirting with overbought territory and a few micro bearish divergences are appearing on the latest peaks, while the MACD histogram is starting to flatten. None of this invalidates the underlying trend, but a temporary pullback toward the $63,000 pivot remains a plausible scenario before another push at resistance.
15-minute noise: the algorithmic tug-of-war
On the intraday timeframe, the broader trend fades in favor of a genuine liquidity hunt. Price oscillates in a tight channel around the $64,693 pivot, with long wicks betraying whipsaw moves designed to trigger stop-losses from heavily leveraged traders.
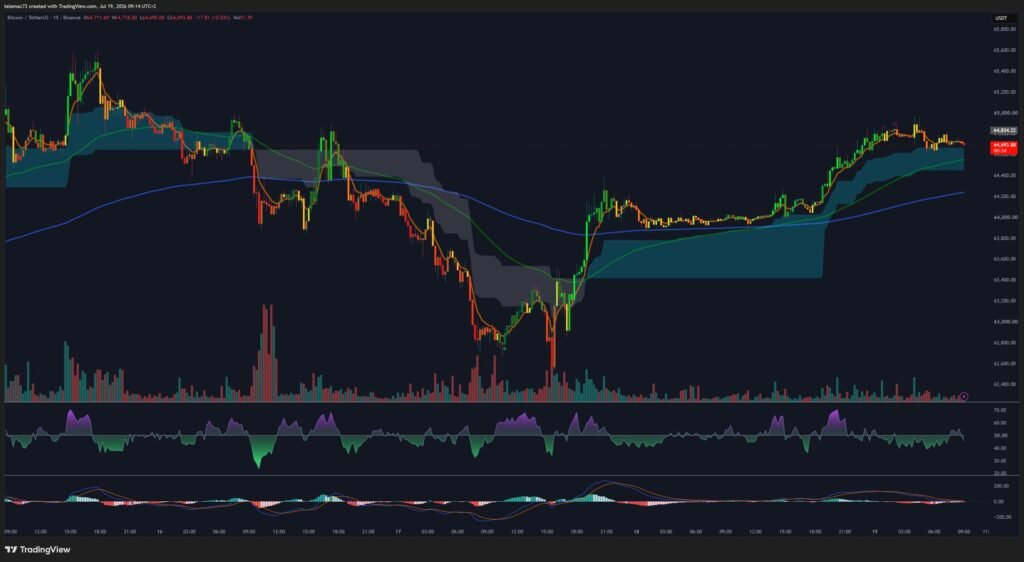
RSI oscillates nervously between 40 and 60 without settling into a clear trend, while MACD churns through golden crosses and death crosses with no follow-through. This mean-reversion regime invalidates any trend-following strategy on this timeframe: the market is clearly waiting for an external catalyst, whether macroeconomic or ETF-flow related, to break the current equilibrium.
Key levels to watch
| Level (USD) | Type | Why it matters |
|---|---|---|
| $72,000 | Macro resistance | Post-ATH distribution ceiling, target for a full retracement |
| $65,000 | Critical resistance | Massive sell wall on the heatmap, upper bound of the H4 triangle, potential short-squeeze trigger |
| $64,693 | Current price | H4 / M15 pivot point, algorithmic compression zone |
| $63,000 | Intermediate support | Base of the H4 flag, invalidation point for the short-term bullish structure |
| $57,000-$58,000 | Historical support | June 2026 capitulation floor and « Buy Power » zone |
Two scenarios to track
Bull case: continued net ETF inflows could absorb latent supply and break the $65,000-$66,000 zone, potentially triggering a cascade of short covering toward $70,000.
Bear case: exhausted demand against the $65,000 wall, combined with deteriorating H4 indicators, would invalidate the continuation structure if the $63,000 trendline gives way, with a possible return toward the vital $57,000-$58,000 support given the lack of intermediate buy-side liquidity.
Disclaimer: this article is provided for purely educational and informational purposes. It does not constitute investment advice, a recommendation to buy or sell, or a solicitation to act on financial markets. Cryptocurrencies are volatile, high-risk assets; conduct your own research and consult a qualified financial advisor before making any investment decision.

