
Bitcoin opens the second half of 2026 with a dramatic twist. After a 51% collapse from its October 2025 all-time high of $126,080, and a 21-month low of $57,800 in late June, the asset surged over 6% in 48 hours to reclaim the $62,000 level. But behind this spectacular rebound lies a market mechanism far more fragile than it appears, and a balance of power between retail traders and institutions that remains deeply skewed.
A brutal reversal triggered by a US labor market shock
The catalyst is macroeconomic. On July 2, 2026, the Bureau of Labor Statistics’ June employment report revealed the creation of just 57,000 nonfarm payrolls, barely half the consensus estimate of 113,000 to 115,000. April and May figures were also revised down by a combined 74,000 jobs, while labor force participation slipped to 61.5%.
This slowdown signal immediately revived expectations of Federal Reserve rate cuts, with Fed Chair Kevin Warsh noting that inflation risks had eased. Bitcoin, acting as a barometer for global liquidity, jumped on the news — while the Nasdaq-100 fell nearly 11% over two days on concerns about AI-related capital spending. A telling decoupling between the two asset classes.
Under the hood: a short squeeze, not real demand
The climb from $58,000 to over $62,000 is a textbook liquidation cascade. Trapped in short positions after the Fear & Greed Index fell to 19/100, short sellers were forced to buy back their positions en masse as soon as price broke through local resistance. The result: roughly $450 million in short positions liquidated across the crypto market within 24 hours, of which more than $148 million on Bitcoin alone, concentrated mainly on Binance, HTX and Bybit.
This mechanical, price-agnostic buying pressure explains the vertical nature of the move — but it is by no means proof of organic demand.
The institutional paradox: ETFs bleeding, whales on the move
This is where the picture darkens. June 2026 was the worst month in the history of US spot Bitcoin ETFs, with $4.5 billion in net outflows — a near-uninterrupted exodus, punctuated by single days above $9 billion in withdrawals, led notably by BlackRock’s IBIT. Even during the July 2-3 rally, ETFs kept bleeding: $294 million in net outflows on Wednesday alone, of which $219 million came from IBIT.
In short: the price rally happened with zero participation from regulated institutional capital. Citi has even revised its 12-month ETF inflow forecast down to zero. The lone bright spot: corporate treasuries, led by Metaplanet (+2,823 BTC, bringing its reserves to 43,000 BTC), continued accumulating close to 9,000 BTC during June’s downturn.
On-chain, the signal is equally worrying: inflows to exchanges exceeded 50,000 BTC per day in early July, with average deposit size doubling — a behavior typical of large entities (« whales ») preparing to distribute, historically a leading indicator of incoming selling pressure.
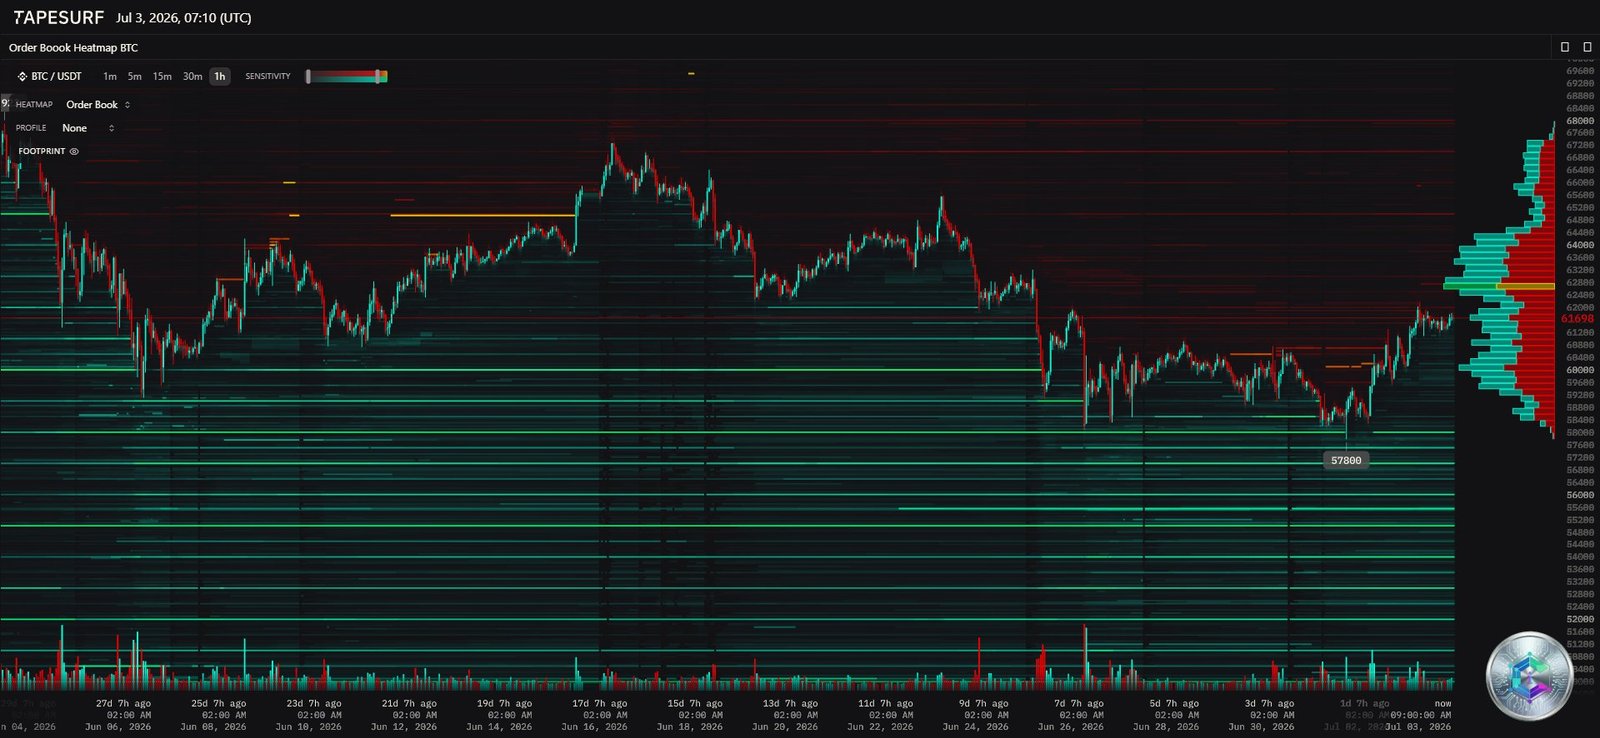
The liquidation heatmap: trapped between two leverage walls
The liquidation heatmap confirms this extreme compression. Two zones dominate:
- $62,000 – $63,000: a dense wall of short positions awaiting liquidation. A sustained breakout would trigger a fresh short squeeze and invalidate the dominant bearish structure.
- $59,700 – $58,000: a concentration of leveraged long positions. Below this threshold, an « air pocket » opens down to $58,000, with a risk of cascading toward the mid-$50,000s.
Multi-timeframe technical reading
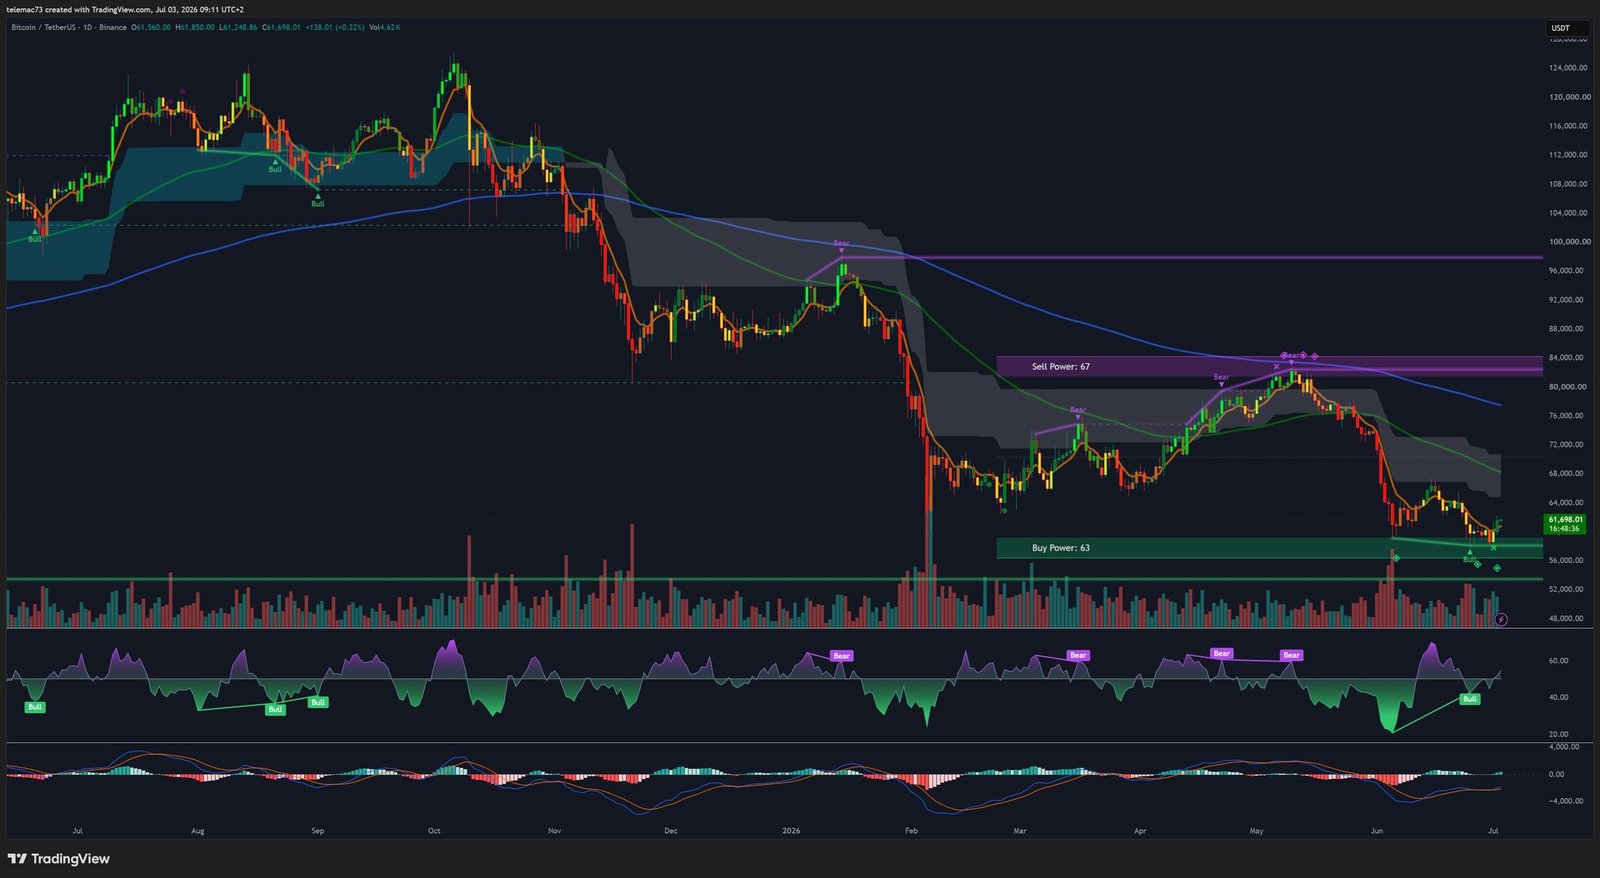
Daily view: the underlying trend remains bearish
Price remains trapped below the 200-day EMA ($77,512) and the 50-day EMA ($66,200–$66,698), with an active « Death Cross » still in play. The 20-day EMA ($62,148) acts as immediate dynamic resistance: buyers broke above this level intraday but have yet to print a decisive daily close above it. The RSI (43.76) has crossed back above its signal line but remains below the neutral 50 threshold. The Parabolic SAR, at $62,523, is the mathematical trigger for a trend flip if price closes above it.
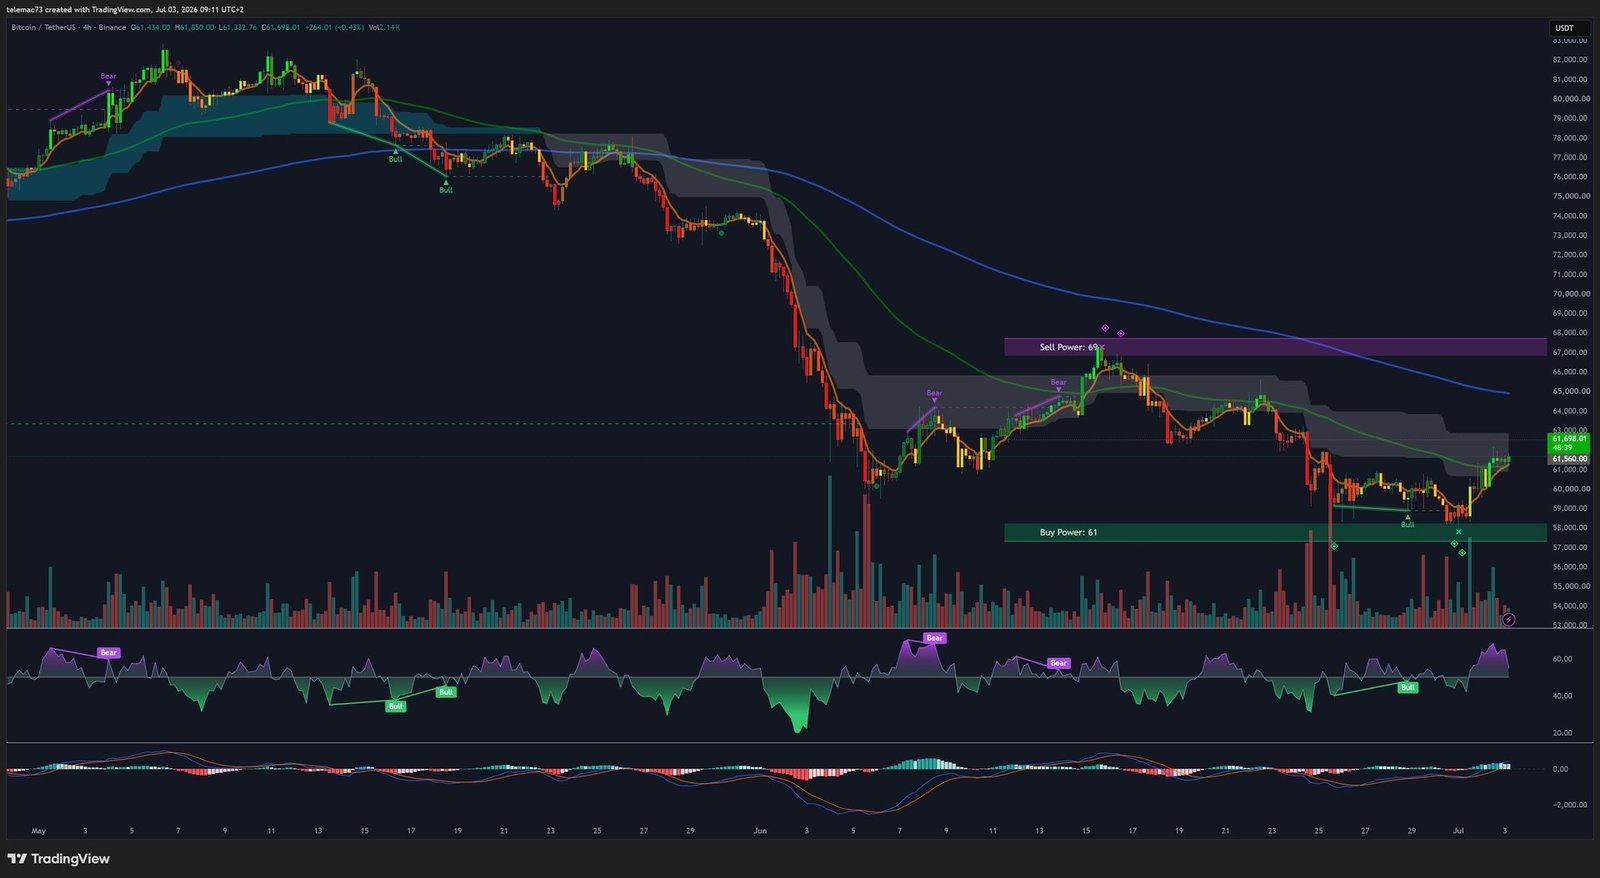
4-hour view: triangle broken, flag forming
A descending compression triangle, broken to the downside on June 24, triggered the capitulation toward $58,189. Since then, the vertical flagpole of the short squeeze has formed a flag whose resolution remains undecided: a bullish breakout would confirm a local bottom, while a bearish breakdown would retroactively classify the entire rally as a « bear flag » ahead of a resumption of the underlying downtrend. A higher high above $62,500 is required to confirm a medium-term reversal.
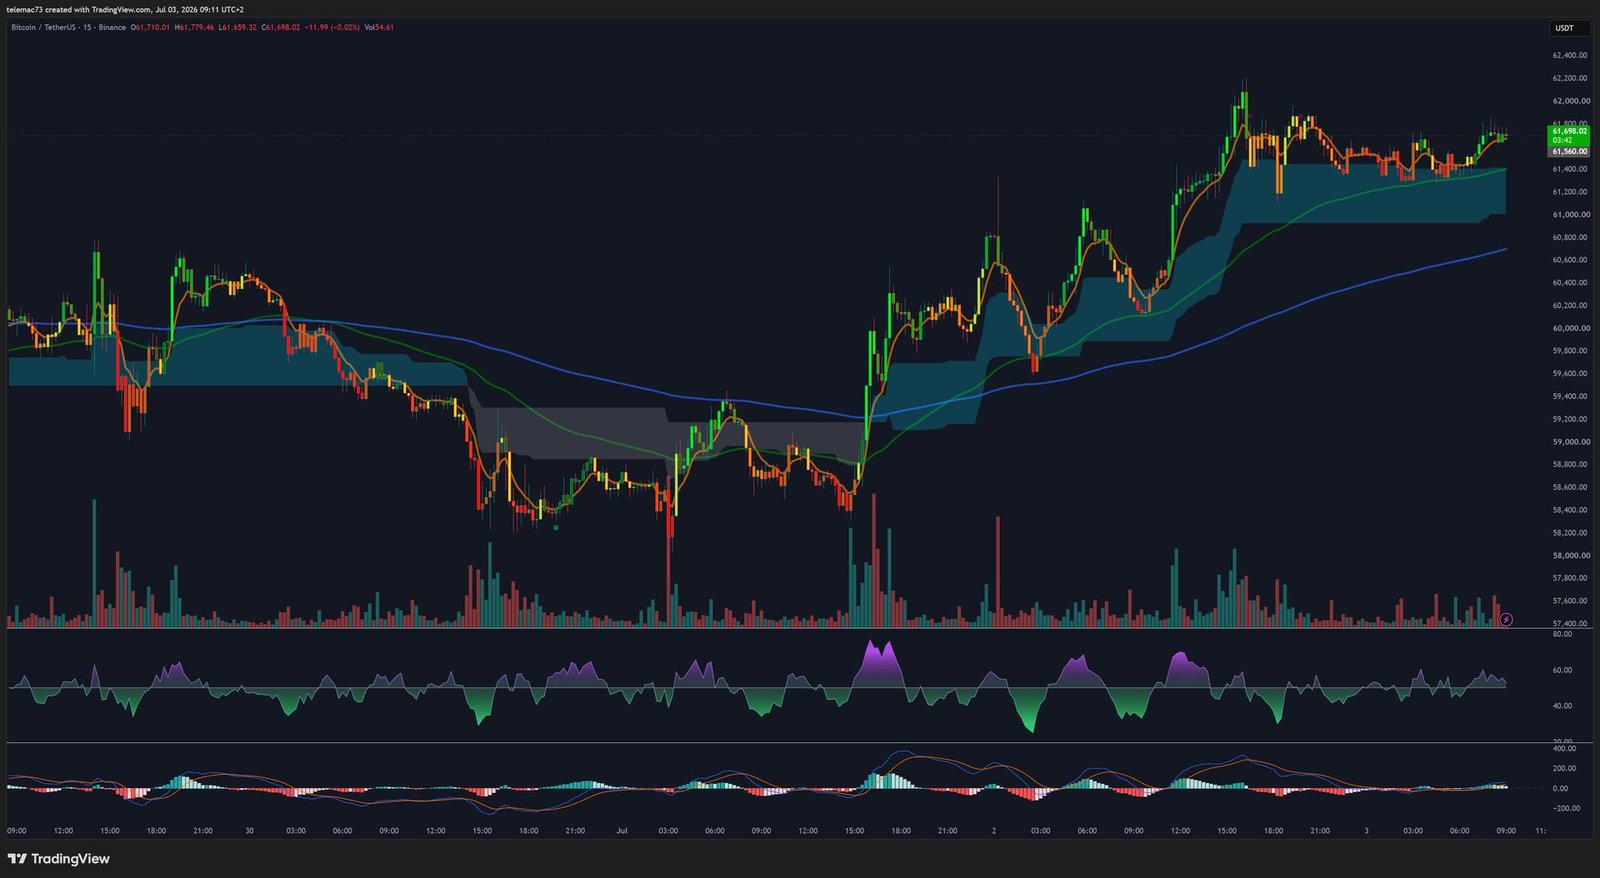
15-minute view: intraday microstructure
The rally advanced in a stair-step pattern, with an order block forming around $60,371 followed by a second push toward $61,300. This latter level is now the intraday pivot to watch: above it, short-term bullish control is preserved; below it, the market is exposed once again to the $60,000 psychological threshold.
Key levels to watch
| Resistance | Significance |
|---|---|
| $62,148 | 20-day EMA — immediate dynamic resistance |
| $62,523 | Parabolic SAR — trend flip if closed above |
| $63,000 | Top of the short liquidation wall (heatmap) |
| $63,800 | Invalidation of the macro downtrend |
| $66,200 – $66,698 | 50-day EMA — primary bullish target |
| Support | Significance |
|---|---|
| $61,300 | Intraday pivot |
| $60,000 | Binary structural support — the market’s most critical level |
| $59,700 | Top of the long liquidation wall (heatmap) |
| $58,104 – $58,189 | June 2026 capitulation low |
| $53,000 | On-chain Realized Price — absolute valuation floor |
Two scenarios for Q3 2026
Bullish scenario: a successful defense of $60,000, followed by a daily close above the Parabolic SAR and the 20-day EMA ($62,523), would open the path toward the 50-day EMA at $66,200. The essential condition for this scenario to hold: a clean reversal in ETF flows, shifting from heavy outflows to positive subscriptions, proving a genuine return of institutional capital.
Bearish scenario: without institutional participation, the current bounce would remain a simple « bear flag. » A break through the $59,700 wall would reignite the liquidation cascade, with a likely retest of the June low at $58,189, or even a final capitulation toward the on-chain Realized Price at $53,000.
The market therefore remains in a high-tension binary equilibrium, whose resolution — in either direction — will determine the macroeconomic trend for the coming months.
⚠️ Disclaimer: This article is provided for educational and informational purposes only. It does not constitute investment advice, a recommendation to buy or sell, or a financial solicitation of any kind. Cryptocurrency markets are highly volatile and carry a significant risk of capital loss. Do your own research and consult a qualified financial advisor before making any investment decision.