
On July 5, 2026, Bitcoin is staging one of its most dramatic reversals of the year: after touching a 21-month low below $58,000, the asset has clawed back to the $62,700 zone within just a few sessions. Between an unexpected macro shock, a massive derivatives short squeeze, and shifting institutional positioning, this analysis breaks down the forces driving the move and the key technical levels that will decide what comes next.
The US jobs shock reshuffles the Fed’s calculus
The catalyst behind this rebound traces back to the July 2 US Nonfarm Payrolls (NFP) report. With only 57,000 jobs added — well below the 110,000-129,000 consensus range — and a downward revision to May’s figures, markets immediately repriced expectations for Federal Reserve policy.
Before the release, investors had priced in roughly a 65% probability of another rate hike at the September FOMC meeting. That probability fell to around 50% in the aftermath, as markets concluded the Fed has less room to tighten against a weakening labor market. The repricing triggered a drop in two-year Treasury yields and a softer dollar index (DXY), with which Bitcoin has shown an inverse correlation of roughly -0.85 over the past twelve months.
Comments from Fed Chair Kevin Warsh, who noted that inflation expectations had eased considerably while promising a lively internal debate at the July meeting, reinforced the move. On the geopolitical front, reported progress in indirect US-Iran talks also reduced the risk premium weighing on risk assets, while an early rotation of capital out of AI-related tech stocks redirected some marginal liquidity toward crypto.
Bitcoin ETFs: from June’s purge to renewed inflows
June 2026 will be remembered for a violent bout of institutional deleveraging: US spot Bitcoin ETFs posted a record $4.5 billion in net outflows, with BlackRock’s IBIT hit particularly hard. This set off a familiar feedback loop — redemptions forced issuers to sell physical Bitcoin on the spot market, fueling the decline down to the $57,800 floor, a level where the on-chain realized profit/loss ratio hit its lowest point since the 2022 bear market.
Institutional readings of this low diverged sharply. Citigroup slashed its 12-month price target from $112,000 to $82,000, citing a durable slowdown in ETF demand and not ruling out a slide toward $53,000 in a recession scenario. Japan’s Metaplanet, by contrast, kept accumulating aggressively, growing its treasury to 43,000 BTC at an average price near $79,700 — largely debt-funded — a leveraged, asymmetric bet on Bitcoin’s long-term appreciation.
On July 2, the trend abruptly reversed: US spot Bitcoin ETFs recorded $221.7 million in net inflows, snapping a ten-day streak of outflows, driven largely by Fidelity’s FBTC fund. This return of capital, synchronized with the NFP release, supplied the spot liquidity needed to push prices through immediate resistance levels.
Regulatory backdrop: legislative gridlock meets tokenization
On the legislative front, the CLARITY Act — intended to clarify the legal status of digital assets in the US — remains stalled in the Senate, with prediction markets pricing only a 48% chance of passage before year-end. That uncertainty continues to hold back long-term institutional capital deployment, even as favorable political rhetoric ahead of November’s midterms keeps a speculative bullish undercurrent alive.
Separately, the International Monetary Fund warned in early July about systemic risks tied to the tokenization of real-world assets: by removing traditional intermediaries and settlement delays, this shift transfers risk away from regulated banks toward decentralized infrastructure where cascading liquidations can propagate instantly. SpaceX’s stock market debut and its addition to the Nasdaq-100 — trading simultaneously as a conventional share and as a token on the Solana blockchain — is a concrete illustration of this convergence between traditional finance and crypto infrastructure.
Order book read: anatomy of a short squeeze
The liquidation heatmap sheds useful light on the mechanics of this rebound. Once overleveraged long positions were flushed out below $60,000, the market repositioned heavily to the downside, with traders betting on a break below $55,000. That buildup of short positions created a dense wall of liquidity above the market, notably around $67,292, with a cluster estimated at $247 million sitting near $67,645 — part of a broader pool of short liquidations exceeding $2.26 billion.
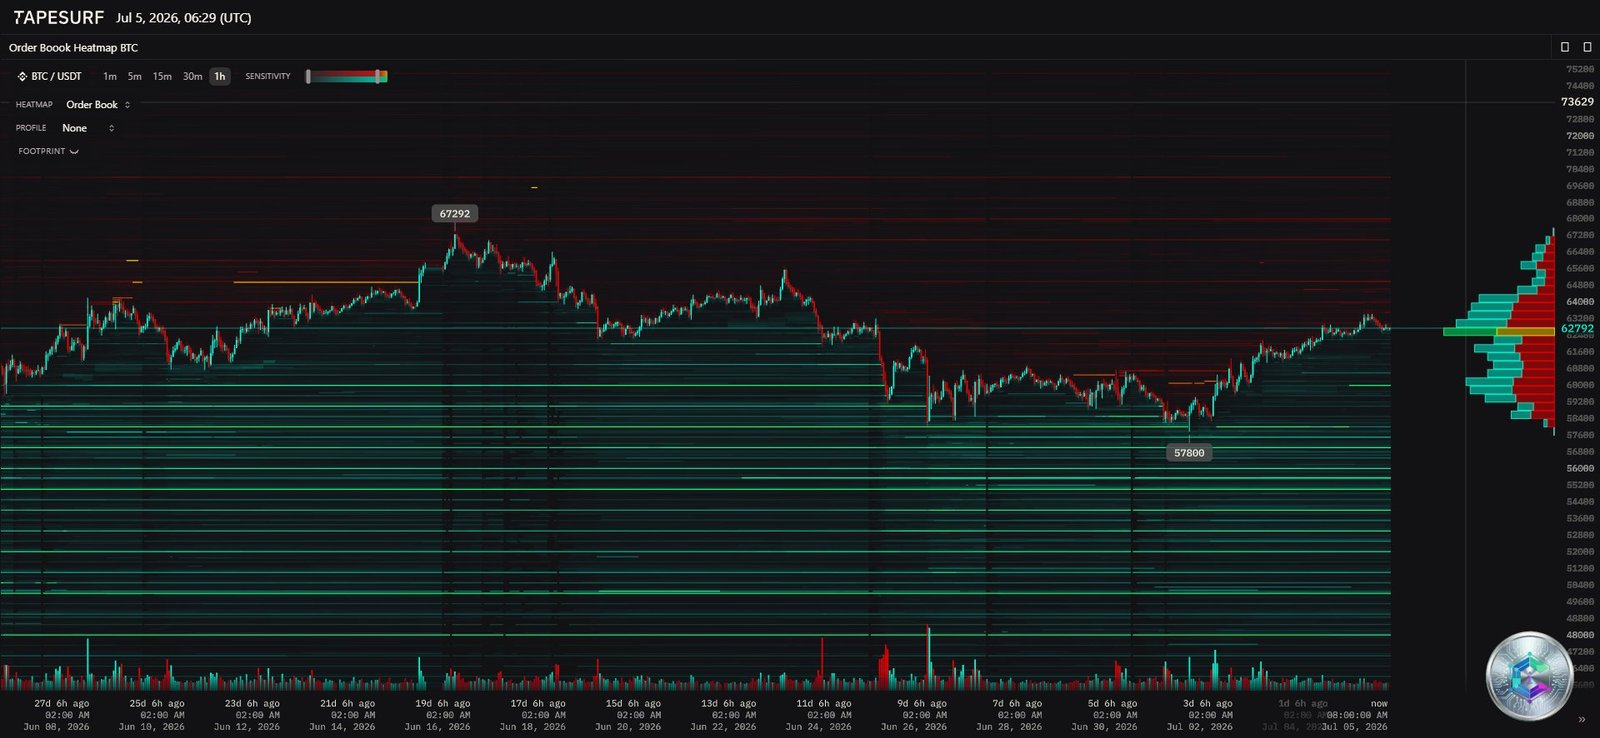
The NFP surprise acted as the spark: initial spot buying triggered sellers’ stop-losses, setting off a textbook short squeeze in which each forced liquidation fuels the next round of buying. Roughly $500 million in short positions were wiped out in the 24 hours surrounding the move. If the market can decisively clear resistance at $64,000, the gravitational pull of the $67,600 cluster could become the next natural target.
Multi-timeframe chart analysis
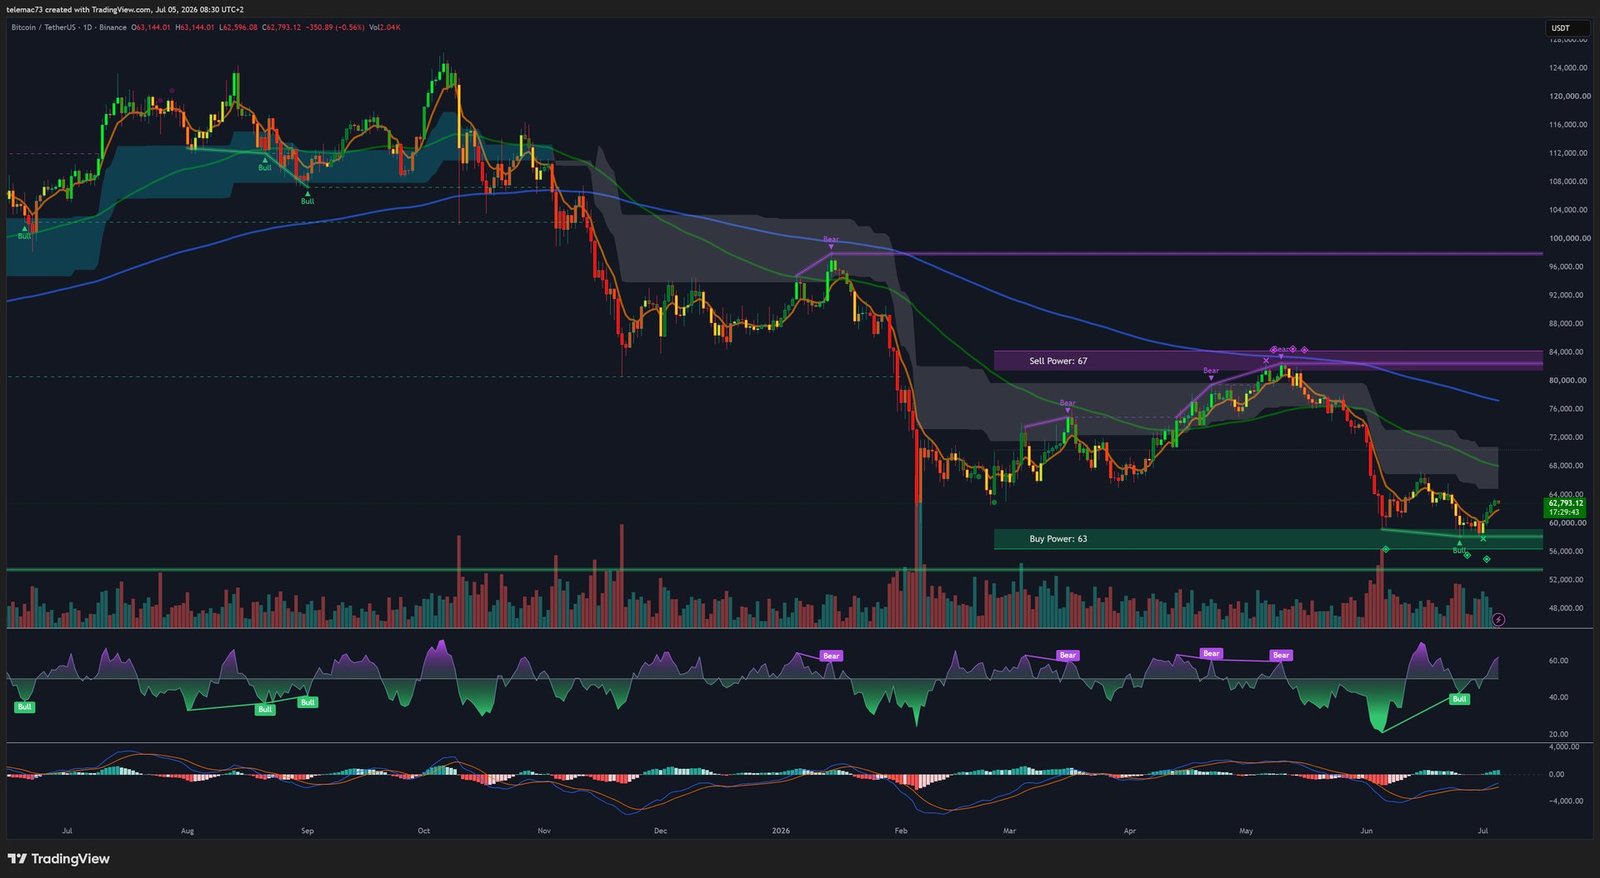
Daily overview: the macro structure still needs confirmation
On the daily chart, the most critical development concerns the 200-day moving average, which roughly coincides with the 200-week moving average near $62,444 — the traditional dividing line between an institutional bull and bear market. Price recently closed below this level for the first time in nearly a year; reclaiming it decisively is the prerequisite for reopening the path toward new highs.
The daily RSI plunged into extreme oversold territory during the $57,750 low, before forming a hidden bullish divergence — successively lower price lows accompanied by successively higher RSI lows, a classic sign of seller exhaustion. The daily MACD, whose negative histogram bars are steadily shrinking, could form a confirming Golden Cross if momentum extends beyond $63,000.
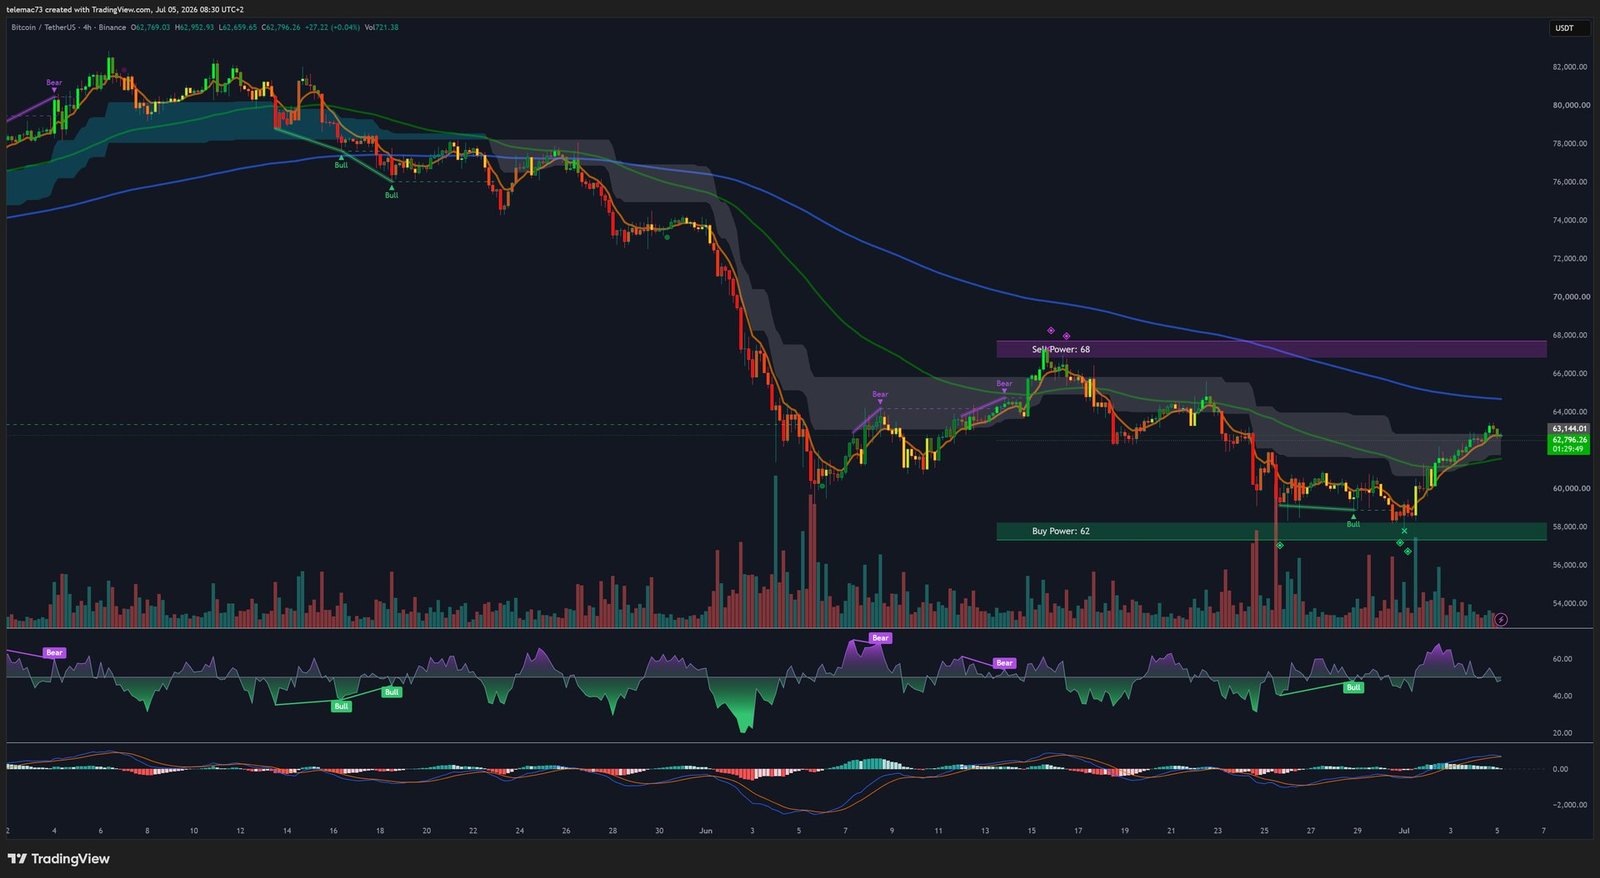
4-hour structure: Double Bottom and bull flag
The 4-hour chart reveals the mechanics of the reversal: a clean Double Bottom on the $57,750-$58,000 support, whose neckline near $61,000 was broken during the post-NFP rally. After a nearly 7.3% vertical advance, price is now consolidating in a bull flag between $61,000 and $62,000 — a classic continuation pattern. The 20- and 50-period exponential moving averages have both been reclaimed, with a Golden Cross now offering dynamic support just below $61,000.
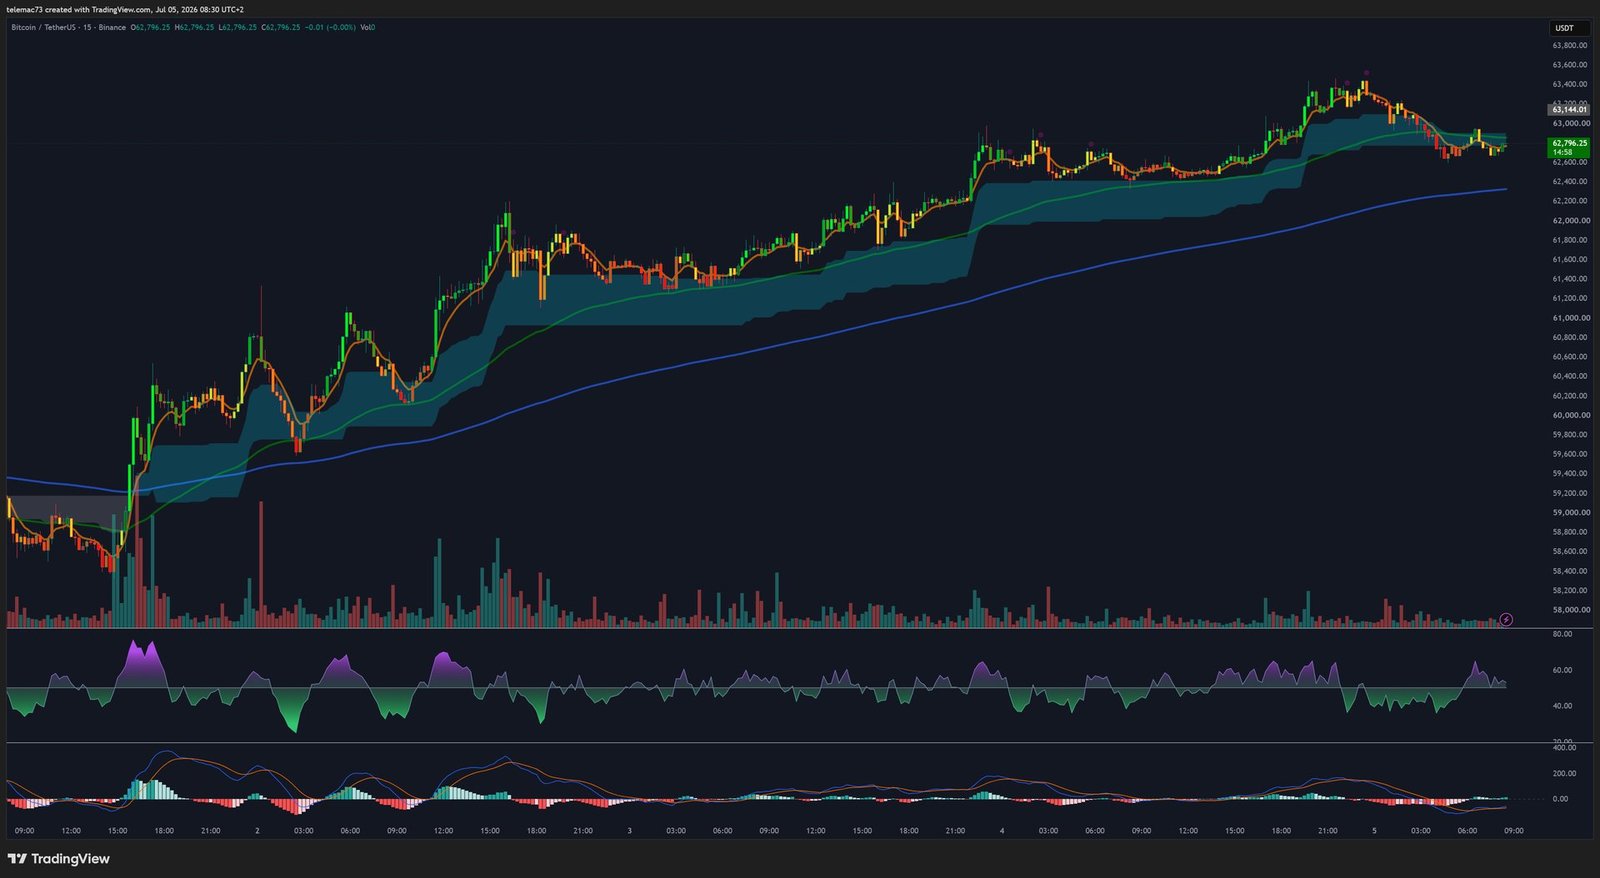
15-minute microstructure: compression before the next move
On the intraday chart, the candle corresponding to the NFP release shows an extreme range expansion and a climactic volume spike — the visual fingerprint of the short squeeze. Price then entered a symmetrical compression triangle around the $61,900 pivot. The 15-minute RSI, which spiked above 85 during the initial move, has normalized back toward the 50 line, while the intraday MACD is churning through repeated crossovers near zero — a tight battle for short-term momentum control.
Key price level matrix
| Zone | Level (USD) | Significance |
|---|---|---|
| Secular macro resistance | $75,203 | 200-day MA — prerequisite for a new ATH |
| Maximum magnetic resistance | $67,253 – $67,645 | Heatmap epicenter, $2.26B short cluster |
| Key chart resistance | $63,800 – $64,000 | Downtrend line from the ATH |
| Psychological pivot | $62,444 | 200-week MA |
| Compression zone | $61,000 – $62,150 | M15 triangle / H4 bull flag |
| EMA continuity support | $60,400 – $60,700 | Recently reclaimed EMA 20/50 |
| Absolute structural support | $57,750 – $58,000 | 21-month low, H4 Double Bottom base |
| Macro danger zone | $56,200 | Historically thin buy-side liquidity |
| Capitulation support | $50,000 – $53,000 | Citigroup’s recession scenario |
Takeaway: a genuine rebound, confirmation still pending
This recovery from $57,750 to $62,700 is no statistical fluke: it stems from a favorable macro shock colliding with an order-book imbalance that acted as an accelerant. The bullish setups on the shorter timeframes — a validated Double Bottom, a consolidating bull flag, reclaimed EMAs — are undeniable, but the daily-level picture remains in recovery mode: Bitcoin is still trading well below its $126,223 all-time high, and the 200-day moving average has not yet been firmly reclaimed.
What happens over the coming weeks hinges on whether the market can convert this speculative impulse into durable organic demand. A solid defense of the $60,400 support, combined with continued ETF inflows, would open the path toward the $67,600 magnetic zone. Conversely, fading institutional flows or stickier-than-expected US inflation could turn this rebound into a bull trap, sending price back toward the critical $57,750 support.
Disclaimer: This article is provided for educational and informational purposes only. It does not constitute investment advice or a recommendation to buy or sell any digital asset. Cryptocurrencies are volatile and high-risk assets; please do your own research and consult a qualified financial advisor before making any investment decision.