

Bitcoin and Extreme Fear in April 2026: Is It Time to Buy the Dip?
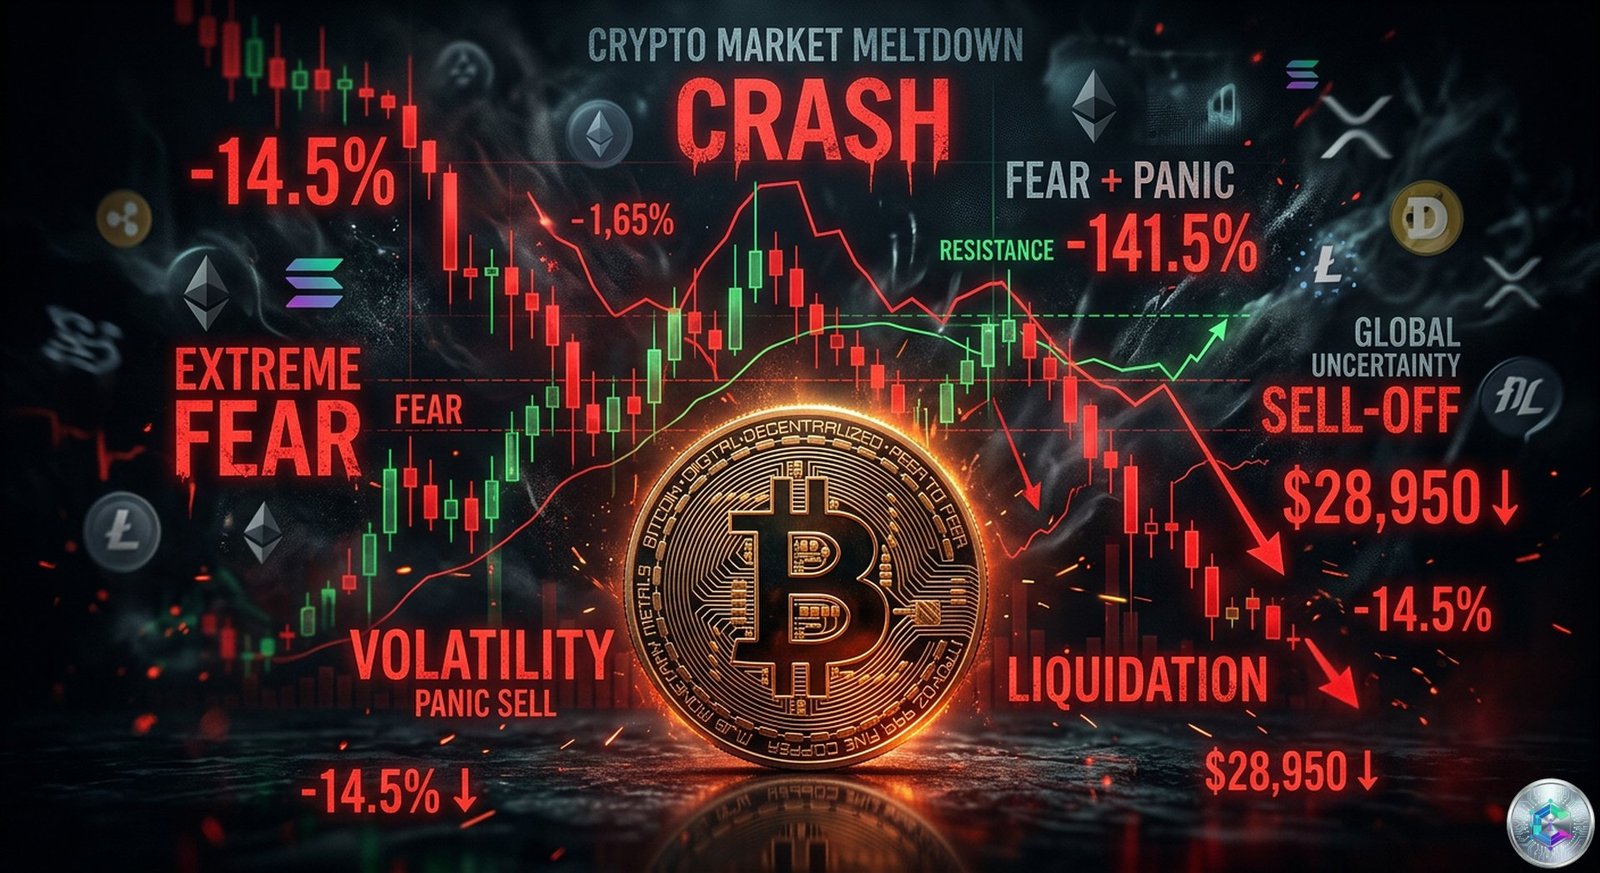
The Fear and Greed Index dropped to 12. Twelve. That is the lowest reading since the Terra collapse in June 2022, and the market has now spent 46 consecutive days in extreme fear territory — the longest stretch since the Luna Classic crash and its defective stablecoin sibling obliterated confidence in the ecosystem. Meanwhile, Bitcoin has fallen 47% from its all-time high of $126,000, Ethereum is down 59% from $4,950, Solana has shed 70% from $294, and XRP has plummeted 60% from $3.65. Prices have bled, sentiment has collapsed, social media is flooded with panic and calls to sell, and yet… it is precisely in these moments that Bitcoin’s history has been written in the most profitable ways for those who managed to keep a cool head.
April 2026 is no exception to the historical pattern. The market enters this traditionally bullish month — Bitcoin’s best calendar month according to a decade of data — with a mix of despair and statistical opportunities that speak for themselves. Should you be afraid of fear? Should you sell when everyone else is selling? Or is this precisely the moment when the best-informed actors are quietly accumulating? Here is what the data, the track record, and the current macro context tell us, without filters and without compromise.
History Repeats: April, Bitcoin’s Historic Month
From a strictly historical perspective, April is Bitcoin’s most favorable month. According to CoinGlass data, the digital asset generated an average return of 33.4% in April over the last ten years, with a median gain of 7.57%. It is the month that, on average, delivered the best calendar performances for BTC holders — an asset that has survived crashes, scandals, regulations, and hype cycles, but invariably returns to higher price levels a few months after each trough.
But these statistics raise a legitimate question: is Bitcoin entering April 2026 under the same conditions as previous years? The short answer is no, and it is important to understand why mechanically applying a historical model could lead to mistakes. BIT (formerly Matrixport) noted that BTC’s RSI sits around 47%, a level that looks more like last year’s starting point than the overheated conditions that preceded sharper corrections in earlier cycles. Momentum is weak, price dynamics are broken, and trading volumes remain below those observed during previous rallies. And yet, paradoxically, the price levels reached in recent weeks are starting to attract institutional buyers who see the decline as an accumulation opportunity.
The last time the Fear and Greed Index spent more than 40 days in extreme fear territory was during the Terra collapse in 2022. Bitcoin was trading around $16,000 at that time, at the bottom of a market crushed by panic. A few months later, it crossed $69,000 during the next bull cycle. In March 2020, the index dropped to 8 during the COVID crash, and Bitcoin subsequently gained more than 300% in twelve months. This historical reminder is obviously not a guarantee of future performance — every cycle has its own specificities — but it illustrates the profoundly cyclical nature of this market and Bitcoin’s propensity to restart precisely when no one expects it, at the moment when despair reaches its peak.
The Macro Backdrop: Middle East Weight and Contradictory Fed Signals
April 2026 is unfolding in a particularly heavy macroeconomic environment for risk assets. The conflict between the United States and Iran continues to weigh on global financial markets. Oil prices have crossed $100 per barrel for the first time in a long while, a rise of about 60% since the conflict began that directly fuels inflation concerns and constrains the Federal Reserve to maintain a cautiously restrictive stance despite calls for easing. Analysts now expect Brent to average $82.85 per barrel across 2026, up from $63.85 in February — a drastic revision that changes the game for all assets sensitive to energy costs and risk sentiment.
Signs of hope emerged in late March, however. Media reported that Iranian President Masoud Pezeshkian was willing to end the conflict if guarantees were given to Tehran, a statement that surprised markets with its conciliatory tone. US President Donald Trump said Washington could wind down the fighting within weeks, a claim that triggered a relief rally across risk assets. This de-escalation prospect pushed Bitcoin above $68,000, with gains of more than 3% in 24 hours — a swift reaction that demonstrates the market’s sensitivity to geopolitical headlines.
Binance Research analysts noted that these ceasefire signals could extend the ongoing crypto recovery, with digital assets like Ethereum likely to outperform if risk appetite improves further due to the negative correlation between crypto assets and the dollar index. However, the team cautioned that Iranian officials have described the contacts as message exchanges rather than formal negotiations, and Israel’s war aims remain structurally tougher than Washington’s. Threats from the Islamic Revolutionary Guard Corps against major US companies remain a live tail risk that has not disappeared from market participants’ radar screens.
April’s macro calendar is particularly heavy, and each event could undermine the ongoing recovery. The March employment report will be released on April 3 and could show a weaker labor market than expected, which would weaken the dollar and support risk assets. Minutes from the Federal Open Market Committee meetings of March 17-18 will be released on April 8 and will be scrutinized for any signal on upcoming rate decisions. The Fed’s Beige Book will be published on April 15, offering a regional economic panorama. And the next formal Fed meeting is scheduled for April 28-29, with a decision that could either confirm the accommodative trend or impose a brutal awakening on markets. Each event is a potential volatility trigger for Bitcoin and the broader crypto ecosystem.
The Options Market: Traders Are Positioning for a Rally… With Caution
The options market offers particularly interesting insight into differentiated trader positioning at the start of April. According to CME Group, March Bitcoin options open interest showed approximately $660 million in calls against $240 million in puts, a nearly three-to-one ratio that reflects demand for short-term directional recovery bets even as spot sentiment remains wary and crypto media is saturated with catastrophic headlines. This configuration shows that the buy side remains active on derivatives even when spot is under pressure — a sign of strategic positioning rather than capitulation.
However, longer-term positioning is clearly more defensive. On the June expiry, put open interest exceeds calls, suggesting market participants are seeking downside protection rather than aggressive bullish directional bets with a distant time horizon. This divergence between short-term positioning (optimistic) and long-term positioning (defensive) is characteristic of a recovering market: buyers step in on dips but do not commit massively to aggressive directional positions with large risk exposure. They are looking to capture potential upside without taking excessive asymmetric risk in case of a new bearish wave.
From a technical standpoint, Bitcoin has shown its ability to defend major psychological levels after sharp drops — a phenomenon observed several times during the first quarter of 2026 — but lack of follow-through buying has prevented any rapid restoration of confidence. Trading volumes remain below average, signaling a general lack of conviction. It is a market that wants to bounce but is waiting for a clear macroeconomic catalyst or a frank technical breakout to accelerate — the missing fuel to transform a technical bounce into a sustained trend.
Institutional Flows: Whales Are Buying While Retail Sells
One of the most interesting signals of this early April 2026 comes from institutional actors, whose decisions are often more rational and better-informed than those of retail investors. Strategy, formerly MicroStrategy, under Michael Saylor’s leadership, announced it added more than 85,000 BTC in the first quarter of 2026 alone, bringing its total to over 766,970 Bitcoin — a methodical accumulation that does not seem affected by daily price fluctuations. The company continues to build its position in a disciplined manner, treating every dip as an opportunity to accumulate more asset at a lower average cost, according to a strategy that has proven itself over several years now.
In parallel, spot Bitcoin ETFs recorded $1.32 billion in net inflows in March, marking the first positive month after a sustained string of outflows. This reversal is significant: after months of consecutive outflows that had weighed on prices, the arrival of positive flows shows that the momentum is beginning to reverse. According to SoValue, Bitcoin ETFs now hold $86.22 billion in net assets, with cumulative inflows since launch of $55.96 billion. The inflow of institutional money into these products remains impressive, and when institutional interest increases during downturns — when prices are low — it is generally a sign that these actors are anticipating a reversal toward higher prices.
The gap between retail and institutional behavior is becoming increasingly visible at this stage. While retail investors reduce their exposure for fear of further drops — a typical emotional response in markets gripped by fear — whales and institutions go the opposite way. This decoupling between small investor sentiment and actual flows from major players is one of the most recurring phenomena of this 2025-2026 bear cycle, and it strongly recalls dynamics observed in 2022 at the $16,000 bottom.
Ethereum: The Logical Next Stop after Bitcoin?
Ethereum has suffered the steepest percentage decline among the top four crypto assets by market capitalization, with a 59% drop from its $4,950 peak. At around $2,050 currently, ETH is trading at a level that is systematically beginning to attract long-term buyers who believe the decline has been exaggerated relative to the network’s fundamentals. The Ethereum Foundation has continued to demonstrate its commitment by staking over 45,000 ETH toward a broader target of 70,000 ETH, a move that temporarily removes these tokens from circulation and reduces selling pressure on the market.
Risks remain present and it would be imprudent to ignore them. Competition from faster and cheaper blockchains — Solana, Avalanche, and newer L2s like Base and zkSync — continues to trigger migrations of projects and users to other networks, threatening Ethereum’s dominance in the DeFi segment. Layer 2 activities, which should normally support the mainnet by offloading transactions and reducing fees, have not yet returned to pre-crisis levels. And yet Ethereum’s network depth in terms of liquidity, institutional inflows into recently approved ETH ETF products, and its central role as infrastructure for tokenized assets make it one of the most likely destinations for capital rotation if monetary conditions ease in the coming months.
Price target ranges for Ethereum according to institutional analysts sit between $4,500 and $7,500, representing upside potential of 120% to 265% from current levels around $2,050. These projections, although ambitious, are not unprecedented in Ethereum’s history, which has experienced rallies of this magnitude several times during previous bull cycles. For Bitcoin, projections range from $95,000 to $120,000 from current levels around $68,000, or upside potential of 40% to 77% — a more modest multiple but also a historically lower risk given BTC’s position as the reference digital asset and store of value.
Solana and XRP: The Riskier but More Rewarding Bet
Solana experienced the most dramatic decline among the top four crypto assets by capitalization, with a 70% drop from its $294 peak. At around $80, Solana offers the highest proportional upside potential if market sentiment truly improves — but also the highest risk in case of a new bearish wave. Identified catalysts for April 2026 include decentralized exchange (DEX) volume on Solana that now exceeds Ethereum’s on certain periods, a sign of the network’s efficiency and growing adoption, as well as pending Solana ETF approvals that could unlock a wave of new institutional flows into this more risky but historically more performant asset during recovery cycles.
XRP, on the other hand, is penalized by persistent regulatory uncertainty around Ripple Labs and the legal classification of the token. Projections for April range between $2.50 and $4.00, with upside potential of 90% to 200% from current levels around $1.35, but the primary catalyst remains the markup of the CLARITY Act expected in late April in the US Congress — legislation that could finally bring much-needed regulatory clarity to the US crypto sector and eliminate the Damocles sword hanging over Ripple and by extension XRP for years.
Should You Buy in Extreme Fear? The Objective Analysis
The question deserves to be asked honestly, without excessive optimism or pessimism, with the data on the table and eyes wide open to the risks. The Fear and Greed Index dropping below 10 has historically been associated with privileged entry points for Bitcoin, with median returns of approximately 38.4% in the 90 days following those absolute troughs — meaning that statistically, buyers at these levels have been rewarded in the vast majority of cases. However, every cycle is different, and current macroeconomic conditions — with global trade wars, geopolitical tensions in the Middle East, and persistent inflation in certain sectors — create unknowns that historical models cannot fully incorporate.
What is indisputable is that institutional actors are buying. Strategy, ETFs, large investment funds — all are increasing their positions in a visible and documented manner while sentiment remains desperately bearish in media and on social networks. Bitcoin’s history is paved with moments when the crowd walked away from the asset and whales accumulated silently before the next major rally. In 2022, at the market bottom of $16,000, media were talking about the death of Bitcoin. Michael Saylor was buying. Two years later, BTC exceeded $73,000.
April 2026 could be one of those historical moments. Or not. The Middle East war could intensify rather than resolve, the Fed could remain hawkish longer than expected, and Bitcoin’s price could indeed drop back below $60,000 as some analysts fear. But one thing is certain: periods of extreme fear have historically rewarded those who managed to keep a cool head and a long investment horizon. Bitcoin has never failed to set new records after every major crisis. The question is not whether the market will recover — that is a near-certain event given the track record — but when, and above all, who will be positioned to benefit when the reversal materializes.
*The cryptocurrency market is volatile and carries significant risk of capital loss. The information contained in this article is provided for purely informational purposes and does not constitute personalized investment advice in any way. Always do your own research and consult a qualified financial advisor before making any investment decision.*

