
At the beginning of 2026, Bitcoin is trading in a critical zone between $90,000 and $92,000, crystallizing the tensions of a market torn between solid institutional fundamentals and persistent macroeconomic uncertainty. This in-depth analysis reveals the complex mechanisms currently dictating BTC’s valuation.
The Macroeconomic Context: A Delicate Balance
Bitcoin now operates in an environment where its correlation with traditional markets has never been more pronounced. The imminent publication of the December 2025 Consumer Price Index (CPI) on January 13, 2026, represents a critical pivot for first-quarter asset allocations.
Higher-than-expected inflation would strengthen the likelihood that the Federal Reserve will maintain its policy rates at restrictive levels, exerting immediate downward pressure on Bitcoin. However, an alternative scenario emerges: if inflation is perceived as structural rather than cyclical, Bitcoin’s narrative as a hedge against monetary debasement could regain dominance.
Political Tensions and Fed Independence
A new and potentially explosive element in 2026 is the open politicization of monetary policy. Intense political pressure on Jerome Powell challenges central bank independence, a cornerstone of confidence in modern fiat currency. This dynamic could paradoxically strengthen Bitcoin’s appeal as an apolitical asset whose monetary policy is coded into the protocol.
Institutional Adoption: The Strategy Factor
MicroStrategy (Strategy) continues to redefine corporate treasury rules. With a total of 673,783 BTC in January 2026, Michael Saylor’s firm creates structural buying pressure on the market. The company still has over $11 billion in purchasing capacity, acting de facto as a « buyer of last resort. »
However, this concentration introduces systemic risk. With an average purchase price around $75,000, a prolonged drop below $80,000 could force strategic adjustments, weighing on BTC through contagion.
Technical Analysis: Daily Chart Overview
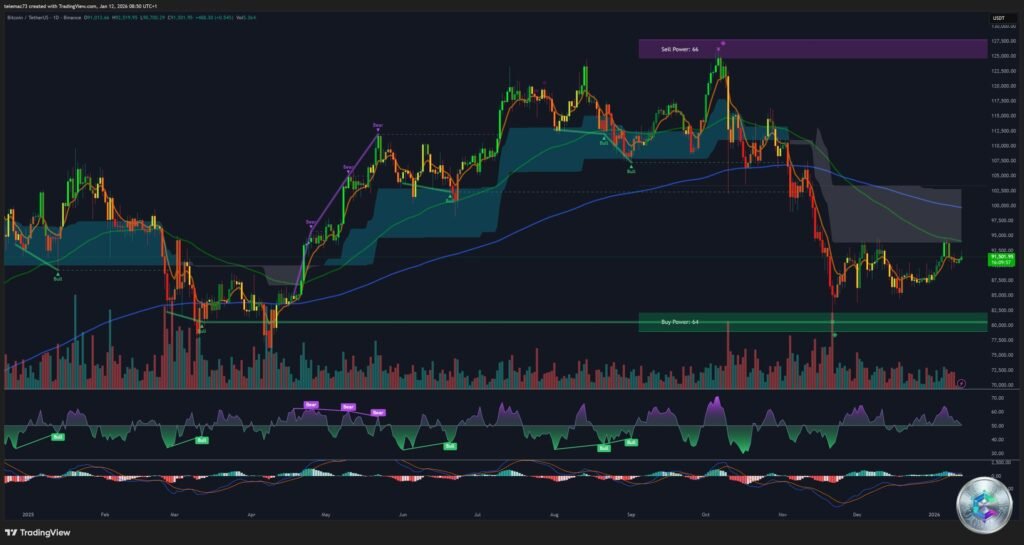
The daily chart reveals a horizontal consolidation structure between $86,000 and $94,000, characteristic of a digestion phase after the late 2025 rally. This formation resembles the March-May 2025 period, which proved to be a reaccumulation phase according to Wyckoff methodology.
The 50-day moving average (MA50) sits around $90,600 – $90,800 and acts as immediate resistance. A clean daily close above this line would be the first signal of buyers regaining control. The RSI oscillates around 47-50, the absolute neutrality zone, indicating no immediate excess to correct.
4-Hour Tactical Analysis: The Trend Channel
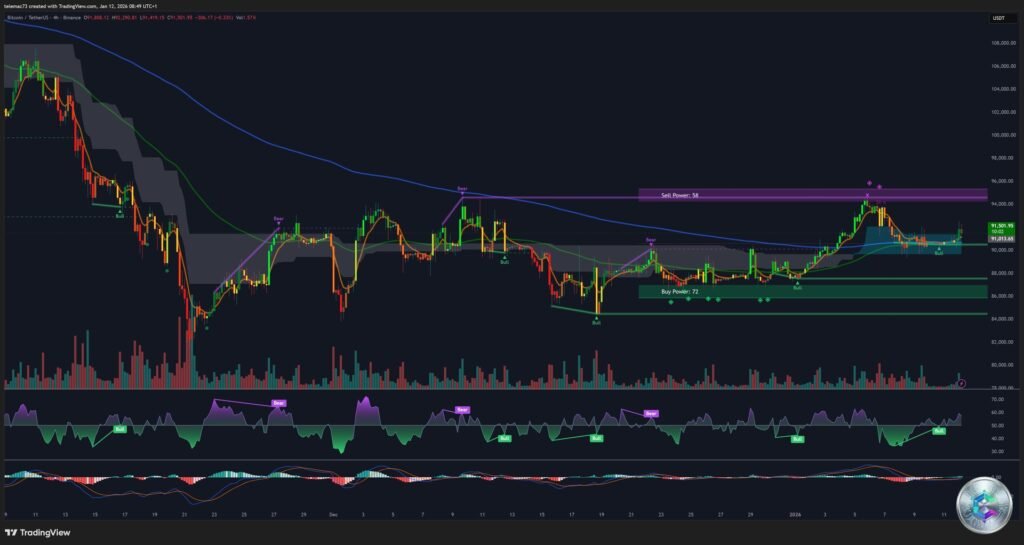
On the 4-hour timeframe, Bitcoin evolves within a moderate ascending channel since December 24, 2025. The channel’s lower boundary, currently tested around $89,200 – $89,500, confirmed its relevance during the January 12 technical bounce. The upper boundary projects toward $96,000, the theoretical target if the current rebound continues.
Tightening Bollinger Bands on this timeframe indicate an impending volatility expansion. Historically, these compressions precede violent moves in either direction.
Intraday Trading: The 15-Minute Microstructure
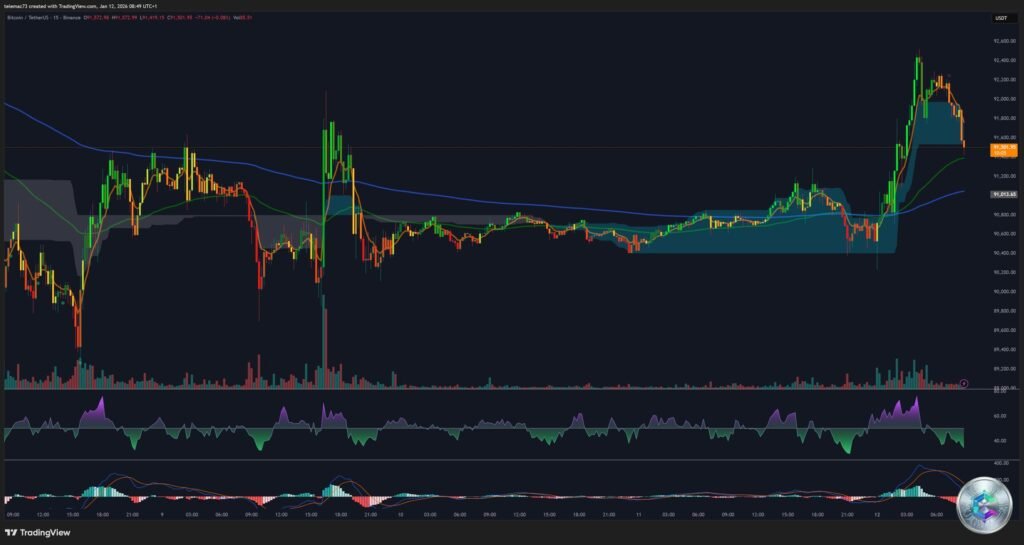
The 15-minute chart reveals numerous long lower wicks around $90,000, quickly bought back, indicating passive buyers absorbing selling liquidity. Conversely, push attempts above $92,000 are systematically sold.
For day traders, the optimal strategy is to « fade » the range extremes: sell approaches to $92,300 and buy approaches to $90,200. Volatility increases particularly at the opening of New York (2:30-4:00 PM UTC) and London (8:00-9:30 AM UTC) sessions.
Order Flow Analysis: The Heatmap
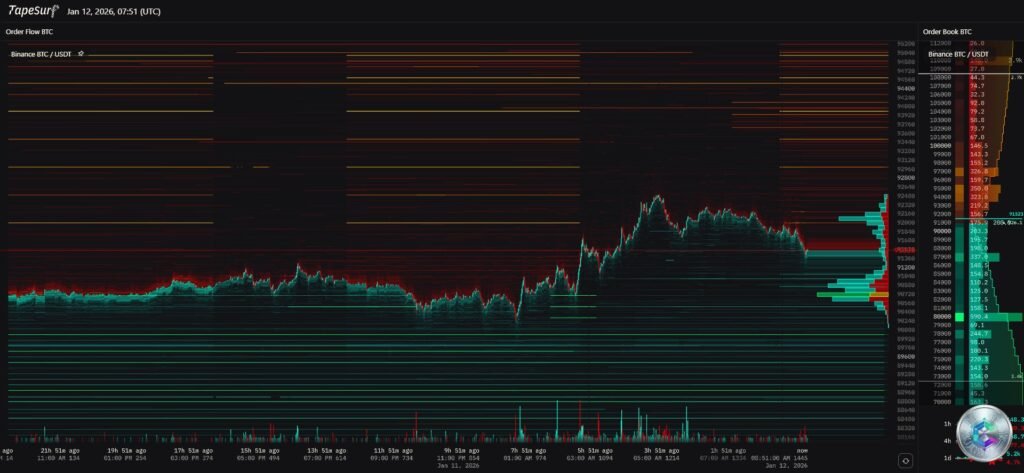
The liquidity heatmap reveals the distribution of pending orders. We observe buy walls concentrated toward $90,000 and lower toward $88,000, acting as shock absorbers in case of violent drops. Above the current price, liquidity is staggered in steps toward $92,500, $93,000, and higher, making the ascent laborious.
This asymmetric liquidity structure suggests the market expects more lateral consolidation than an immediate breakout in either direction. Professional traders use this data to identify zones where volatility will accelerate upon consumption of these walls.
Spot ETFs: Institutional Flow Barometer
Bitcoin spot ETFs have become the primary access channel for traditional institutional capital. After massive inflows of $1.2 billion in the first sessions of 2026, the market experienced consecutive net outflows, reflecting caution ahead of uncertain economic data.
The correlation between daily net ETF flows and Bitcoin price action has become extremely strong intraday. A session where ETFs record net outflows has statistically very little chance of ending in the green for BTC/USD.
Key Technical Levels to Watch
Resistances:
- $98,000 – $100,000: Psychological barrier of six figures, massive profit-taking zone and massive Call options concentration
- $94,000 – $95,000: Current range high, repeated breakout failures
- $92,100: Intraday resistance for scalping
Supports:
- $90,000: Psychological pivot and neutral zone
- $88,000 – $89,200: Major support, ideal institutional buying zone
- $86,000: Critical support, consolidation range low
- $74,000: Ultimate support in case of capitulation, former April 2025 high
Strategic Scenarios
Bullish Scenario (45% probability): The January 13 CPI is in line or better than expected. Bitcoin successfully defends $89,500 and consolidates for a few days before breaking $93,500, attracting volumes. Target: $100,000 – $105,000 before end of January/early February.
Sideways Scenario (35% probability): Mixed CPI data and absence of strong catalyst. The market remains trapped between $88,000 and $94,000. Traders play « ping-pong » between boundaries while Altcoins could temporarily outperform.
Bearish Scenario (20% probability): Major inflation surprise or serious geopolitical escalation. Break of $89,200 support, then $86,000. Potential test of the $74,000 – $80,000 zone, which would be seen as the ultimate buying opportunity of the year.
Market Sentiment
The Fear & Greed Index oscillates around the « Neutral » to « Fear » zone (score ~40-41). Paradoxically, this is a bullish sign. The fact that sentiment is so low while the price is near ATH shows the market is not in euphoria. Much skepticism remains, which is healthy for a bullish continuation.
Funding Rates have returned to neutral levels after being very high in early January. Excess leverage has been cleared, making the market healthier and less susceptible to cascading liquidations.
Conclusion
Bitcoin in January 2026 is a maturing asset. Wild early volatility gives way to a more complex market structure, dominated by institutional flows and macroeconomic variables. Patience and precision are key.
As long as the $86,000 support holds, the underlying trend remains bullish, and the current consolidation should be seen as a necessary pause before the potential conquest of six figures. The January 13 inflation data will be the decisive factor for this year’s start, determining whether Bitcoin continues its march toward new highs or begins a deeper correction.
Disclaimer: This article is provided for educational and informational purposes only. It does not constitute investment, financial, or purchase advice in any way. Cryptocurrency markets are highly volatile and carry significant risks. Any investment decision should be made after consulting with a professional financial advisor and personal assessment of your financial situation and risk tolerance.