


In mid-May 2026, Bitcoin (BTC/USD) is navigating a critical revaluation phase. Following a violent rejection below the $82,477 psychological threshold, the market plunged under $80,000, wiping out nearly $90 billion in market capitalization in a single session and triggering liquidation waves between $527M and $700M. This in-depth analysis dissects the macroeconomic dynamics, order book microstructure, and technical signals across multiple timeframes.
⚡ Macro Context: The Triple Burden of May 2026
Inflation & Monetary Policy
The unexpected acceleration of the U.S. Consumer Price Index (CPI) to 3.8% YoY in April 2026 (up from 3.3% in March) has forced the Federal Reserve into a firmly restrictive stance. No monetary easing (pivot) will be considered before a sustained return of inflation toward the 2% target. The direct consequence: Bitcoin price probability forecasts on prediction markets collapsed from 47% to 29.5% within 24 hours. University of Michigan 1-year inflation expectations surged to 4.5% in May, further fueling the Fed’s hawkish bias.
Bond Yields & Opportunity Cost
The U.S. 30-year Treasury yield has surged to 5.131%, its highest level since May 2025. In this context, Bitcoin — a zero-coupon asset generating neither dividends nor intrinsic interest — faces a major structural disadvantage against a guaranteed risk-free rate exceeding 5%. Institutional capital managers are making rational Sharpe ratio-driven arbitrage decisions: bond yields above 5% mechanically drain liquidity away from volatile assets. The DXY dollar index has also strengthened to 98.52, adding further downward pressure on all USD-denominated assets. The Bitcoin/Nasdaq 30-day rolling correlation has crossed the 0.7 threshold, amplifying every tech sell-off.
Energy Shock & The 2022 Analogy
Geopolitical tensions in the Middle East — particularly uncertainty surrounding the Strait of Hormuz — have propelled WTI crude to $105.42/barrel (+4.2% daily, +11.33% monthly), while Brent reached $109.26. This dangerous convergence — persistent inflation, explosive bond yields, elevated geopolitical risk — recreates a macroeconomic environment dangerously similar to the first half of 2022, a period that spawned a devastating bear market and cascading insolvencies across the crypto ecosystem.
📊 Microstructure: Institutional Flows & Order Book Dynamics
Brutal Reversal of Spot ETF Flows
The primary driver of Bitcoin’s recent rally to $82,000 was massive institutional accumulation via spot Bitcoin ETFs, with BlackRock’s IBIT now managing over $63 billion in assets under management. However, the flow dynamics experienced a violent reversal in mid-May 2026:
- May 13: Massive net outflows of $630.4M
- May 14: Modest compensatory inflow of $131.3M
- May 15: Another wave of $290.4M in outflows
- Net balance: -$268.5M over the period — confirmed tactical institutional disengagement
This institutional retreat is systemic: the ETF « liquidity cushion » that had served as a bulwark against macro selling pressure disappeared precisely when the critical $78,000 support needed to be defended. Adding to supply pressure, a 12-year-dormant Bitcoin wallet moved 500 BTC, crystallizing an estimated $40M in profit — a sign that early adopter « whales » are strategically taking profits during macro uncertainty.
Heatmap: Liquidity Asymmetry & Spoofing
The order book heatmap reveals an extreme concentration of Sell Walls stacked above $78,000 and $80,000, contrasted against a significantly fragmented and thin bid side. This asymmetry explains the velocity of the price decline: market sell orders encounter minimal resistance, creating « air pockets » and significant slippage. Dynamic analysis of these heatmaps over short periods also suggests endemic use of spoofing techniques by high-frequency trading (HFT) algorithms — placing large limit sell orders with no real execution intent to manipulate market psychology and force market makers to continually reprice downward.
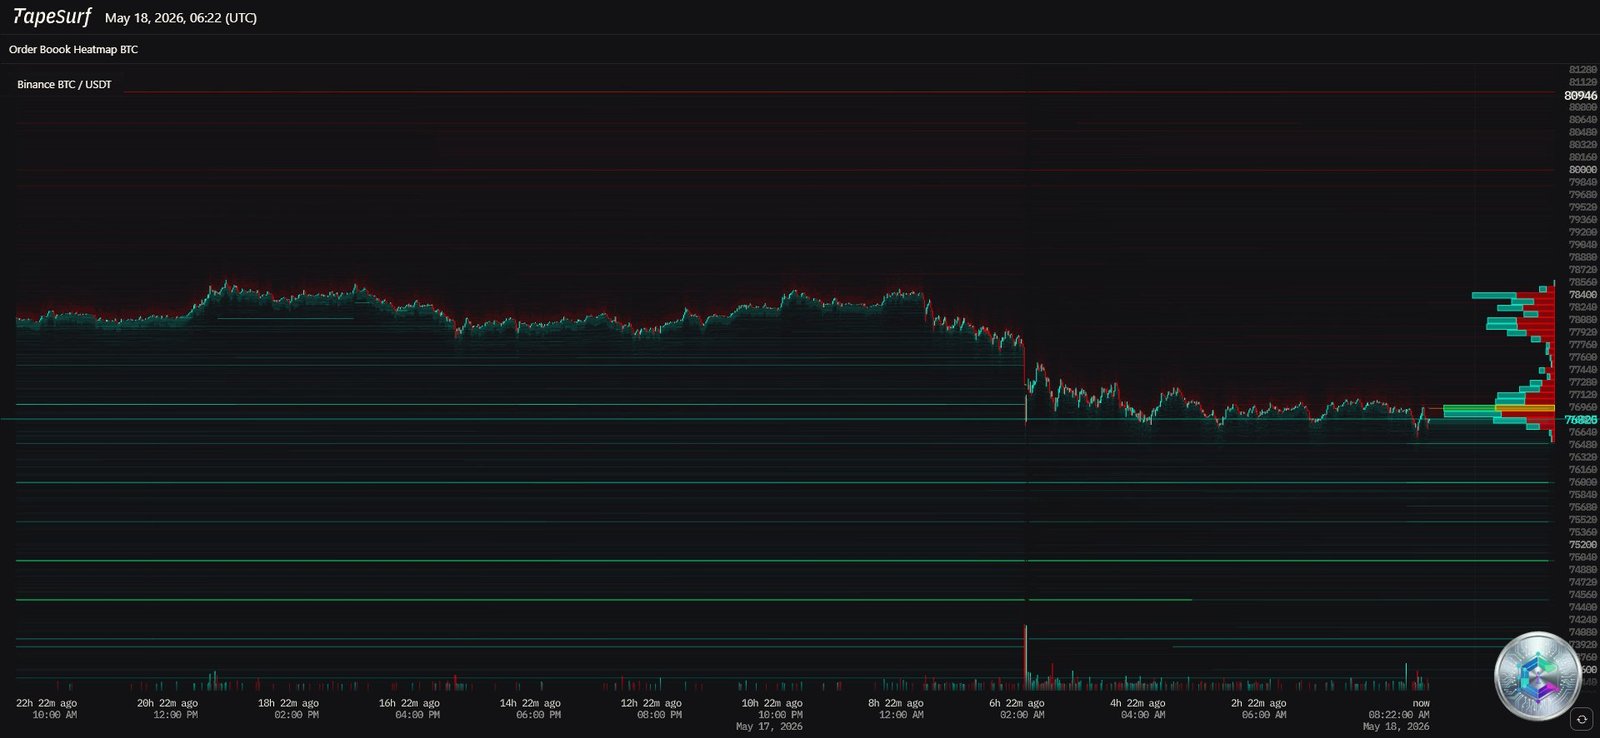
Notably, $1.5 billion in stablecoins flowed into Binance — not a signal of immediate buying, but rather a defensive maneuver allowing operators to preserve capital within the crypto ecosystem while shielding themselves from Bitcoin’s directional volatility.
Liquidation Cascade & The Incoming Crypto VIX
The break below $80,000 triggered a stop-loss cascade liquidating between $527M and $700M in long positions. Paradoxically, aggregate Open Interest continued to increase during the decline, confirming aggressive initiation of new short positions. Funding rates turned deeply negative across multiple exchanges — shorts paying a premium to longs to maintain their positions, a clear signal of bearish dominance. Additionally, the CME will launch Bitcoin Volatility Futures on June 1, 2026 (subject to regulatory approval), providing institutional-grade hedging instruments equivalent to a « Crypto VIX. » The anticipation of these tools likely explains why large operators are currently reluctant to take directional positions before gaining full access to proper risk management instruments.
📈 Multi-Timeframe Technical Analysis
Daily Chart (1D): The Institutional Wall at $82,000
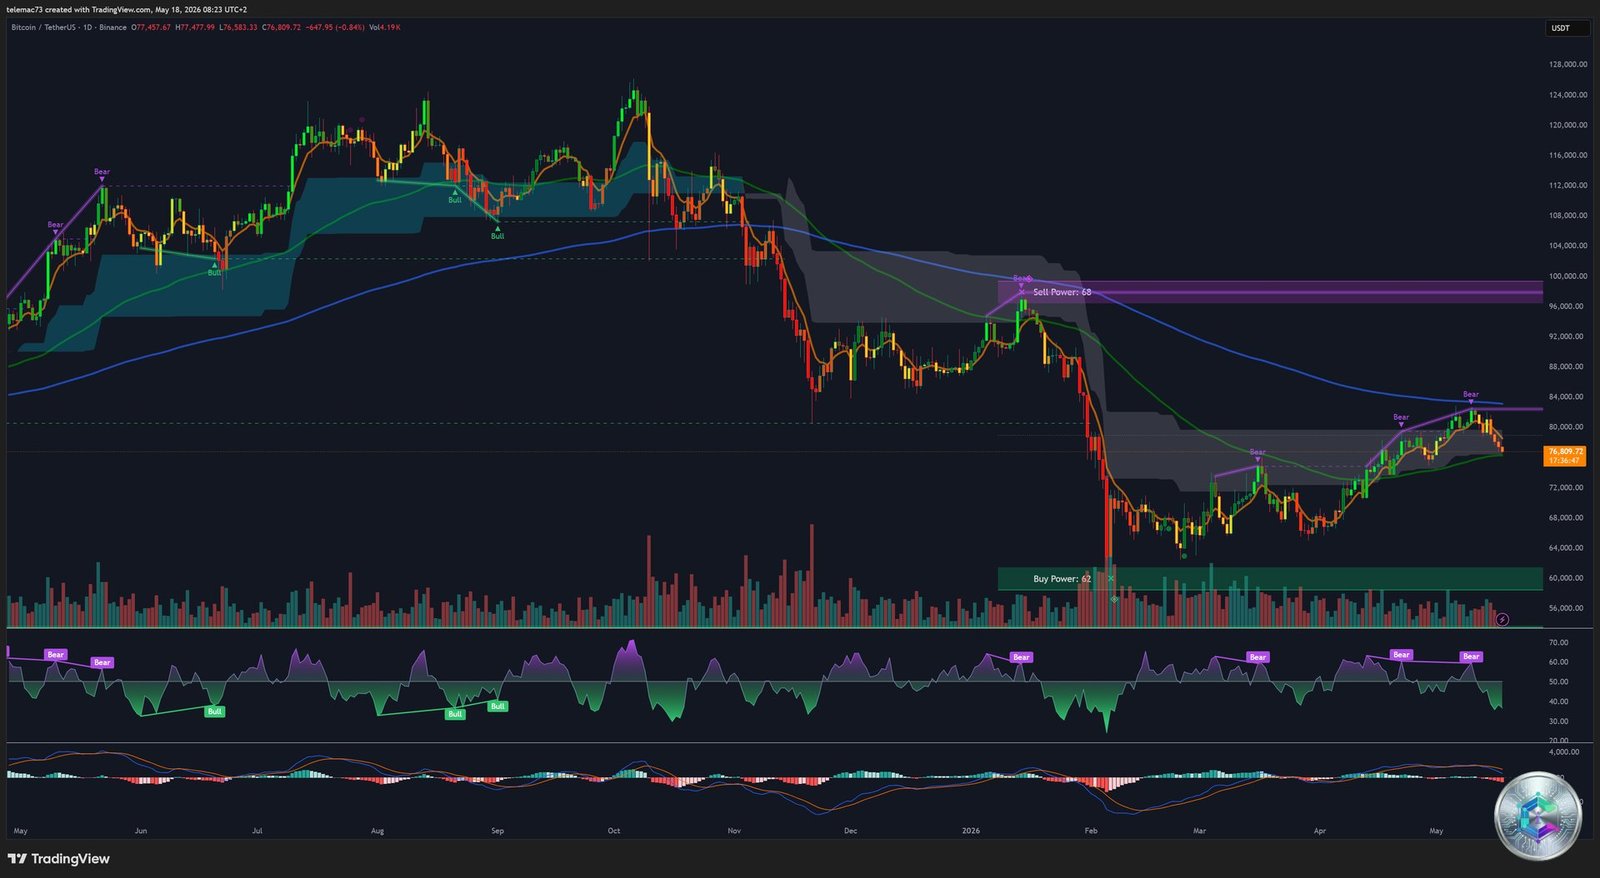
On the daily chart, Bitcoin’s bullish advance collided head-on with a critical technical confluence — the 200-EMA at $82,027 and the 200-SMA at $82,455 — forming an impenetrable institutional wall. This rejection closely mirrors the one observed at the onset of the 2022 bear market, where the 200-SMA acted as an insurmountable resistance line. The convergence of the 100% Fibonacci extension ($82,477) + Sell Power block + 200-SMA + 200-EMA triggered systemic algorithmic profit-taking. However, several key on-chain fundamental levels have not yet broken down:
- 128-DMA at $75,700: average acquisition cost of medium-term holders
- True Market Mean at $78,200: aggregated intrinsic value of each BTC on-chain
- STH Cost Basis at $78,400: cost basis of buyers from the last 155 days
As long as price holds the $78,000–$78,400 zone, most recent participants remain in unrealized profit, significantly mitigating the risk of a panic-driven mass capitulation. The daily Stochastic RSI is recovering from oversold territory, hinting at underlying rebound potential beneath the surface.
4-Hour Chart (4H): Bear Flag & CME Gap
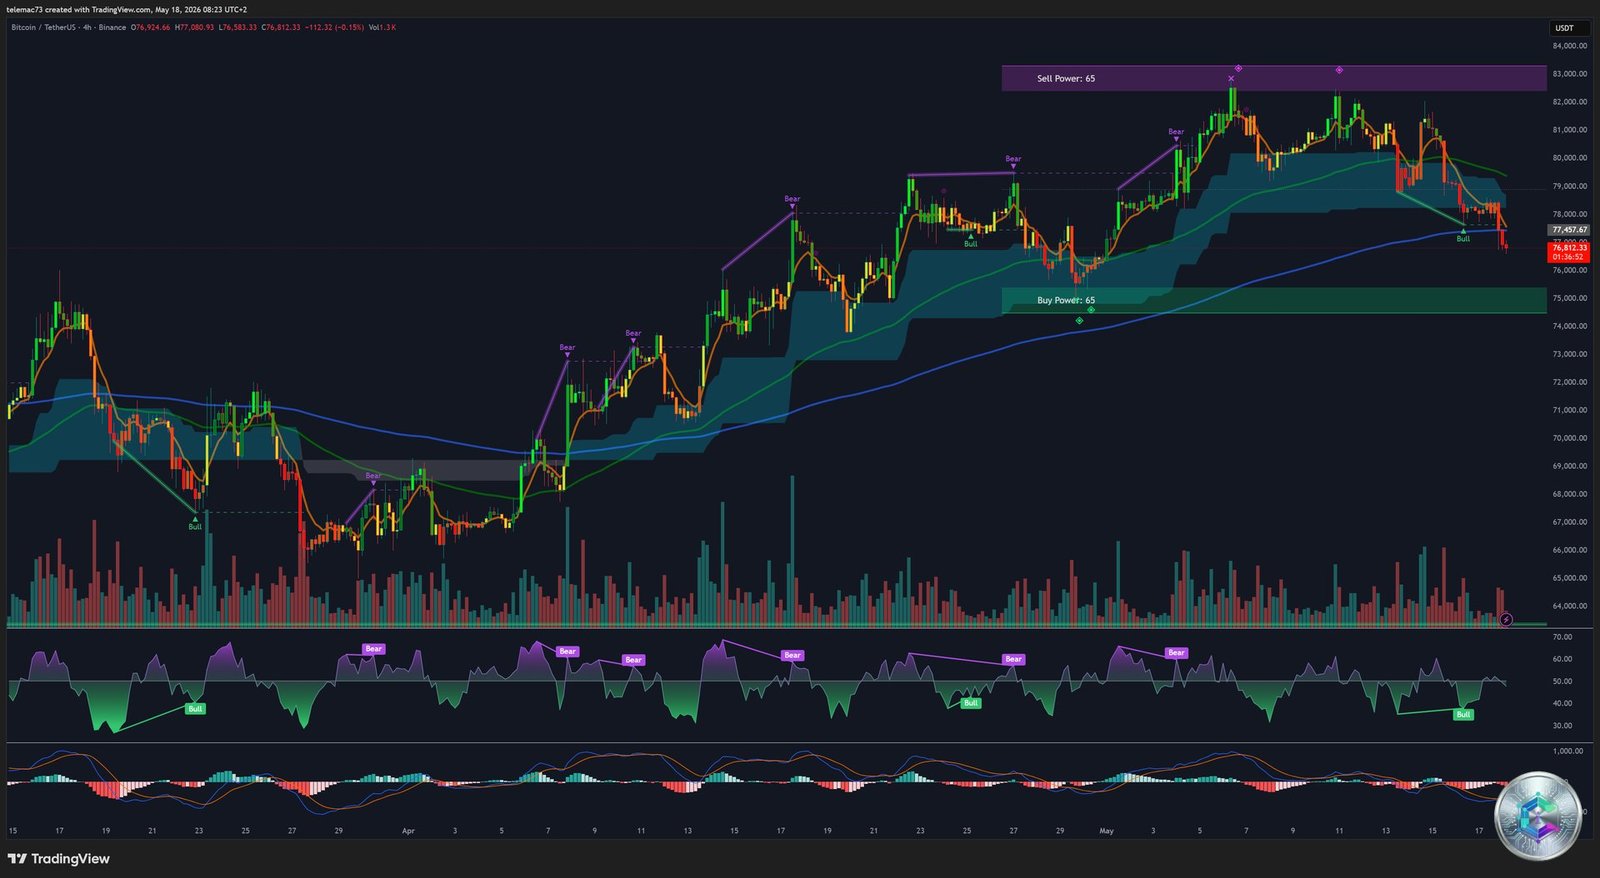
On the 4H timeframe, two elements dominate the analysis. First, a significant CME Gap between $79,000 and $84,000 with a specific algorithmic price magnet around $79,123 (aligning with the 50% Fibonacci retracement). This liquidity void exerts a constant bullish pull, systematically exploited by HFT algorithms. Second, the post-crash consolidation structure is forming a textbook Bear Flag — a classic continuation pattern representing a temporary pause in bearish momentum before sellers resume control. The 4H MACD confirms a local Death Cross, but the histogram shows declining red bars — a compression signal preceding the next explosive directional move.
15-Minute Chart (15m): Micro-Action & Technical Bounce
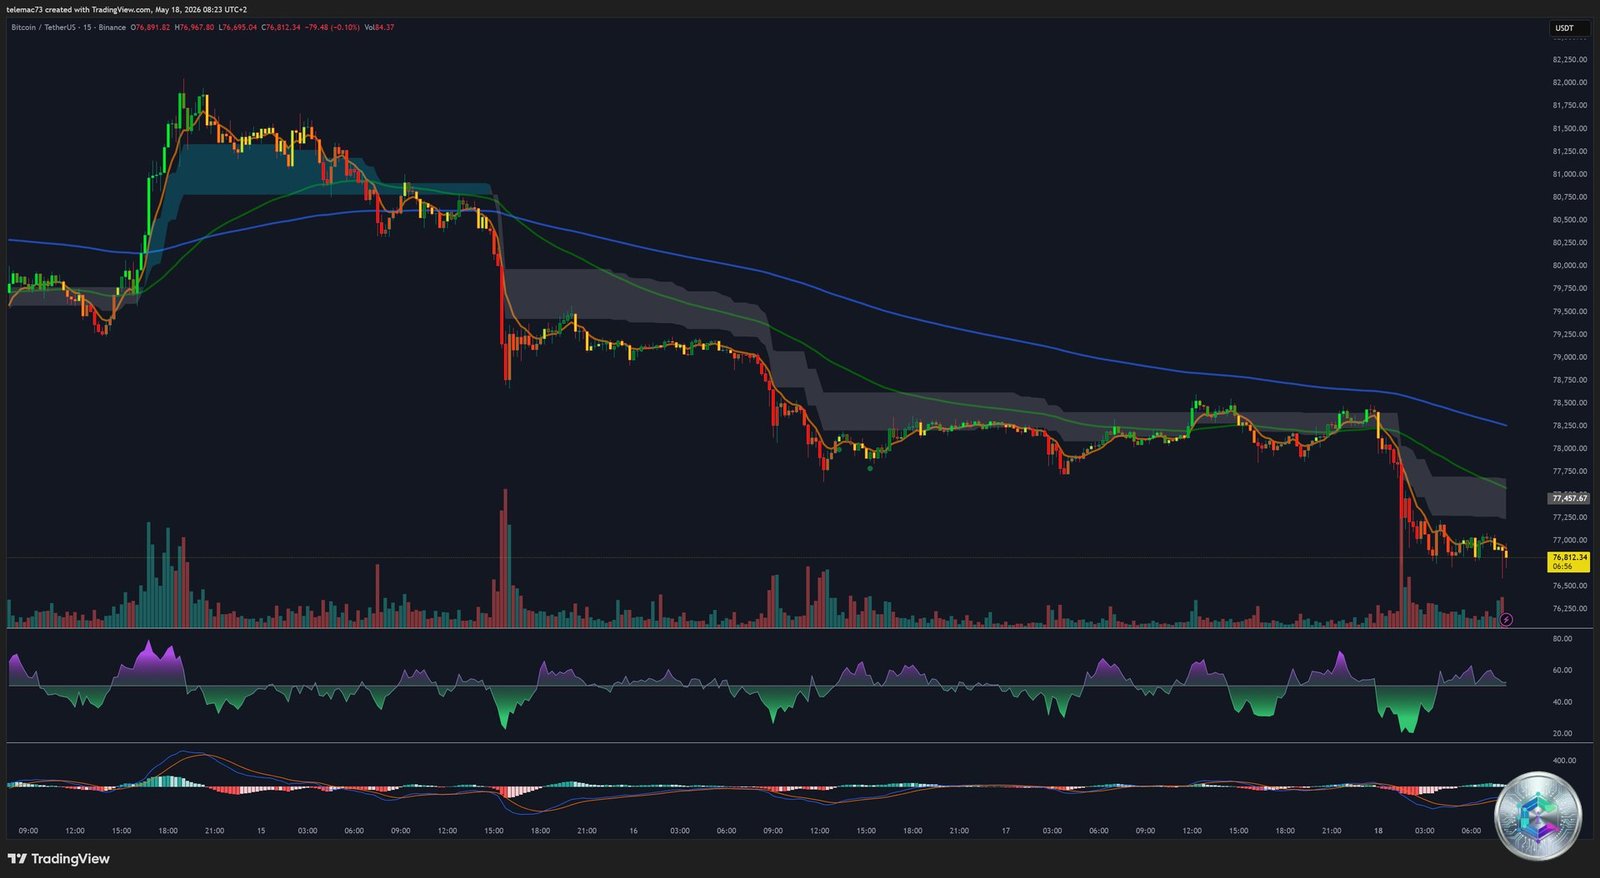
At the 15-minute granularity, intraday volatility has been exceptional. Price touched local lows at $76,869 via deep liquidation wicks, driving the RSI into extreme oversold territory (15–20, well below the 30 threshold). This condition of absolute overselling mechanically triggered a V-shaped recovery bounce toward the $78,225 zone — classic behavior of HFT scalping algorithms exploiting standard deviation deviations for mean-reversion arbitrage. Fleeting Golden Crosses on the 15m MACD validate the purely technical (not structural) nature of these rebounds. Every bullish attempt is systematically rejected by the cloud of overhead moving averages: bears firmly control intraday order flow.
🎯 Key Levels: Support & Resistance Map
Major Resistance Zones
| Zone | Price (USD) | Justification | Near-Term Breakout Probability |
|---|---|---|---|
| Upper Fibonacci Extension | $87,273 | Major theoretical target in case of complete macro-bearish paradigm reversal. | Very Low |
| Fibonacci Golden Ratio (0.618) | $83,522 | Extreme friction zone, upper CME gap target. Heavy resistance cluster. | Low |
| Absolute Institutional Wall | $82,000 – $82,500 | Devastating confluence: 200-EMA ($82,027) + 200-SMA ($82,455). Site of recent historic rejection. | Very Low |
| Psychological Pivot | $80,000 | Daily close reclaim = immediate bearish momentum cancellation, probable Short Squeeze trigger. | Moderate |
| CME Gap & Fibonacci 0.5 | $79,000 – $79,123 | Major algorithmic price magnet. 50% Fibonacci retracement. Likely test. | High |
Critical Support Zones
| Zone | Price (USD) | Justification | Resilience |
|---|---|---|---|
| Current Battleground | $78,000 – $78,400 | True Market Mean ($78,200) + STH Cost Basis ($78,400). On-chain profitability frontier. | Precarious |
| Bear Flag Invalidation | $76,500 | Break = chartist confirmation of bearish continuation. | Moderate |
| Bottom-Fishing Stronghold | $75,000 – $75,700 | 128-DMA + deep institutional support. Massive algorithmic defense expected. | Very High |
| Capitulation Zone | $73,000 – $74,000 | Deep structural floor. Entry would shift the narrative from « cyclical correction » to « systemic macro deleveraging. » | Last Major Barrier |
| Absolute Historical Support | $56,851 | Base of the original rally. Ultimate capitulation level in a black swan macro event. | Last Resort |
🔀 Modeled Directional Scenarios
✅ Bullish Scenario — Bear Trap Invalidation
The constructive thesis rests on the premise of a large-scale Bear Trap engineered by market makers. The non-negotiable prerequisite: firm daily closes sustained above $77,700–$78,000. A resilient floor at this level would mechanically force the buyback of massively accumulated short positions (Short Squeeze), pulling prices toward the CME Gap at $79,123, then toward the pivotal $80,000 psychological level. Full bullish reversal validation would then require a high-volume breakout above the $82,000–$82,500 confluence, theoretically opening the path to $87,273 and ultimately toward the quantitative target of $115,000 modeled by certain funds based on post-halving supply shock dynamics.
❌ Bearish Scenario — Capitulation & Systemic Deleveraging
The macro environment remains the primary risk vector: CPI at 3.8%, 30-year Treasury yields above 5.1%, crude oil above $105, and net ETF outflows of $268.5M. A confirmed daily close below $77,700 would invalidate the profitability of all recent holders, triggering panic selling cascades driven by prospect theory and loss aversion. The immediate target would be $76,500 (Bear Flag confirmed), followed by a free-fall toward the $75,000–$75,700 stronghold. If global Risk-off sentiment intensifies — particularly via a severe Nasdaq sell-off given the 0.7 correlation — Bitcoin would plunge toward the structural floor of $73,000–$74,000, officially marking the beginning of a macro-driven structural devaluation cycle that could extend through the entirety of Q3 2026. The ultimate capitulation target is modeled at $56,851.
⚠️ Disclaimer: This article is written for exclusively educational and informational purposes. It does not constitute investment advice, a recommendation to buy or sell digital assets, or any solicitation to invest. Cryptocurrency markets are highly volatile and carry a risk of total capital loss. Only invest what you can afford to lose, and consult a licensed financial advisor before making any investment decision.

