
Bitcoin is navigating a structurally complex transition phase in February 2026. Since its all-time high of $126,272 in October 2025, the asset has shed more than 45%, now trapped in a critical range between $67,000 and $68,000. This comprehensive analysis dissects the macroeconomic dynamics, market microstructure, and key technical levels that will determine BTC’s trajectory in the weeks ahead.
1. Macroeconomic Environment: Historic Headwinds
Supreme Court Ruling and Bitcoin’s Idiosyncratic Resilience
On February 20, 2026, the U.S. Supreme Court issued a landmark 6-3 ruling invalidating a sweeping portion of the Trump administration’s tariff program — representing approximately $180 billion in annualized trade measures. Chief Justice Roberts’ majority opinion held that the IEEPA did not grant the President constitutional authority to impose tariffs of such scope. Within hours, President Trump retaliated by signing a new executive order imposing a flat 10% global tariff under the Trade Act of 1974 — quickly raised to the statutory ceiling of 15%.
What surprised markets: Bitcoin did not capitulate. After a brief dip toward $66,500, the asset snapped back to $68,000 before settling into an erratic consolidation. This idiosyncratic resilience strongly suggests the market had already priced in the worst macroeconomic scenarios, behaving more as an inelastic liquidity sponge than a reactive speculative asset.
Warsh at the Fed: The End of Rate Cut Hopes
The real headwind is monetary. The appointment of Kevin Warsh — a staunchly hawkish figure — as Fed Chair has obliterated any remaining hope for monetary easing. Market consensus has violently shifted from « rate cuts in March » to « no cuts throughout 2026 », with marginal expectations of additional hikes if tariff-driven inflation takes hold.
In this high-rate environment, Bitcoin — a non-yield-bearing asset — faces a structural disadvantage. Its correlation with physical gold has collapsed below -0.5 over the past 50 sessions, empirically demonstrating that it currently behaves as a liquidity-sensitive risk asset, not a store of value. Firms like Bernstein have made this assessment without ambiguity.
2. On-Chain Dynamics: The Smart Money Exodus
ETF Hemorrhage: $4.8 Billion Evaporated
The primary catalyst of the 2024-2025 bull market — U.S. spot Bitcoin ETFs — has reversed symmetrically into the dominant source of selling pressure. Data shows 12 consecutive trading days of net outflows, with more than $4.8 billion exiting these vehicles. BlackRock’s iShares Bitcoin Trust (IBIT) alone absorbed a historic single-session outflow of $528 million.
This cold, calculated de-risking reflects institutional managers liquidating peripheral exposures in an environment of near-zero macroeconomic visibility, favoring guaranteed real yields over speculative crypto exposure.
Whale Distribution and the Structural Bear Regime
On-chain analysis reveals an aggressive distribution phase by large holders: addresses holding more than 1,000 BTC slashed their holdings by 23,000 BTC (-12%) in January alone. A particularly alarming transfer of 11,000 BTC (~$760 million) to Binance deposit wallets was observed, signaling clear preparation for market liquidation.
The critical metric: BTC’s spot price (~$67,000) now trades below the realized cost basis of the 12-to-18-month holder cohort. Historically, this signal has consistently marked the entry into a structural bear regime — flipping this level from support into crushing overhead resistance, trapping breakeven sellers on every rally attempt.
3. Multi-Timeframe Technical Analysis
Daily Chart: The Death Cross Confirmed
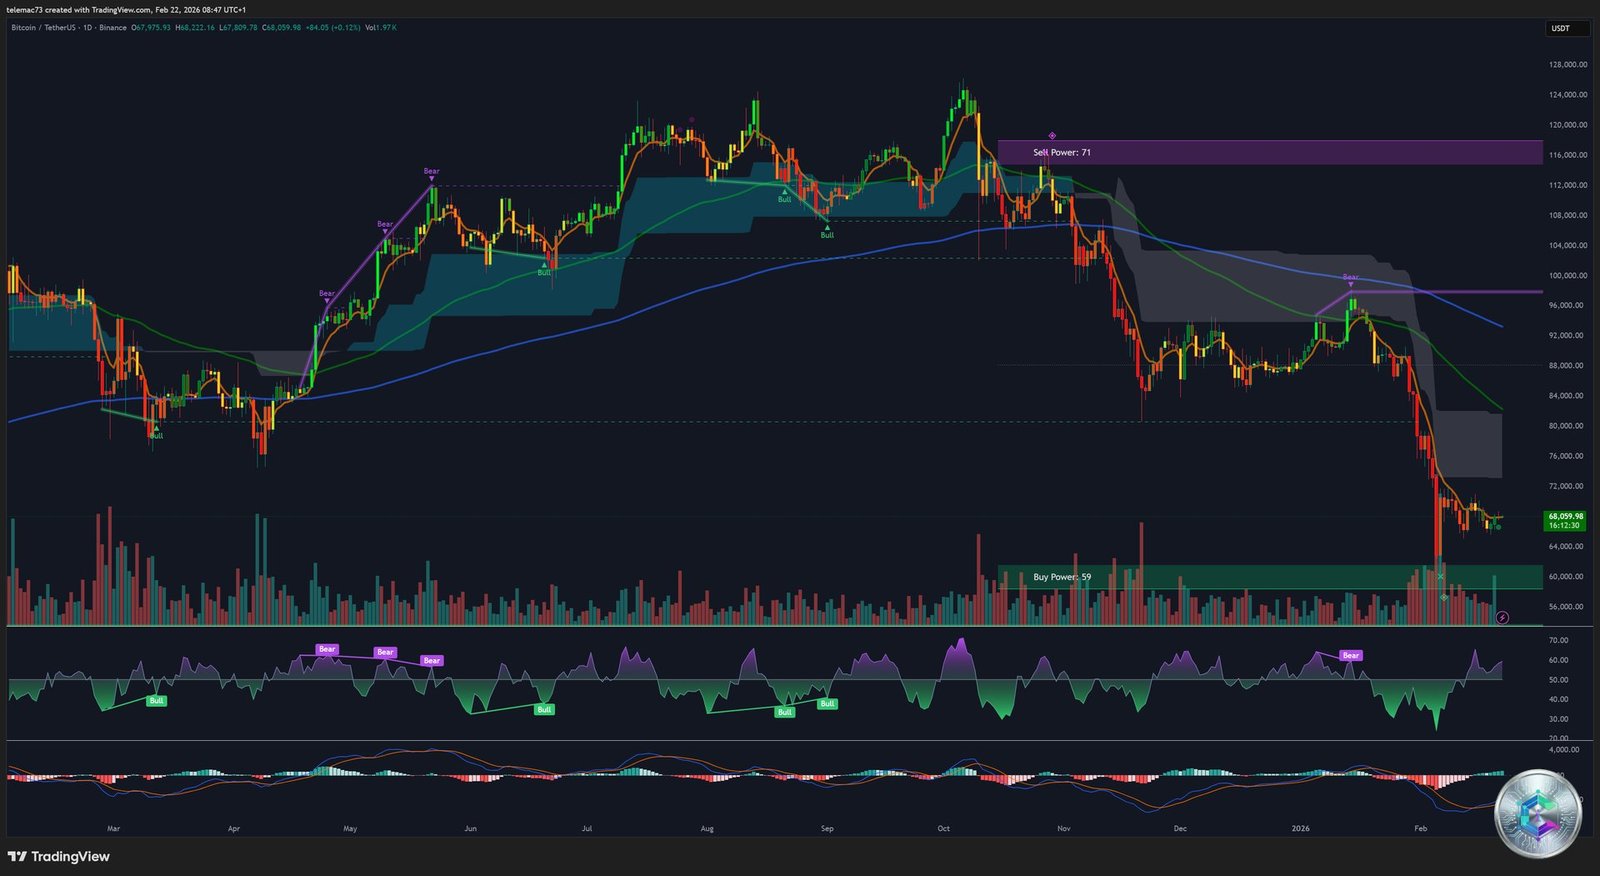
The daily chart shows Bitcoin locked inside a rigid bearish channel, printing a relentless series of lower highs and lower lows. The crossover between the 21-week and 50-week EMA — the feared Death Cross — has explicitly materialized. According to Rekt Capital’s statistical models, this signal invariably precedes an extended macro continuation to the downside. The algorithmic target stands at $49,180. However, an open CME Gap at $84,000 could trigger a violent bear market rally to hunt short liquidity before a renewed leg lower.
4-Hour Chart: WXYXZ Structure and the $68,300 Ceiling
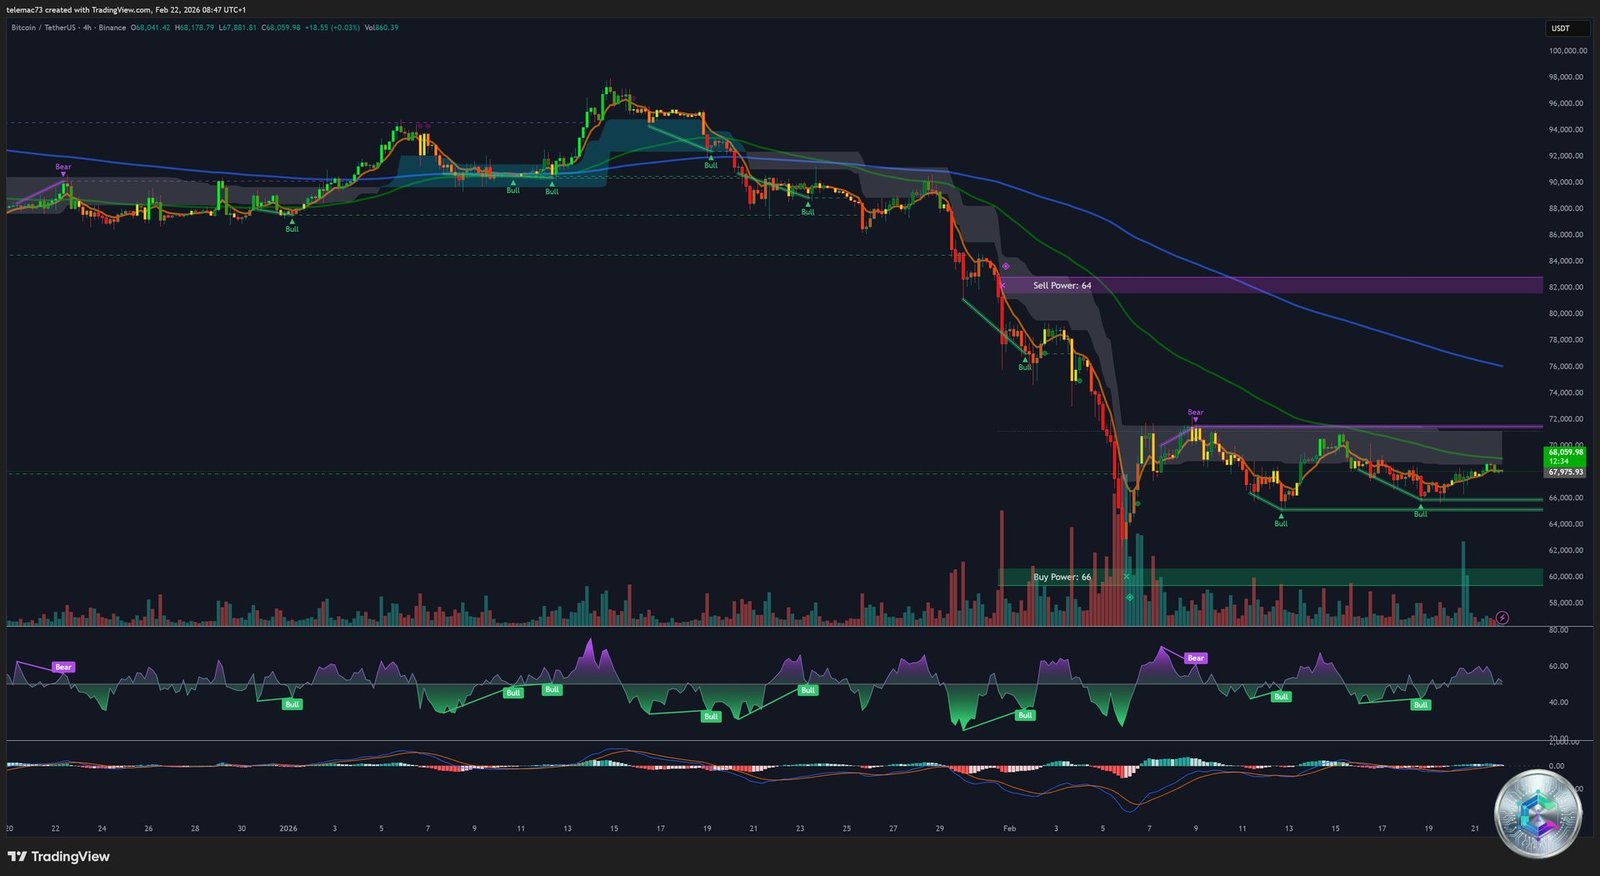
On the 4-hour timeframe, analyst KlejdiCuni identifies the current stagnation (oscillating between $72,250 and $65,170) as a complex corrective WXYXZ structure — an interlocking series of zigzags designed to exhaust retail traders chasing false breakouts. The temporary pivot rests at $67,400. Bulls’ inability to mount a sustained attack on the $68,300 resistance signals a total void in fresh buying momentum.
15-Minute Chart: Trench Warfare and Near-Zero Volatility
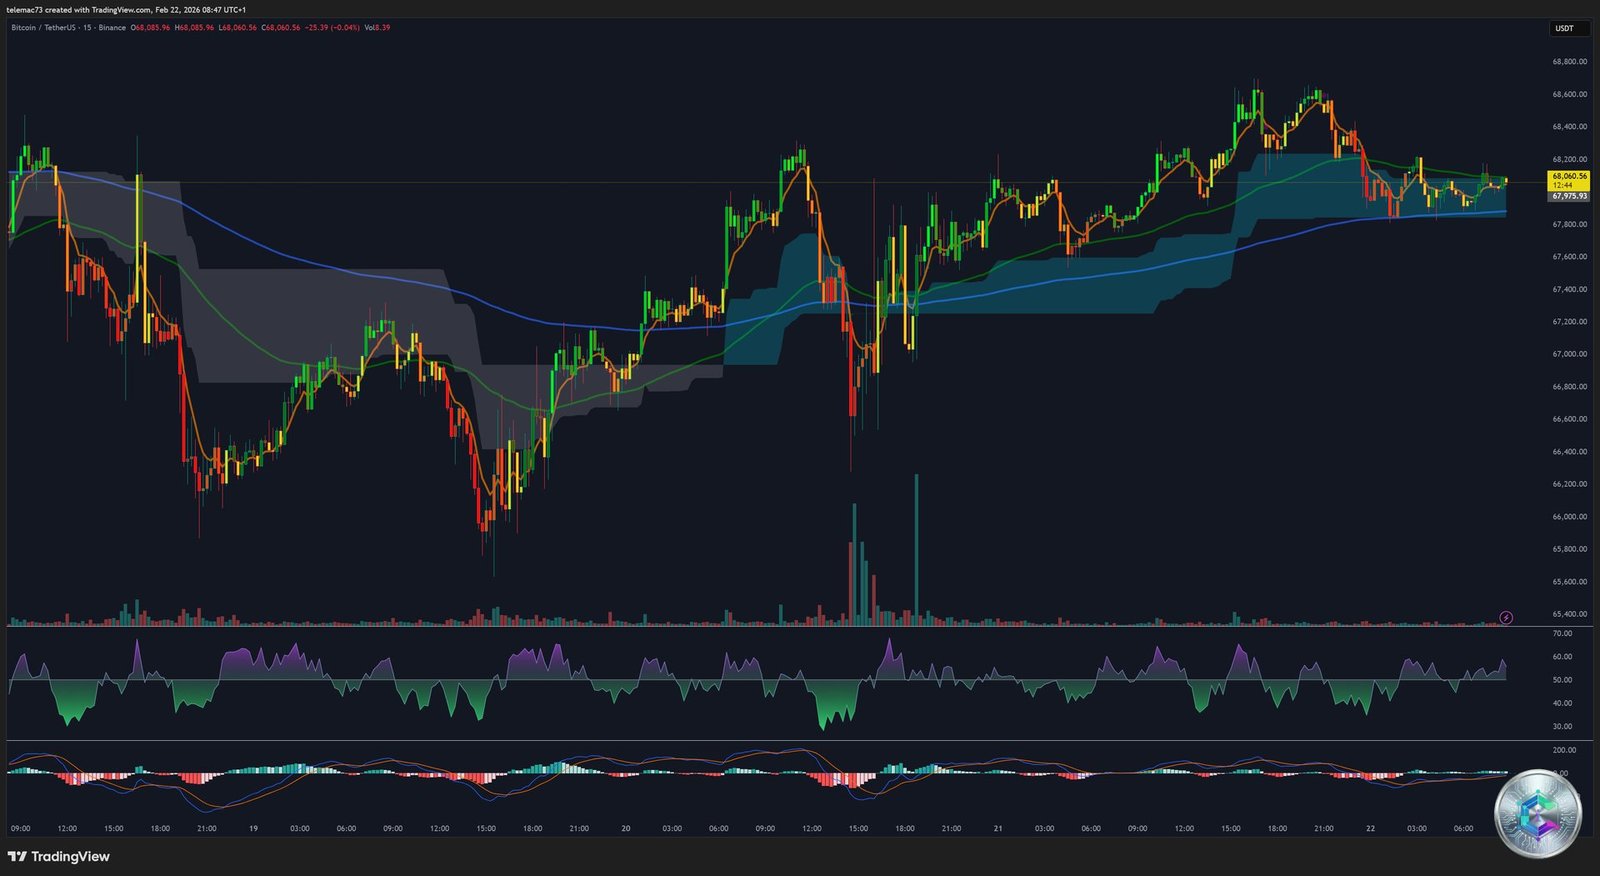
On the 15-minute chart, price is gridlocked inside the Ichimoku cloud around $68,060. Daily volatility has collapsed to a dismal 0.59%. Volume histograms are dramatically flat. The market is coiling, waiting for a fundamental catalyst to detonate the next liquidity event — in either direction.
Liquidity Heatmap: The Order Wall Blueprint
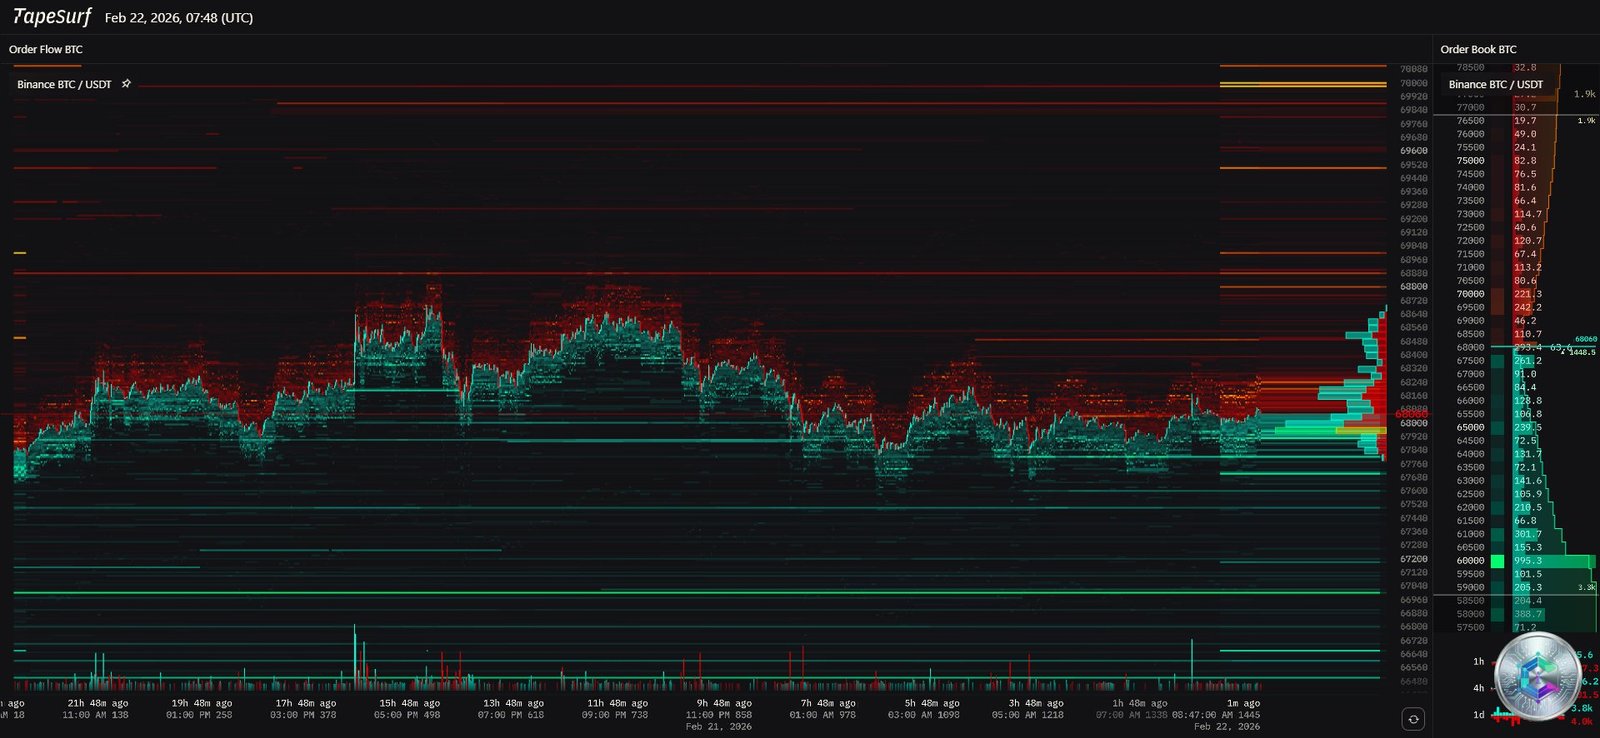
The TapeSurf heatmap exposes a sky heavily loaded with sell orders above current price. The two most prominent liquidity walls sit precisely at $67,400 and $68,160. These levels function as magnetic force fields: a breach of $68,160 would mechanically trigger a cascade of short covering, propelling price higher by a snowball effect. Within a single 24-hour window, $218 million in liquidations were recorded — 77% hitting long positions, with $75 million attributable solely to Bitcoin longs.
4. Strategic Map of Key Levels
| Level | Price (USD) | Nature |
|---|---|---|
| R4 – Absolute Resistance | $84,000 | Open CME Gap – Ultimate magnet for a bear market rally / short squeeze |
| R3 – Regime Pivot | $80,700 | Bull/Bear dividing line – Major macrostructural resistance |
| R2 – Secondary Resistance | $74,400 – $74,800 | Former distribution base – Institutional glass ceiling |
| R1 – Immediate Resistance | $68,160 | Short stop cluster – Short squeeze trigger |
| INTRADAY PIVOT | $67,400 | Current stochastic center of gravity |
| S1 – Near-Term Support | $67,000 | Psychological floor – Daily close below = bearish confirmation |
| S2 – Secondary Support | $65,170 | WXYXZ structure low – Last-chance scalper level |
| S3 – Capitulation Zone | $58,000 – $60,000 | Historical institutional demand zone |
| S4 – Terminal Support | $49,180 | Ultimate algorithmic target of the current purge cycle |
5. Second and Third-Order Risks
The regulatory paradox: The « Clarity Act » championed by Senator Moreno promises the most comprehensive and clear crypto regulatory framework in U.S. history — and the market couldn’t care less. The lesson is stark: positive regulation fails to act as a bullish catalyst when systemic monetary contraction dominates. Liquidity mechanics override legal clarity every time.
The flash crash threat: Order book depth has collapsed from $70 million to just $6 million within a 5% price range — a staggering 90%+ reduction in shock absorption capacity. A single institutional market order could sweep the entire book, triggering a catastrophic flash crash. This structural fragility is precisely why institutional players are paying a 20% options skew premium for downside protection.
The mining industry bifurcation: MARA’s acquisition of Exaion to pivot toward AI compute hosting is not mere diversification — it represents an ontological mutation of the mining sector. If BTC mining margins remain compressed, hashpower may migrate en masse toward AI LLMs, raising profound long-term questions about proof-of-work network security.
Conclusion: Neutrality is the Only Rational Posture
The convergence of macroeconomic, on-chain, technical, and microstructural data paints a coherent picture: Bitcoin is trapped between an implacable monetary contraction and a severely impaired market structure. A sustainable organic recovery requires reclaiming and consolidating above $74,400 and then $80,700, alongside a simultaneous recovery in institutional open interest and order book depth.
Until those conditions are met, technical rallies should be read as distribution opportunities rather than reversal signals. Bearish inertia remains the dominant force, and the algorithmic target at $49,180 stays in scope if current supports give way.
⚠️ Disclaimer: This article is intended for educational and informational purposes only. It does not constitute investment advice or a recommendation to buy or sell any digital asset. Cryptocurrency markets are highly volatile and speculative. All investments carry risk of capital loss. Please consult a qualified financial advisor before making any investment decisions.