
As of February 21, 2026, Bitcoin is trading around $67,850, with a market capitalization of $1.4 trillion within a global crypto market valued at $2.4 trillion. Despite a correction exceeding 45% from its all-time high of approximately $126,000 reached in October 2025, a comprehensive data analysis reveals a striking dichotomy: price action suggests psychological capitulation, while the network’s fundamental infrastructure has never reached such a level of institutional maturity.
🌐 Macroeconomic Framework: Trade War & Monetary Constraint
Bitcoin’s evolution in early 2026 is intrinsically tied to a macroeconomic environment of rare complexity. The U.S. Supreme Court struck down a series of tariffs imposed by the Trump administration — a decision immediately countered by an executive order imposing a blanket 10% global import tariff. These repeated tariff shocks exacerbate inflationary pressures and compress liquidity available for risk assets.
On the monetary front, January 2026 FOMC minutes formally confirmed a pause in the easing cycle. With structurally sticky inflation and U.S. GDP growth slowing to just 1.4% in Q4 2025 (vs. the 2.8% consensus), the specter of stagflation looms. Markets price over 95% probability the Fed holds rates in the 3.50%–3.75% range, creating crushing gravity on Bitcoin as long as short-term Treasury yields remain elevated.
Geopolitically, the threat of armed conflict in the Middle East and a historic Japanese Government Bond (JGB) crash triggered a massive rotation toward safe-haven assets. Gold surged to an all-time high of $4,800/oz, while Bitcoin — still classified as a « high-beta risk asset » in institutional algorithms — faced transitional selling pressure during peak tensions, briefly erasing all its 2026 gains below $60,000.
🏛️ Paradigm Shift: Sovereign & Institutional Adoption
Q1 2026 marks a structurally irreversible inflection point. Three major supply-absorption vectors are fundamentally reshaping market equilibrium:
- U.S. Strategic Bitcoin Reserve: A March 2025 Executive Order officially established a national Strategic Bitcoin Reserve, explicitly recognizing BTC’s absolute scarcity (21 million units) and its role as a « unique store of value in the global financial system. » The entry of a sovereign buyer creates a powerful psychological floor.
- Bond Securitization (ABS): On February 20, 2026, S&P Global Ratings assigned credit ratings to Ledn Issuer Trust 2026-1, an ABS product backed by 4,078.87 BTC (~$357M). This Big Three validation elevates Bitcoin to pristine collateral status alongside real estate and U.S. Treasuries.
- Corporate Treasuries: Mid-cap companies are adopting the « MicroStrategy playbook, » accumulating BTC on their balance sheets and permanently removing supply from circulation.
This combination creates a historically unprecedented supply inelasticity. The next demand shock will meet supply of unparalleled rigidity, setting the stage for explosive price moves to the upside.
🔬 On-Chain Analysis: Cost Basis & Mining Economics
Blockchain data paints the profile of a market in defensive contraction, confined within a corridor defined by two fundamental metrics:
- Realized Price (~$54,900): The aggregate average acquisition cost of the entire market — the ultimate macroeconomic floor during prolonged bear markets.
- True Market Mean (~$79,000): The cost basis of active investors. The breakdown below this level in late January confirmed a medium-term bearish regime shift, with $79,000 now acting as the upper boundary.
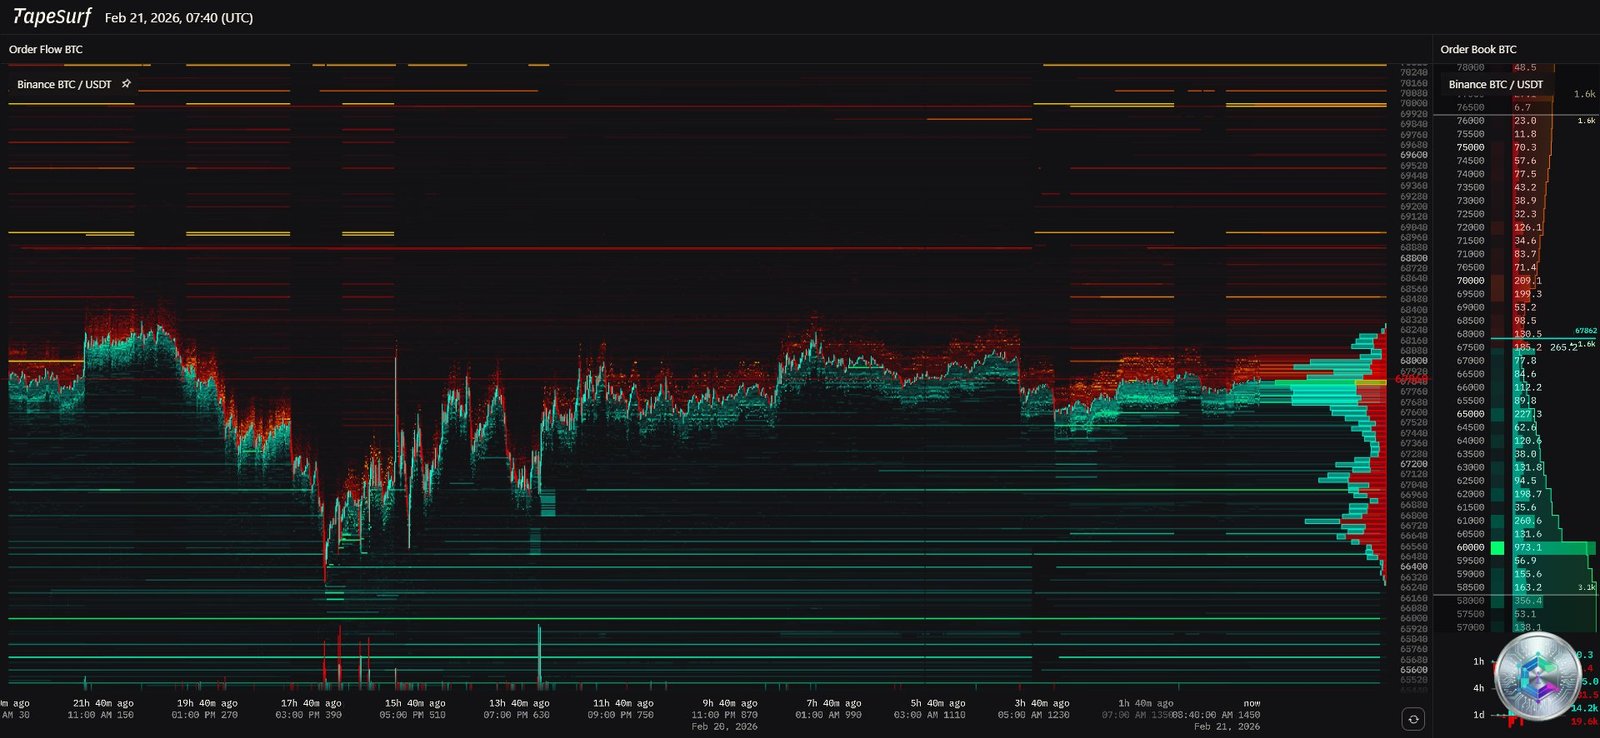
Between these two levels, a massive demand cluster at $60,000–$69,000 — built during the extended H1 2024 consolidation — absorbed the recent capitulation with remarkable conviction. The Accumulation Trend Score (ATS) reads a neutral 0.43, indicating institutional accumulation stagnation without full capitulation.
On the mining side, hashrate sits at a record 969.96 EH/s with a difficulty of 144.40 TH. The Puell Multiple at 0.71 — below the critical 1.0 threshold — signals miners are generating revenues well below historical norms. Historically, a sustained Puell Multiple under 1.0 precedes bear market bottoms: once inefficient miners are purged, structural selling pressure evaporates.
📊 Market Sentiment & Liquidity Profile
The Crypto Fear & Greed Index reads 7/100 — « Extreme Fear » maintained for 22 consecutive days, with a 2026 low of 5 registered in early February. Per contrarian theory, such readings don’t signal fundamental failure — they mark the maximum financial opportunity point via retail capitulation.
The Mayer Multiple at 0.67 mathematically confirms extreme undervaluation: Bitcoin trades at a ~33% discount to its 200-day moving average. Massive capital parked in stablecoins « on the sidelines » awaits any Fed pivot signal to re-enter aggressively.
In derivatives, Open Interest dropped from $90B (October 2025 peak) to ~$49B — a 45% total leverage purge described as orderly deleveraging rather than systemic panic. The Funding Rate has nudged back into positive territory (0.046%), signaling cautious institutional re-entry into long positions.
📈 Multi-Fractal Technical Analysis
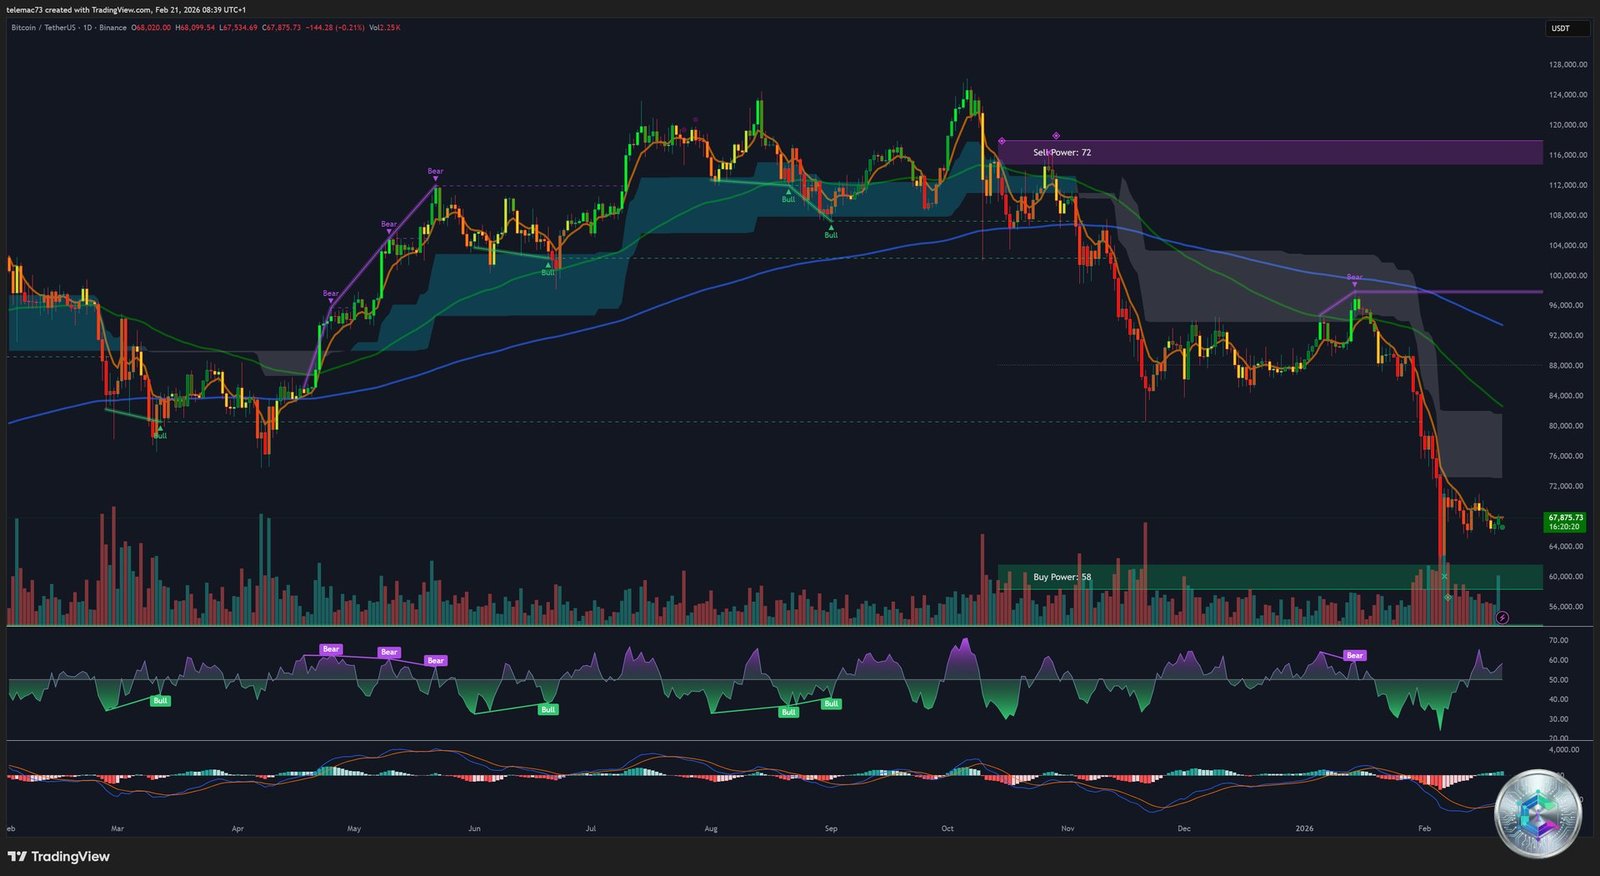
Daily Structure
The daily chart illustrates a classic institutional distribution followed by an abrupt markdown from $120,000+. Sell Power reads 72 vs. a weak Buy Power of 38, confirming bearish control of the macro trend. However, the decline was stopped cold at the $60,000 confluence zone, with long lower wicks — the algorithmic signature of aggressive institutional absorption. EMAs 50 and 200 remain on sharply negative slopes, acting as dynamic resistance barriers.
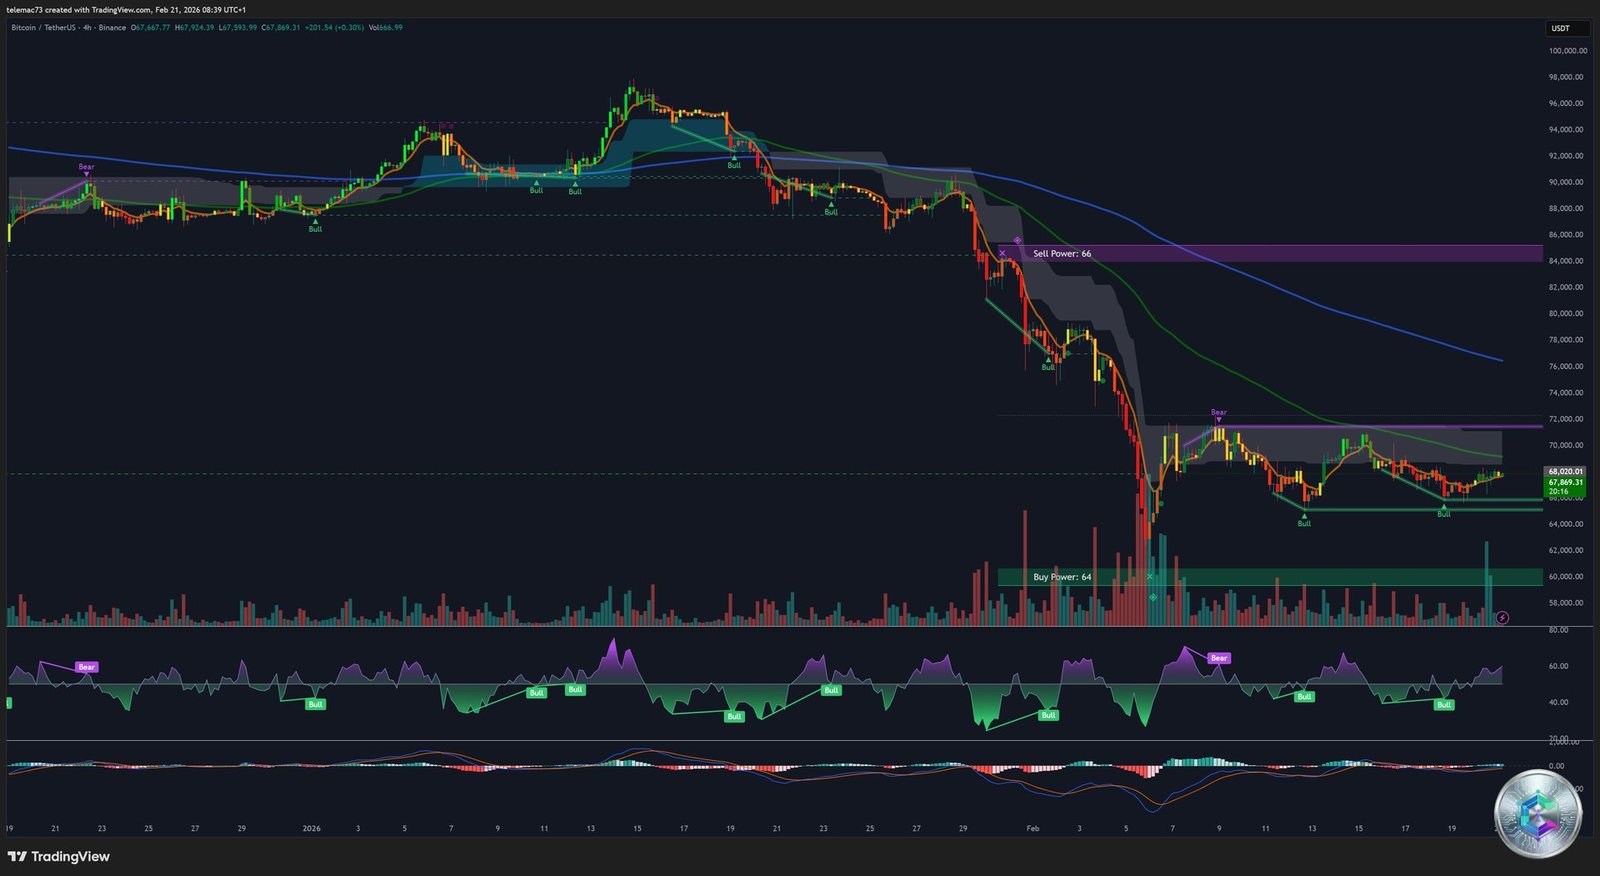
4-Hour Chart — The Falling Wedge
On the 4H timeframe, price action is evolving within a Falling Wedge — a theoretically bullish continuation pattern — with Buy/Sell indicators perfectly balanced (66/64), reflecting total indecision approaching the apex. Two magnetic elements dominate:
- Unfilled CME Gap at $116,050–$119,170 (long-term liquidity magnet)
- Fair Value Gap (FVG) at $112,000–$118,000 if the wedge breaks up; conversely, a bearish break below $107,000 opens the path to the $97,000–$100,000 FVG
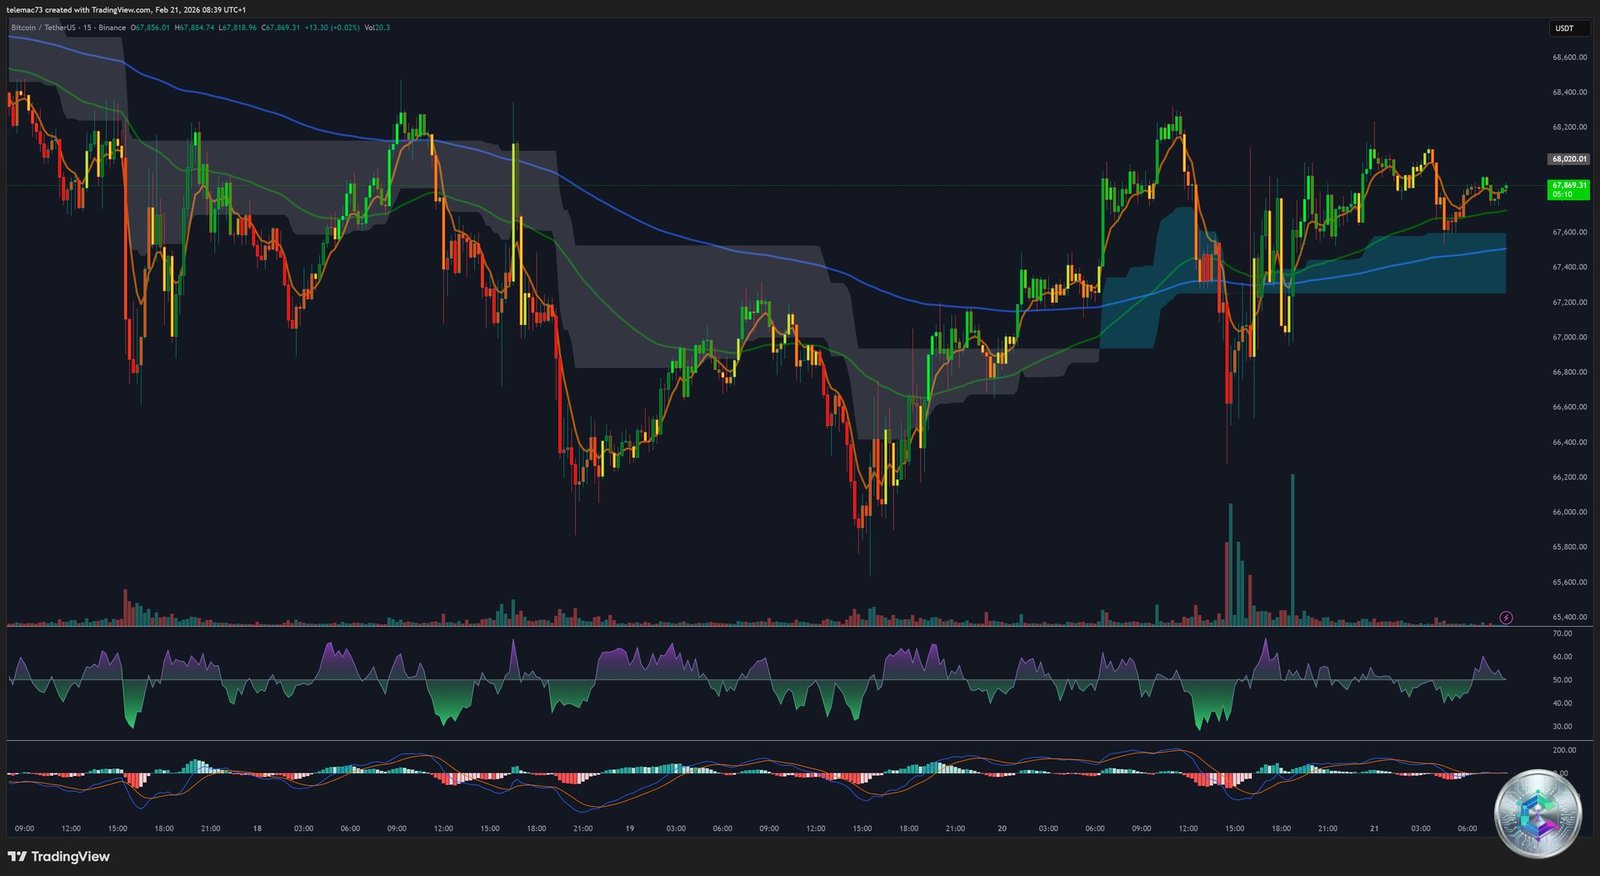
15-Minute Micro-Structure — The Decisive Divergence
On the 15-minute chart, a liquidity sweep below $65,500 was immediately followed by a V-shaped recovery to $67,869 — a classic « Stop Hunt » structure typical of predatory algorithms. On the 1H chart, the most critical technical element of this entire report emerges: a Pronounced Bullish RSI Divergence. While price printed sequential lower lows, the RSI traced higher lows — the mathematical signature of exhausted bearish momentum.
Validation requires a close above $68,000, which would trigger a short squeeze targeting $71,500. Invalidation occurs on an hourly close below $66,000.
🗺️ Key Levels Matrix: Supports, Resistances & Pivots
| Level Type | Price (USD) | Significance |
|---|---|---|
| Macro-Cycle Resistance | $145,000 – $155,000 | Final cycle distribution target via Fibonacci 1.618 extensions |
| Secular Resistance | $100,000 – $103,500 | Validated monthly close = Price Discovery phase + FOMO flood |
| Bull Trap Zone | $92,000 – $95,000 | Massive overhead supply from late-2025 trapped buyers |
| Fundamental Resistance | $79,000 | True Market Mean — regime change boundary |
| Technical Resistance | $71,500 – $72,000 | External liquidity block (short stops + daily moving average) |
| Central PIVOT | $67,936 | AI quant fair value — RSI divergence inflection point |
| Invalidation Pivot | $66,000 | Cancels short-term bullish structure, reactivates bear dominance |
| Short-Term Support | $65,000 | Internal liquidity defended by market maker algorithms |
| Macro Support | $60,000 – $62,000 | H1 2024 demand cluster fortress — held the recent capitulation |
| Ultimate Floor | $54,900 | Realized Price — aggregate cost basis of entire market |
🎯 Strategic Synthesis & Probabilistic Scenarios
Bitcoin is currently in a state of seismic compression, pulled between opposing gravitational forces. Macro headwinds dictate a hostile environment (persistent inflation, monetary pause, geopolitical turbulence), while the institutional infrastructure has never been more robust.
📗 Bullish Scenario
Resolution of the 1H RSI divergence via a volumetric impulse above $67,936 would trigger a short squeeze targeting $71,500. Reclaiming the True Market Mean at $79,000 would certify a return to a macroeconomic bull market. Supply scarcity driven by ABS products and the Strategic Reserve would then pull price toward $92,000–$100,000, paving the way for the final assault on the psychological barrier and ultimate cycle targets of $145,000–$155,000.
📕 Bearish Scenario
A close below $66,000 activates capitulation toward the $60,000 cluster. Should H1 2024 holders liquidate at a loss, the final rampart is the Realized Price at $54,900 — the level that would complete the miner purge cycle (Puell Multiple already distressed at 0.71) before the next secular cycle resurfaces.
⚠️ Disclaimer: This article is written for educational and informational purposes only. It does not constitute investment advice, nor a recommendation to buy or sell any digital assets. Cryptocurrency markets are highly volatile. All investments carry risk, including the total loss of capital. Please consult a licensed financial advisor before making any investment decisions.