
Bitcoin is navigating a critical inflection point on February 18, 2026: extreme volatility compression, divergent institutional flows, and mounting macroeconomic uncertainty are all converging at once. Following its all-time high of $126,080 in October 2025, BTC has undergone a structural correction of nearly 45%, consolidating in a pivot zone between $67,000 and $69,000. This multi-timeframe technical analysis breaks down price dynamics from the 15-minute chart to the daily, incorporating liquidation heatmap data and the current macro-regulatory backdrop.
Market Sentiment Overview
At the open this morning, Bitcoin was trading at $67,341, continuing its persistent consolidation below yesterday’s $68,880 level. The dominant sentiment is one of extreme caution, driven by rising geopolitical tensions and major regulatory headwinds in the United States. Rather than behaving like « digital gold, » BTC is currently acting as a high-risk asset, reacting sharply to global liquidity withdrawals in favor of traditional safe havens like the US dollar and physical gold.
The total crypto market cap stands at $2.36 trillion, up 3.52% over 24 hours — a fragile stabilization following an aggressive distribution phase, one that still lacks conviction in the absence of any clean break above key resistance levels.
| Market Indicator | Value / Status | Observation |
|---|---|---|
| BTC Price (Feb. 18, 2026) | ~$67,341 – $68,800 | Consolidation below resistance |
| February 2026 Performance | -28% (YTD -24%) | Major correction phase |
| Total Crypto Market Cap | $2.36 Trillion | Precarious stabilization |
| Fear & Greed Index | Extreme Fear | Institutional caution |
Multi-Timeframe Technical Analysis
📅 Daily Chart — Long-Term Structure
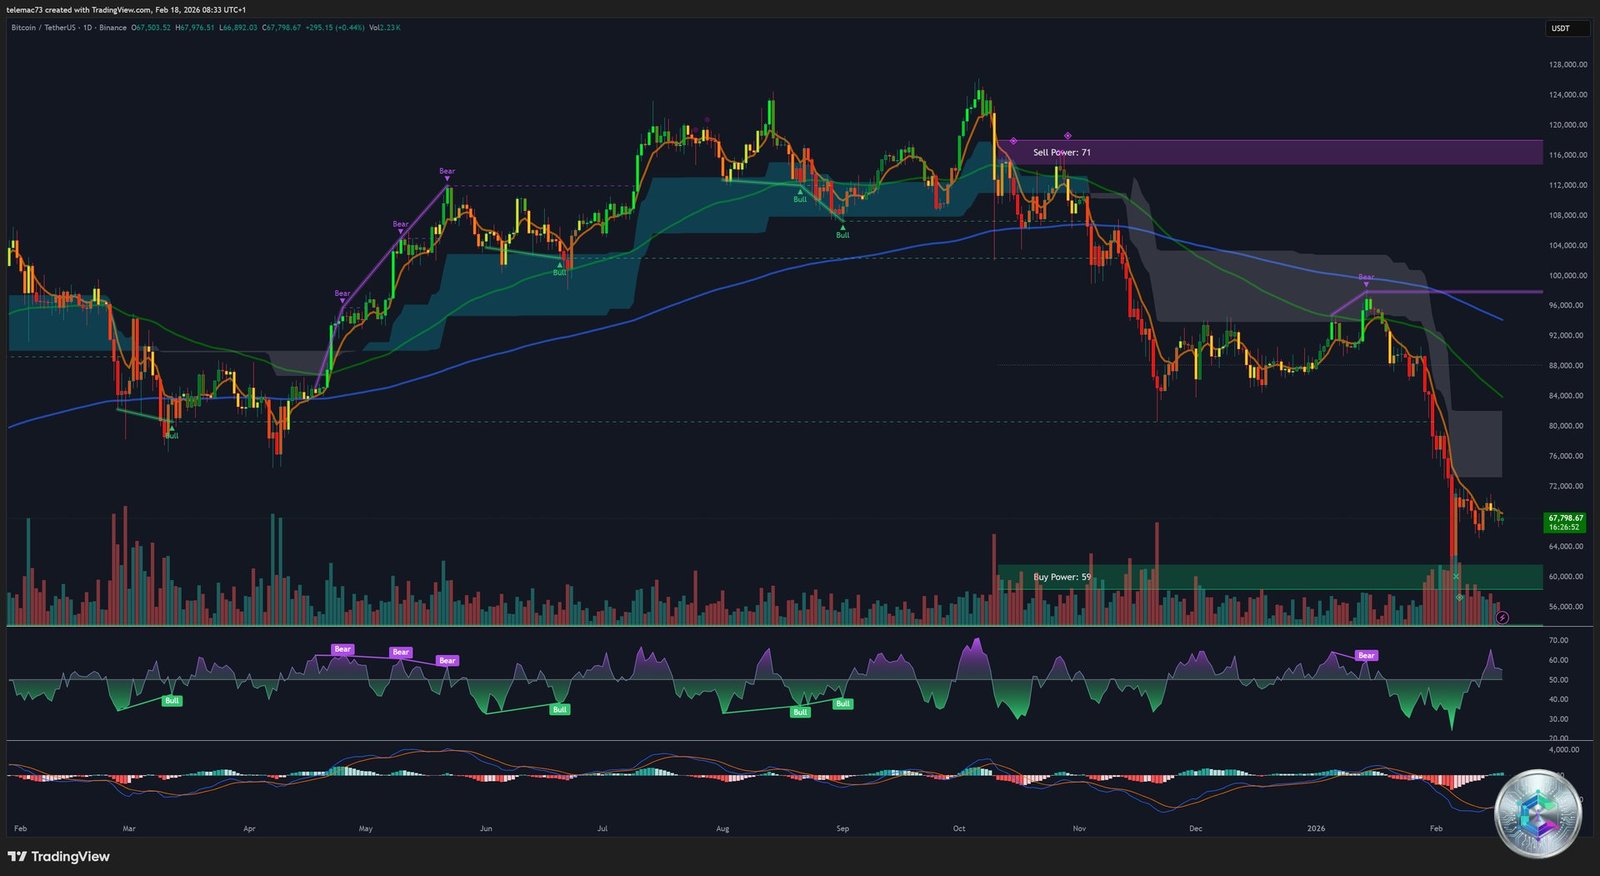
On the daily timeframe, Bitcoin shows clear structural weakness. Price is trading below all major moving averages — EMA 50, 100, and 200 — confirming that sellers are in long-term control. A symmetrical triangle or descending wedge pattern has formed following the drop from the $90,000 region.
The upper boundary of this triangle has rejected three attempts to break above $70,000 since February 5. This zone also aligns with the median line of a multi-month descending channel. The Stochastic RSI on the daily is reaching overbought territory and beginning to roll over — a warning signal for buyers. Conversely, the MACD is showing early bullish crossover signals with green bars appearing on the histogram, offering a glimmer of hope for a technical bounce.
⏱️ 4-Hour Chart — Balance and Indecision
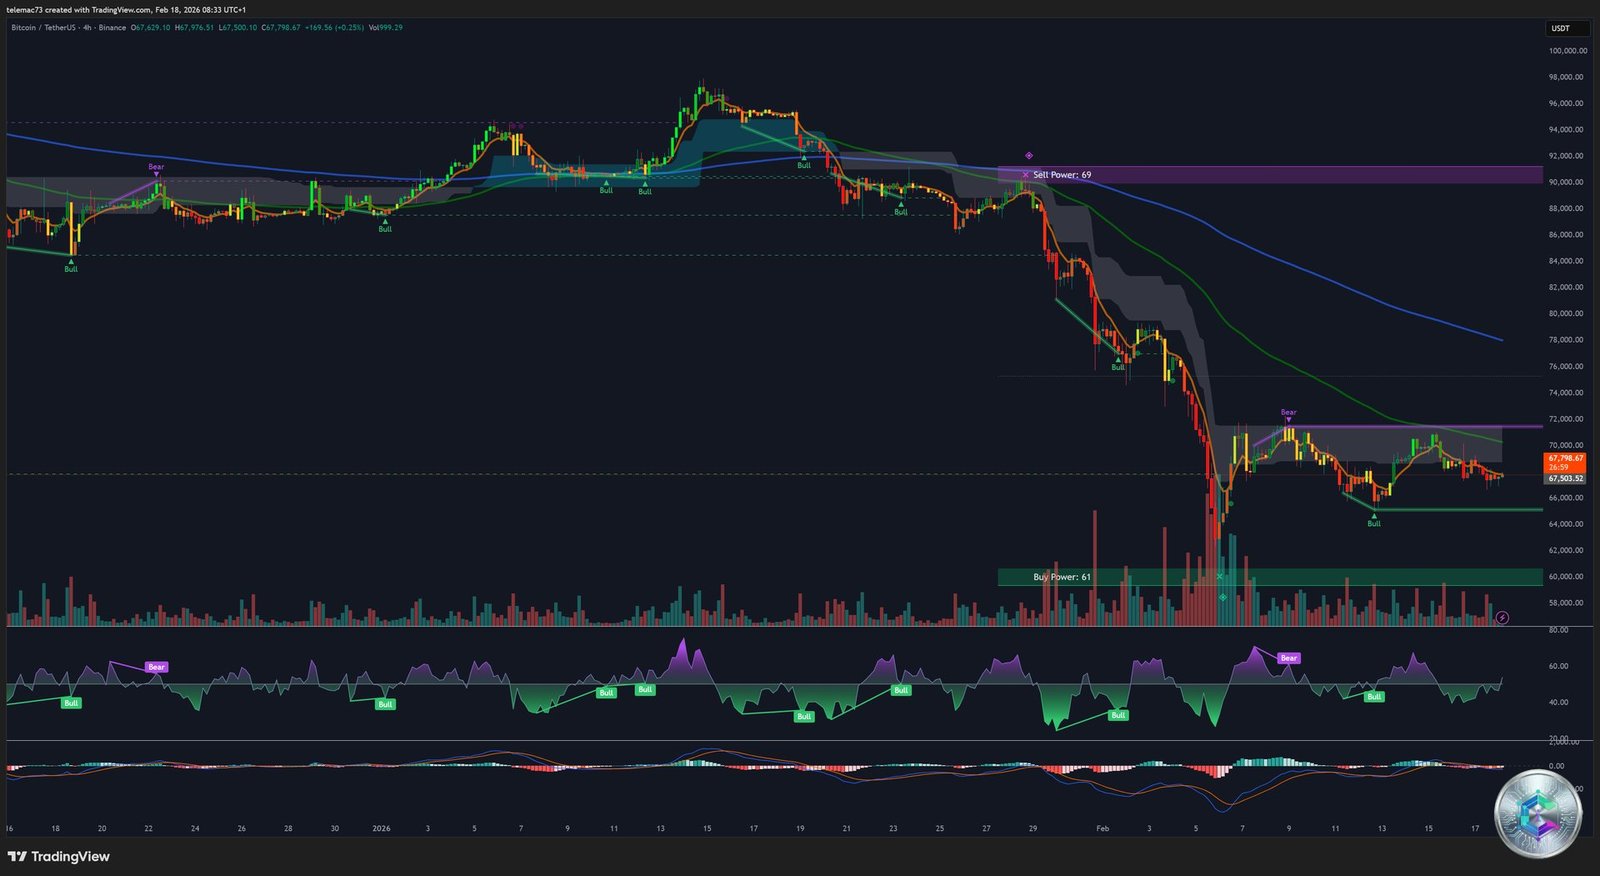
The 4H timeframe reflects a state of near-perfect equilibrium between supply and demand. Price is drifting sideways with declining volume and overlapping candles — neither side is in control of the narrative. The $68,000 – $70,000 range is the immediate pivot zone.
An internal support has formed around $63,000, while $60,000 remains the bulls’ primary line of defense. A confirmed break below the triangle’s lower boundary would target $65,000 and potentially $60,000. Conversely, a daily close above $72,000 would open the path to $79,971.
⚡ 15-Minute Chart — Intraday Dynamics

At the very short end, the 15M RSI is rebounding from oversold levels, signaling the emergence of buying momentum that could push price toward $68,893. The $67,000 support has been tested multiple times and is holding for now, providing a basis for scalping strategies. However, order flow remains fragile — any macroeconomic surprise today could trigger rapid volatility spikes.
| Technical Level | Price (USD) | Type |
|---|---|---|
| Major Resistance | $70,000 – $72,000 | « The Wall, » EMA 50, Channel Top |
| Daily Pivot | $67,804 | Fibonacci equilibrium |
| Immediate Support | $67,000 | Tested intraday support |
| Structural Support | $65,000 | Triangle lower boundary |
| Critical Support | $60,000 | Bulls’ last line of defense |
| Bearish Target | $53,000 – $57,000 | Triangle/flag breakdown measure |
Liquidation Heatmap — Where Is the Powder Keg?
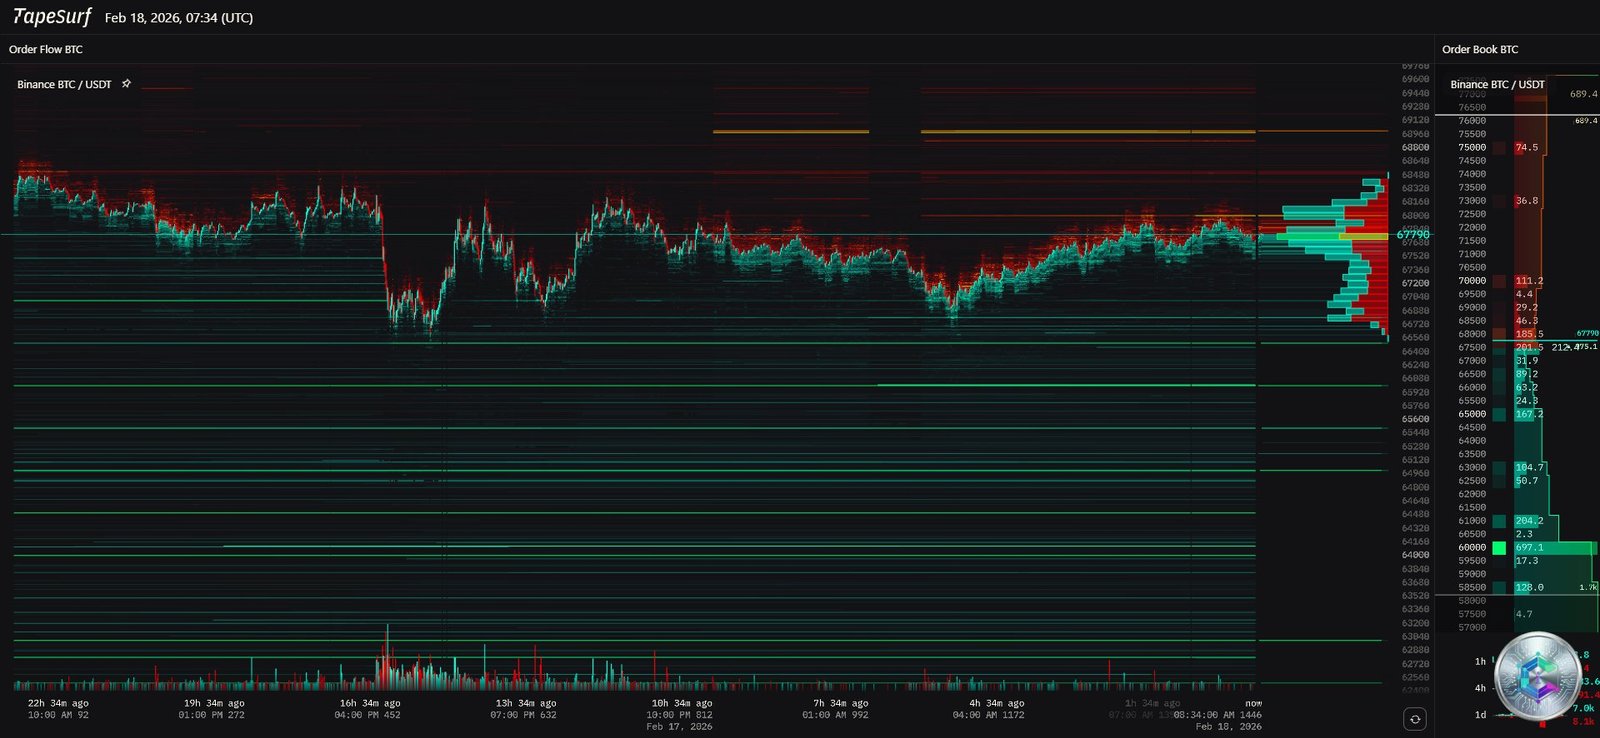
The liquidation heatmap reveals a significant imbalance. A massive cluster of short positions is stacked above current price, concentrated between $78,000 and $82,000, with a possible extension to $85,000. These zones act as price magnets: if Bitcoin breaks $72,000, a cascading short squeeze could propel price to $80,000 without requiring massive spot buying volume.
On the downside, long-position liquidity appears thin all the way down to the $60,000 – $62,000 region. A break below $67,000 could therefore accelerate quickly with minimal mechanical buying support on the way down. CoinGlass and Bitget data confirm that current leverage is skewed to produce sharp moves the moment price exits its narrow current range.
Institutional Dynamics and ETF Flows
The institutional landscape in early 2026 is defined by a striking regional divergence. In the week to mid-February, US-based products saw net outflows of $403 million, while European and Canadian ETFs attracted $230 million in net inflows, with Germany leading at $115 million. European investors are treating the correction as a strategic accumulation opportunity, while their US counterparts are reducing risk exposure.
BlackRock’s iShares Bitcoin Trust (IBIT) continues to dominate the institutional market. Morgan Stanley has filed with the SEC to launch Bitcoin and Solana ETFs. With $8 trillion in assets under management, their entry could significantly expand the investor base. Analysts project 2026 Bitcoin ETF flows between $20 and $70 billion, contingent on price trajectories toward $130,000 – $140,000 by year-end.
Macro Environment and Systemic Risks
🏦 FOMC Minutes — Today’s Key Catalyst
The central event of the day is the release of the January 27-28 FOMC meeting minutes at 2:00 PM ET. A hawkish tone — signaling continued restrictive policy to combat persistent 2.4% inflation — would weigh heavily on risk assets. A dovish tone — hinting at future rate cuts — could stabilize the market and encourage a recovery. These minutes are likely to be the catalyst that forces Bitcoin out of its current symmetrical triangle.
⚖️ Supreme Court and Tariffs
Markets are also watching an imminent Supreme Court ruling on the legality of the Trump administration’s global tariffs (IEEPA). If invalidated, over $133.5 billion in collected duties could be refunded, creating a massive systemic liquidity shock. Prediction markets estimate a 76% probability that the court rules against the administration — a major uncertainty factor for all risk assets.
💰 Treasury Liquidity and the AI Rotation
The US debt refinancing cycle is creating a tight liquidity environment historically unfavorable to crypto between February and April. Adding to the pressure is a notable capital rotation toward AI: Amazon ($200B) and Google ($180B) are absorbing a growing share of available liquidity at the expense of digital assets.
MicroStrategy, Metaplanet, and the Nasdaq Decoupling
MicroStrategy recently acquired an additional 2,486 BTC at an average price of $67,710, but reported a net loss of $42.93 per share in Q4 2025 and an operating loss of $17.4 billion. Metaplanet saw its holdings lose approximately $665 million in market value. These paper losses are creating a negative feedback loop on overall Bitcoin sentiment.
Meanwhile, the historical Bitcoin/Nasdaq correlation is breaking down. While tech stocks are riding the AI wave, Bitcoin has fallen 28% in February. This decoupling suggests BTC is increasingly being perceived as a pure global liquidity and risk appetite indicator, rather than a technology proxy.
Regulatory Landscape — The Clarity Act Stalls
The Digital Asset Market Clarity Act, which aimed to clarify SEC and CFTC jurisdictional boundaries, lost momentum in January 2026. Despite passing the House, Senate consideration was delayed after key industry participants withdrew support from the revised text. This legislative gridlock leaves the market in a legal grey zone. The SEC did however repeal SAB 121 (allowing banks to custody crypto for clients), while the CFTC is advancing the DCIA through the Senate Agriculture Committee. These partial adjustments fall short of comprehensive federal legislation, keeping major institutions in a « wait and see » posture.
Exit Scenarios — Two Paths, One Decision
🟢 Bullish Scenario — Short Squeeze to $82,000
If FOMC minutes signal an upcoming monetary pivot, or the Supreme Court removes tariff uncertainty, Bitcoin could break above the $70,000 resistance. A daily close above $72,000 would trigger the short liquidation cluster identified on the heatmap, propelling price toward $79,971 and potentially filling the CME Gap at $84,600. A resumption of US ETF inflows would reinforce this scenario significantly.
🔴 Bearish Scenario — Capitulation to $50,000
If the Fed reaffirms a « higher for longer » stance or geopolitical tensions escalate, the $67,000 support could give way. A confirmed triangle breakdown below $65,000 would target the critical $60,000 pivot. With thin long-side liquidity on the heatmap below that level, a slide toward $53,000 – $57,000 (bearish flag measured move) or even $50,000 (Standard Chartered’s identified floor) cannot be ruled out.
Conclusion
Bitcoin stands at a major inflection point. The technical structure reveals a market exhausted by a 45% correction, yet one whose $60,000 – $67,000 support base is being vigorously defended by European and long-term institutional investors. The $70,000 resistance and $67,000 support provide clear guideposts for the sessions ahead.
The heatmap suggests explosive upside potential thanks to trapped shorts, but that move will depend entirely on macro and regulatory catalysts unlocking. Watch the FOMC minutes at 2:00 PM ET closely — they are likely to be the trigger that finally breaks Bitcoin out of its symmetrical triangle. Rigorous risk management remains imperative in this high-tension environment.
⚠️ Disclaimer: This article is published for educational and informational purposes only. It does not constitute investment advice or a recommendation to buy or sell any digital asset. Cryptocurrency markets are highly volatile and past performance is not indicative of future results. Always invest with caution and only risk funds you can afford to lose. Consult an independent financial advisor before making any investment decisions.