
The digital asset market is navigating a major structural transition in mid-February 2026. After reaching a cyclical peak above $109,000 in October 2025, Bitcoin endured a complex and severe correction, culminating in a critical support test at the start of the month. Saturday, February 15, 2026 marks a psychological turning point as Bitcoin successfully reclaimed the $70,000 threshold — a level that acted as a polarity pivot throughout the previous year. This recovery, while fragile, unfolds against a macroeconomic backdrop characterized by faster-than-expected US disinflation, contrasting with massive Bitcoin ETF outflows and a Fear & Greed Index firmly entrenched in Extreme Fear.
🌐 Macroeconomic Environment and Fundamentals
Bitcoin’s price action during the second week of February 2026 was largely dictated by the release of the US Consumer Price Index (CPI). Data published on February 13 revealed annual inflation of 2.9%, slightly below consensus forecasts of 3.0%. This deceleration — the slowest since March 2021 — suggests that the Federal Reserve’s monetary policy, maintained at a neutral rate near 4.25%–4.50%, is beginning to exert real deflationary pressure on the economy. For risk assets like Bitcoin, this trend cuts both ways: it reinforces hopes of near-term rate cuts, but also signals an economic slowdown that could weigh on global liquidity.
Non-Farm Payrolls (NFP) surprised to the upside with 143,000 new jobs versus a forecast of 170,000, though prior month revisions subtracted approximately 59,000 jobs from the cumulative total. This « bad economic news = good news for rates » dynamic allowed Bitcoin to bounce from lows near $62,000 to reach $70,000 on February 15. Additionally, the correlation between Bitcoin and the S&P 500 has significantly declined, now approaching zero — a sign of decoupling between traditional finance and the digital asset sector in a de-risking environment.
| Macro Indicator | Observed Value | Forecast | Market Impact |
|---|---|---|---|
| Annual CPI | 2.9% | 3.0% | 🟢 Bullish (Relief Rally) |
| Core CPI | 3.2% | 3.3% | ⚪ Neutral |
| NFP (Jobs) | 143,000 | 170,000 | 🟡 Mixed |
| Unemployment Rate | 4.0% | 4.1% | ⚪ Neutral |
| Fed Rate (Target) | 4.25–4.50% | 4.25% | 🔴 Restrictive in real terms |
On the institutional front, the landscape is marked by significant capitulation among ETF holders. Since November 2025, more than $6 billion has flowed out of spot Bitcoin funds, including nearly $500 million in the second week of February alone. Standard Chartered lowered its year-end 2026 price target to $200,000, down from $300,000 previously, citing deteriorating macroeconomic conditions. Nevertheless, signs of accumulation persist among « whales » — cohorts holding between 100 and 1,000 BTC represent a growing share of activity, suggesting large investors are quietly absorbing supply from panicking retail participants. The announcement of Bitcoin national reserve projects in Brazil and the upcoming integration of crypto trading on Platform X (formerly Twitter) inject long-term structural optimism.
📊 Multi-Timeframe Technical Analysis
⏱️ 15-Minute Chart – Micro-Trend and Scalping

On the 15-minute timeframe, Bitcoin shows signs of volatility compression following the CPI-driven impulsive surge. Price has formed a series of falling wedges — a consolidation pattern that typically suggests continuation of the preceding bullish trend in the very short term. The intraday pivot sits near $67,500, a level that held as support during the volatility tests of February 14.
Bollinger Bands are tightening on this timeframe, often a precursor to a violent directional expansion. The RSI (14 periods) oscillates around the 52–55 zone, reflecting a temporary equilibrium between supply and demand. Immediate liquidity is concentrated just above $71,000 — the 7-day high — whose breach could accelerate the move toward the next resistance level.
🕓 4-Hour Chart – V-Shaped Recovery and Critical Moving Averages

The 4-hour timeframe is arguably the most revealing for swing trading. Bitcoin completed a V-shaped recovery pattern after touching a multi-month low below $62,000. This recovery was temporarily halted by the confluence zone between $68,000 and $70,000, which includes the 200-week Exponential Moving Average (EMA 200W) at $68,000 and the former 2021 All-Time High at $69,000.
Volume on this timeframe showed significant spikes during buy-back phases, reaching $28 billion in 24-hour volume during the initial bounce. To confirm the validity of this recovery, buyers must maintain support at $65,000–$66,000. A break below this level would invalidate the higher lows structure and could force a retest of the massive liquidations positioned near $60,000.
📅 Daily Chart – Descending Channel and Long-Term Trend

On the daily timeframe, Bitcoin remains confined within a multi-month descending channel that began after the October 2025 peak. The recent rejection near $70,000 corresponds to the median line of this channel, reinforcing its importance as a major distribution zone. Technically, price still trades below its 20, 50, and 100-day moving averages — respectively near $76,000, $82,000, and $88,000 — suggesting a mean reversion phase rather than the beginning of a new parabolic run.
The break below the 365-day moving average is a rare technical event — the last precedent dates back to March 2022. Historically, such a breakdown precedes months of consolidation or a bear market. However, the Mayer Multiple, currently below 1.0, suggests Bitcoin is in a historically significant accumulation zone where long-term returns are statistically very favorable.
| Technical Indicator | Timeframe | Level | Signal |
|---|---|---|---|
| RSI (14 periods) | Daily | ~38 | 🟡 Approaching oversold |
| EMA 200 Weeks | Weekly | ~$68,000 | 🔴 Resistance to reclaim |
| Realized Price (On-chain) | — | ~$62,000 | 🟢 Ultimate floor support |
| EMA 20 Days | Daily | ~$76,000 | 🔴 Strong trend resistance |
| Daily Pivot Point | Daily | $67,500 | ⚪ Immediate support |
🔥 Liquidity Heatmap and Derivatives Flow
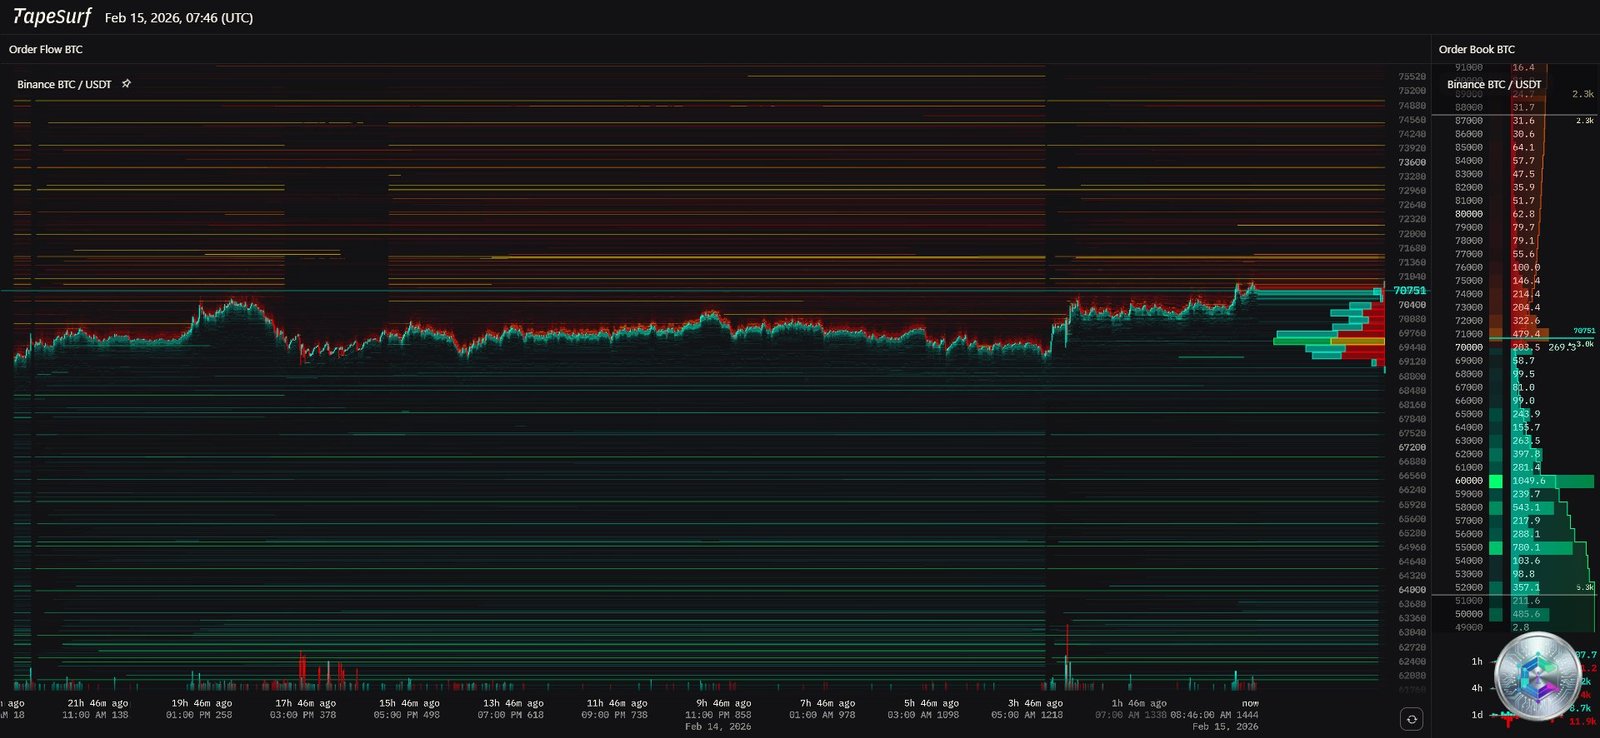
Understanding the current price dynamic requires analyzing liquidity zones — where forced liquidation orders are most densely concentrated. Binance’s Liquidation Heatmap for February 2026 reveals a market in a « sandwich » state, compressed between massive clusters of both short and long positions.
📈 Short Liquidation Clusters (Sellers)
To the upside, an extremely dense concentration of short-side liquidity sits between $78,000 and $82,000, with an extension up to $105,000–$110,000. A clear break above the psychological resistance of $72,000 could act as a detonator, triggering a cascade of forced buybacks (short squeeze) that would rapidly propel prices toward the $78,000–$82,000 zone.
📉 Long Liquidation Clusters (Buyers)
To the downside, the market already underwent a significant purge of over-leveraged long positions during the drop below $65,000. A new cluster of buy positions has nonetheless formed between $60,000 and $65,000. Market makers often use these zones as « fuel » for their stop-hunting algorithms before initiating a move in the opposite direction. Open Interest on futures contracts has recovered to approximately $24 billion, but remains well below the $34 billion seen in January — signaling a market less vulnerable to a systemic crash, but also lacking the conviction for an immediate recovery.
| Price Level | Estimated Liquidity Volume | Risk Nature |
|---|---|---|
| $105,000–$110,000 | 🔴 Very High | Cyclical short squeeze target |
| $78,000–$82,000 | 🟠 High | Immediate squeeze zone |
| $70,000–$72,000 | 🟡 Moderate | Sell order wall (Asks) |
| $63,700–$65,000 | 🟡 Moderate | Buy-side liquidity support (Bids) |
| $60,000–$62,000 | 🟠 High | Final capitulation zone |
😨 Market Sentiment and Investor Psychology
On February 15, 2026, the Crypto Fear & Greed Index registers a value between 15 and 20 out of 100 — firmly in « Extreme Fear » territory. Historically, such levels of despair — comparable to those seen during the FTX collapse or the 2022 crash — often mark cycle lows or major buying opportunities for institutional investors.
Current investor psychology is shaped by several stress factors:
- The trauma of a ~50% drawdown from the 2025 peak, invalidating the narrative of Bitcoin quickly reaching $200,000.
- ETF uncertainty — once perceived as an infinite source of demand, ETFs have become vectors of selling pressure during de-risking phases.
- Institutional losses: Coinbase reported losses of hundreds of millions in Q4 2025, and major funds are carrying significant unrealized losses on their crypto positions.
Yet this atmosphere of capitulation is contradicted by the activity of « strong hands. » The proportion of Bitcoin supply held by Long-Term Holder (LTH) entities has not shown a drastic decline, suggesting that current selling originates primarily from participants who entered during the 2024–2025 growth phase. Metcalfe’s fair value model estimates Bitcoin’s intrinsic price at approximately $62,000, indicating that the recently tested level is very close to the network’s fundamental value.
🎯 Key Support, Resistance, and Strategic Pivot Levels
🟢 Support Levels (Buying Zones)
The first line of defense is the $65,000–$66,000 zone, which served as a floor during the February 5 crash and as a recent bounce area. A failure to hold this level would send price toward the major support of $60,000–$62,000, corresponding to the February 6 low and the 200-week Simple Moving Average (SMA). Below that, the liquidity void extends toward approximately $62,000 (realized price), historically serving as the ultimate floor during prolonged bear markets.
🔴 Resistance Levels (Selling Zones)
Immediate resistance lies at $68,000, where the 15-minute descending wedge meets the 200-week EMA. The psychological threshold of $70,000 is critical — a sustained reclaim of this level is necessary to shift market sentiment from bearish to neutral. Higher up, the $72,000–$75,000 zone represents the first major structural barrier to overcome for a return toward daily moving averages. Finally, the $84,000–$86,000 zone, a former support turned resistance, will act as the ceiling of the current trend.
⚖️ Pivot Points and Reversal Levels
| Level Type | Price (USD) | Technical Significance |
|---|---|---|
| 🔴 Major Resistance (R3) | ~$76,000 | 20-Day EMA |
| 🟠 Short Squeeze Resistance (R2) | $78,000–$82,000 | Massive short cluster |
| 🟡 Pivot Resistance (R1) | $69,000–$70,000 | 2021 ATH / Psychological pivot |
| ⚪ Intraday Pivot | $67,500 | Price center of gravity |
| 🟢 Immediate Support (S1) | $65,000 | Local consolidation low |
| 🟢 Panic Support (S2) | $60,000–$62,000 | Long-side liquidity cluster |
| 🟢 Cycle Support (S3) | ~$62,000 | Realized Price / 200-week SMA |
🔭 Conclusion and Forward Outlook
Bitcoin finds itself in a « bottoming » configuration that is testing the patience of investors. The reclaim of $70,000 on February 15, 2026 is an encouraging signal that validates the thesis of a local bottom near $62,000. This recovery is fueled by improving US macroeconomic conditions and the quiet accumulation of long-term institutional players.
However, the overall technical structure remains degraded. The loss of the 365-day moving average and the fierce resistance at the $68,000–$70,000 zone suggest the market could enter a prolonged sideways consolidation phase, oscillating between $62,000 and $80,000 for the remainder of the quarter. If Bitcoin manages to hold above its 200-week EMA at $68,000, the probability of a massive short squeeze toward $82,000 and beyond increases considerably before the end of February. Conversely, any renewed sign of macroeconomic weakness could force a fresh purge toward the $60,000–$62,000 fundamental support.
In this environment of « extreme fear, » caution remains warranted. But on-chain data and historical valuation indicators suggest that the phase of maximum distress may be nearing its end, paving the way for a slow but solid market reconstruction.
⚠️ Disclaimer: This article is written exclusively for educational and informational purposes. It does not constitute investment advice, nor a recommendation to buy or sell digital assets or any other financial instrument. Cryptocurrency markets are highly volatile and carry the risk of total loss of capital. Any investment decision should be made after consulting a licensed financial advisor and taking into account your personal situation. Only invest what you can afford to lose.