
The Bitcoin market is undergoing a major reconfiguration phase in early 2026. After reaching historical highs in October 2025, the world’s leading cryptocurrency has experienced a significant correction, stabilizing around the psychological pivot of $95,000. This in-depth analysis examines market structures, key technical levels, and the macroeconomic environment shaping BTC’s current trajectory.
Macroeconomic Context: The Fed Transition
The major event conditioning Bitcoin’s trajectory in February 2026 is the nomination of Kevin Warsh to succeed Jerome Powell as Federal Reserve Chairman. This decision by the Trump administration acted as a powerful deleveraging catalyst, triggering an immediate reassessment of risk assets.
Financial market reactions were marked by rising 10-year Treasury yields, strengthening of the dollar (DXY), and a concomitant drop in traditional safe-haven assets. During this stress phase, Bitcoin behaved more like a high-beta asset correlated with global liquidity rather than as a safe haven.
Technical Analysis on Daily Chart
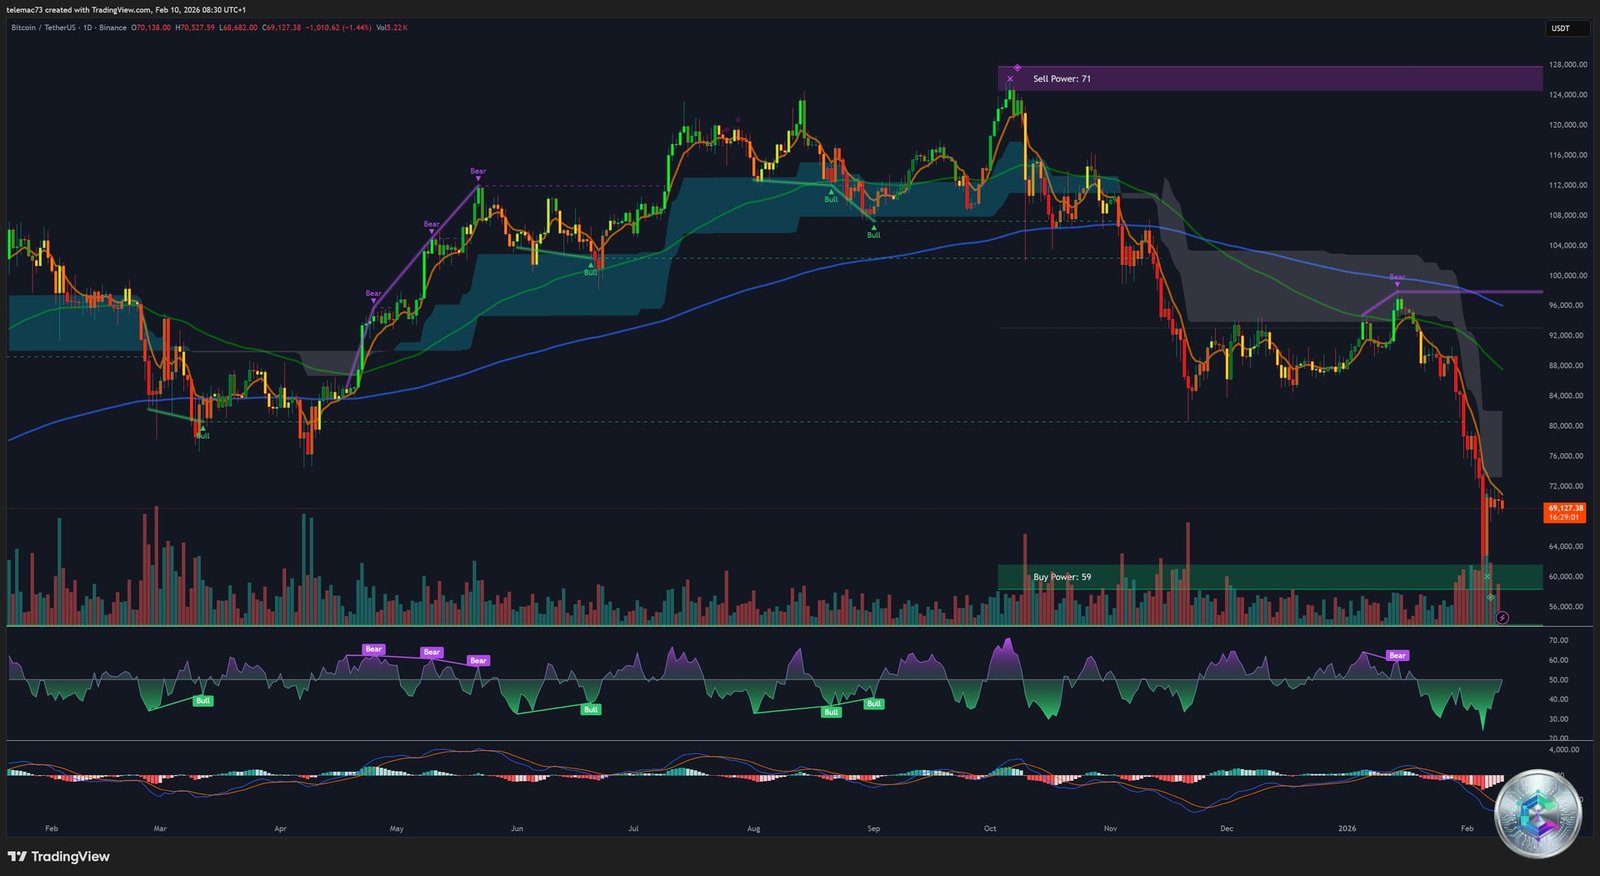
On the daily timeframe, Bitcoin has technically entered a bear market after falling more than 20% from its peak. The trend is heavily bearish, with price trading well below its 50 and 200-day moving averages. Fibonacci retracements from the previous bullish move reveal critical support zones.
Daily Fibonacci Support Levels:
- 0.236 Zone: $96,700 – This zone represents the first line of immediate defense.
- 0.382 Zone: $91,600 – Intermediate support, historically significant in major corrections.
- 0.5 Zone: $86,900 – Psychological equilibrium point, corresponding to the 200-day moving average.
- 0.618 Zone: $82,100 – Golden ratio retracement zone, last rampart before capitulation.
The daily RSI is in deep oversold territory, suggesting potential for a short-term technical bounce, though no durable reversal signal is confirmed.
4-Hour Structure: Accumulation or Capitulation?

The 4-hour chart reveals a consolidation structure within a narrow range between $94,000 and $97,000. This volatility compression, after several weeks of continuous decline, could precede a significant directional move.
Current 4H Pivot Points:
- Central Pivot Point: $95,300
- Resistance R1: $97,850 – First technical resistance zone
- Resistance R2: $100,400 – Critical psychological threshold
- Support S1: $92,750 – Immediate support zone
- Support S2: $90,200 – Major support
The volume profile shows significant accumulation in the $93,000-$96,000 zone, suggesting possible redistribution before the next major move. Momentum indicators (MACD, Stochastic) remain downward-oriented but show signs of bullish divergence.
Short-Term (15 Minutes): Tight Trading Range
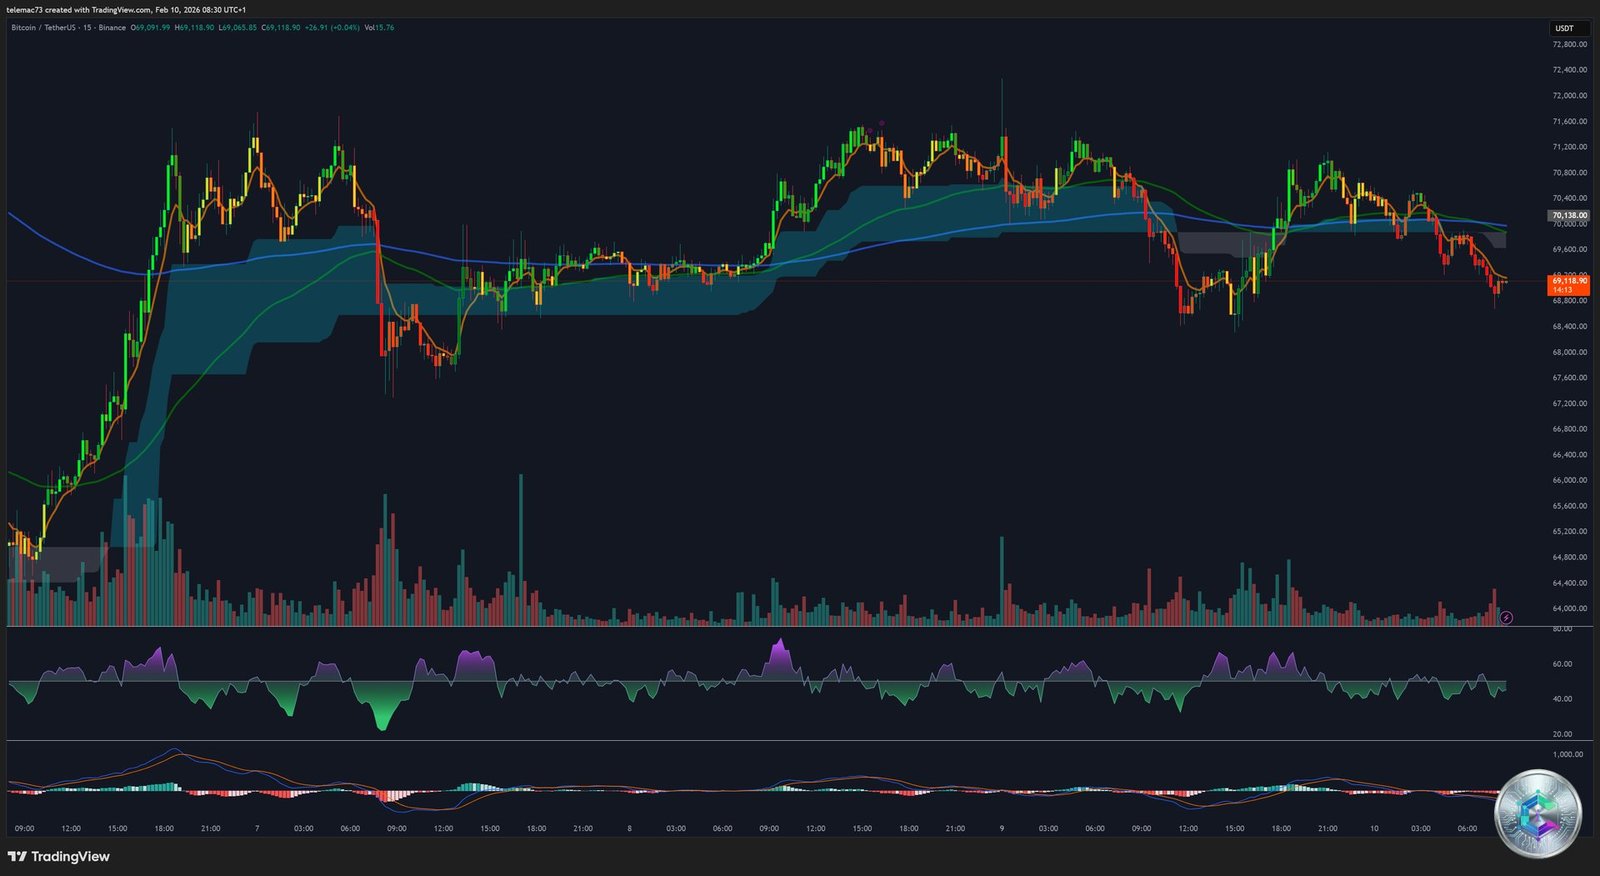
On the 15-minute timeframe, Bitcoin is trading in a very tight range, typical of low volatility phases preceding explosive moves. Intraday traders should closely monitor breakout levels around $96,500 (resistance) and $94,500 (support).
Trading volumes have significantly decreased, dropping from daily averages of $45 billion to approximately $28 billion, signaling widespread indecision. This liquidity compression increases the probability of a violent move within the next 48-72 hours.
Liquidity Flow Analysis

Liquidity flow analysis via on-chain data reveals massive outflows from spot Bitcoin ETFs, totaling over $2.1 billion in January 2026. This institutional hemorrhage reflects increased risk aversion in a context of monetary uncertainty.
However, on-chain metrics paradoxically show accumulation by « whales » (wallets holding over 1,000 BTC), suggesting a divergence between traditional institutional investors and long-term accumulators.
Key Macroeconomic Indicators
Several major economic indicators are weighing on market sentiment:
- ADP Private Employment: 77K additions (vs 150K expected) – Signal of labor market cooling
- 10-Year Treasury Rate: 4.52% – Pressure on non-yielding assets
- Dollar Index (DXY): 108.5 – Testing major resistance
- January CPI: Publication expected February 13 – Determining factor for monetary policy expectations
Probable Technical Scenarios
Bullish Scenario (Probability: 35%)
Confirmed break above $97,850 with volume, potentially triggering a short squeeze toward $102,000-$105,000. This scenario would require a positive fundamental catalyst (favorable CPI data, dovish Fed pivot).
Neutral/Consolidation Scenario (Probability: 40%)
Continuation of trading range between $92,000 and $98,000 for 2-3 additional weeks, awaiting macroeconomic clarification. Optimal strategy: range trading with tight stops.
Bearish Scenario (Probability: 25%)
Break of $92,750 support opening the path to lower Fibonacci zones at $86,900 and potentially $82,100. This scenario would be activated by deteriorating global liquidity conditions.
Strategic Recommendations
For Short-Term Traders:
- Favor range trading with quick profit-taking
- Monitor $96,500 (resistance) and $94,000 (support) levels for breakouts
- Reduce leverage during low volatility periods
- Wait for volume confirmation on breaks
For Medium/Long-Term Investors:
- Consider staggered entries in Fibonacci support zones ($91,600, $86,900)
- Maintain conservative allocation (max 20-30% of crypto portfolio)
- Favor DCA (Dollar Cost Averaging) during this uncertainty phase
- Don’t underestimate the risk of additional correction toward $80,000
Conclusion
Bitcoin stands at a critical technical and fundamental crossroads. The current volatility compression, combined with an uncertain macroeconomic context, suggests that a major directional move is looming in the coming weeks. The $92,000-$94,000 support zone represents a crucial battleground between buyers and sellers.
Traders must exercise patience and discipline, waiting for clear confirmations before taking significant positions. The current environment favors a prudent approach and rigorous risk management.
Disclaimer: This technical analysis is presented for educational and informational purposes only. It does not constitute financial investment advice in any way. Cryptocurrency markets are extremely volatile and carry substantial risks of capital loss. Always conduct your own research and consult a qualified financial advisor before making any investment decisions. Past performance does not predict future results.