
Bitcoin is currently navigating a critical phase of its market cycle, marked by deep correction and unprecedented institutional deleveraging. After reaching an all-time high above $100,000 in October 2025, the flagship cryptocurrency stabilized around $95,000 in early February 2026, even testing the psychological threshold of $92,000 during a week of extreme volatility.
An Unfavorable Macroeconomic Context
The financial landscape of early 2026 is characterized by a brutal questioning of risk assets. Bitcoin, once considered a decoupled « digital gold, » now behaves as a high-beta liquidity indicator, evolving in close correlation with American technology sectors experiencing massive selling pressure.

The Kevin Warsh Effect and the Fed
The nomination of Kevin Warsh to the Federal Reserve chairmanship represents a determining factor in the current bearish pressure. Markets interpret this choice as a signal toward stricter monetary policy, particularly regarding the reduction of the Fed’s balance sheet (Quantitative Tightening). This perspective triggers a global liquidity contraction, eliminating the main driver of speculative asset appreciation such as cryptocurrencies.
Multi-Timeframe Technical Analysis
15-Minute View: Intraday Volatility

On the 15-minute chart, we observe a tense consolidation structure with marked volatility spikes. Moving averages converge, suggesting a period of indecision before a more pronounced directional movement. Volumes remain moderate, indicating market anticipation before key economic releases.
4-Hour View: Correction Structure
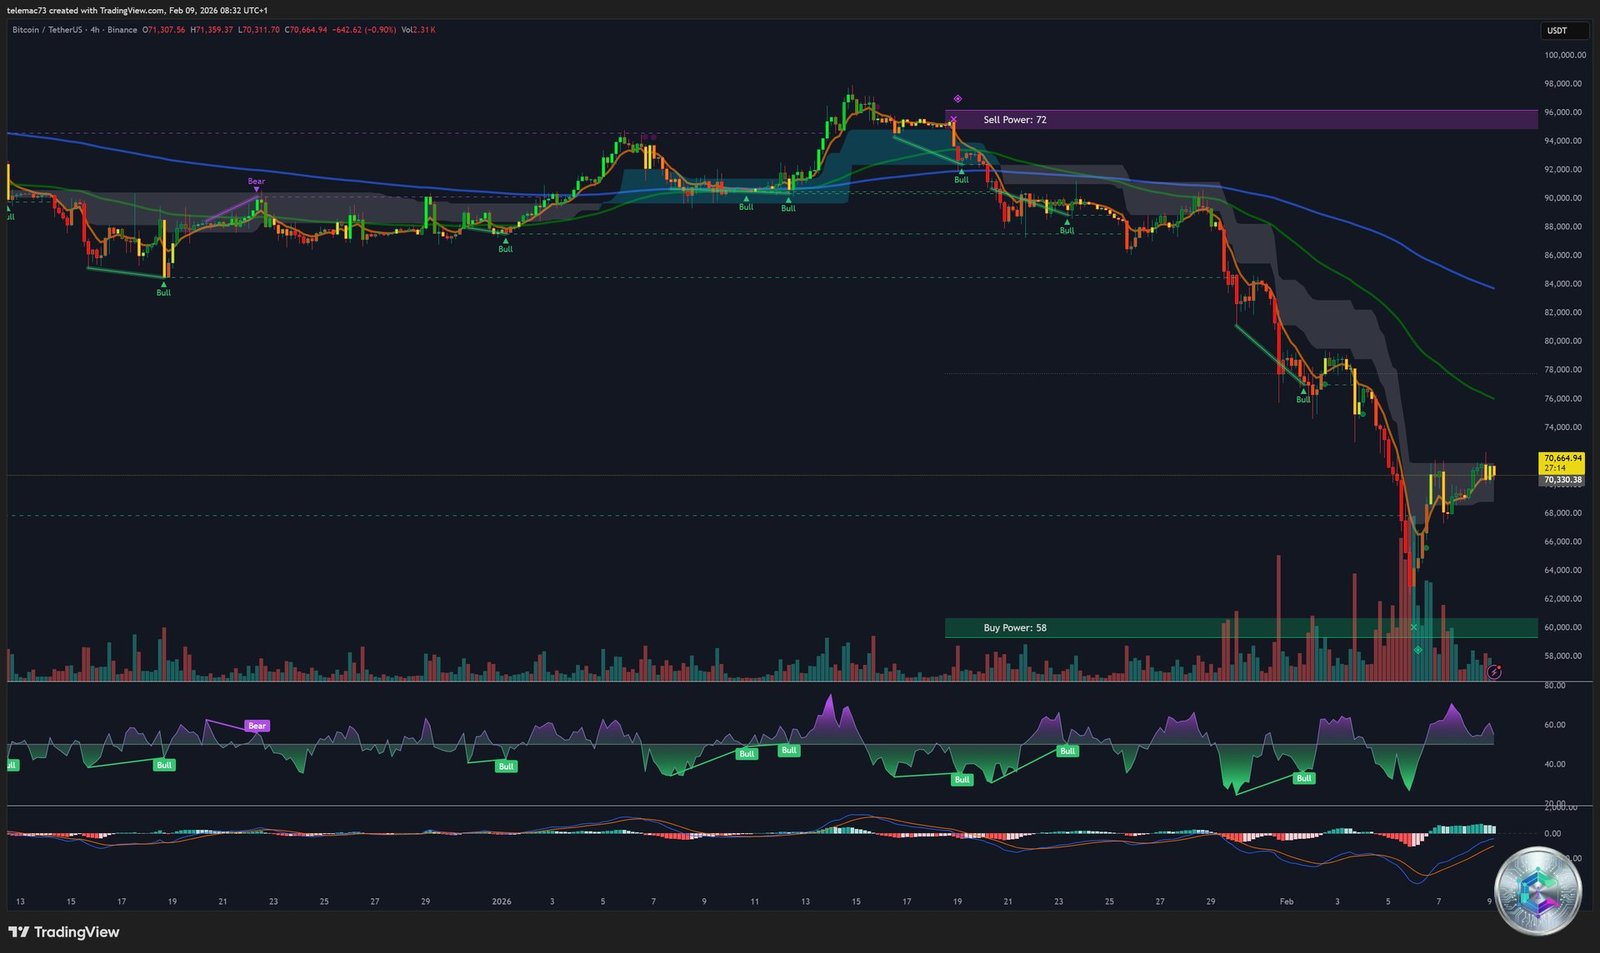
The 4-hour chart reveals a clear bearish trend with a series of descending lows. Price evolves below key exponential moving averages, confirming seller dominance. Technical rebounds remain limited and quickly sold, testifying to sustained institutional selling pressure.
Daily View: Testing Critical Supports
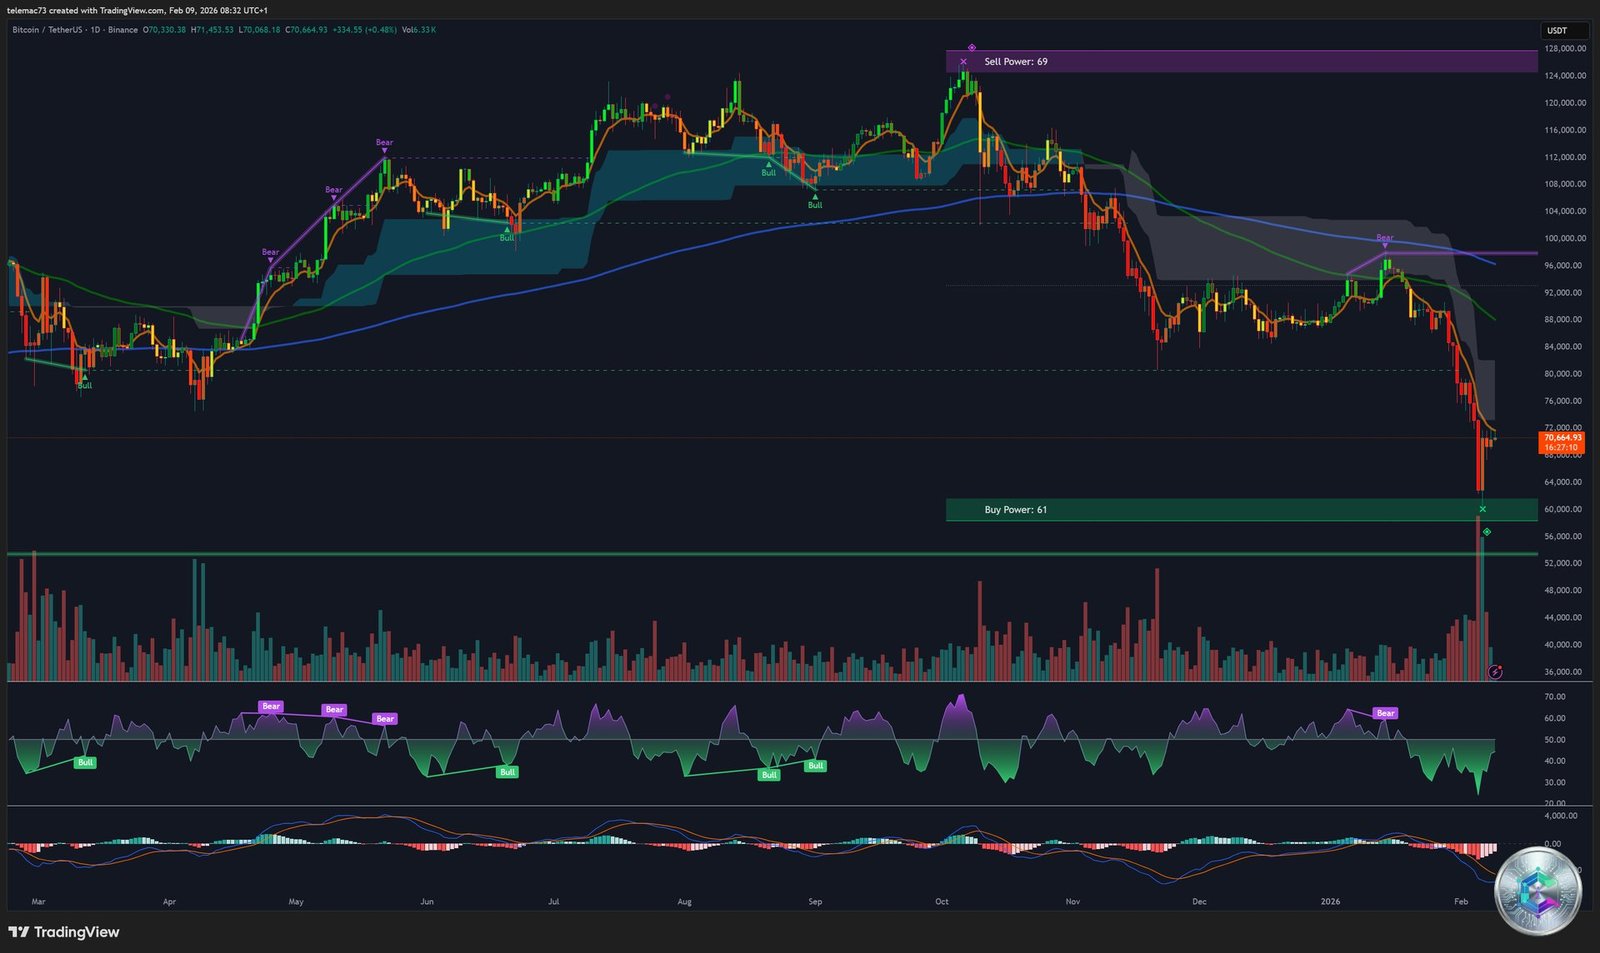
Daily analysis shows Bitcoin oscillating around historical support zones. The $92,000 – $95,000 level constitutes a critical zone where significant past trading volumes concentrate. A decisive break of this zone could open the path toward lower bearish targets, while maintaining above would consolidate the base for a potential rebound.
Weekly View: Long-Term Perspective

The weekly chart places the current correction in a broader perspective. After losing nearly 50% from its October 2025 peak, Bitcoin stands at a major technical crossroads. Momentum indicators show potential bullish divergence, suggesting that a final capitulation could be near, paving the way for a new medium-term bullish cycle.
Heatmap Analysis

The liquidity heatmap reveals significant concentrations of leveraged long positions above current levels, creating a technical resistance zone. Conversely, support levels below concentrate less liquidity, suggesting a risk of sharp movements in case of bearish breakdown.
Institutional Dynamics
The current correction is accompanied by significant institutional deleveraging. Spot Bitcoin ETFs, launched with fanfare in early 2024, experience sustained capital outflows, reflecting asset managers’ repositioning amid macroeconomic uncertainty. On-chain data also shows a decrease in active addresses and declining transaction volumes, typical signals of an extended consolidation phase.
Short-Term Catalysts
The week of February 9-15, 2026 concentrates several major economic releases that could catalyze a strong directional move:
- Retail Sales (February 10): Measure of US consumer resilience
- Non-Farm Payrolls NFP (February 11): Major determinant for Fed decisions
- Consumer Price Index CPI (February 13): Assessment of inflation persistence
- Jobless Claims (February 12): Real-time indicator of labor market health
This compressed data creates whipsaw volatility risk for leveraged positions, with potential for violent movement in both directions depending on published results.
Prospective Scenarios
Bearish Scenario: A breakdown below $92,000 with disappointing economic data could trigger acceleration toward the $85,000 – $88,000 zones, where the next major supports lie. This configuration would require final capitulation of long positions before entering a new reconstruction phase.
Bullish Scenario: Better-than-expected economic data combined with holding above $92,000 could trigger a relief rally toward $100,000 – $102,000. This recovery would be technically justified by extreme oversold conditions and bullish divergence in momentum indicators.
Neutral Scenario: Extended consolidation between $92,000 and $98,000 remains the most likely short-term scenario, with range-trading dominated by algorithms and market-makers awaiting greater macroeconomic clarity.
Conclusion
Bitcoin finds itself at a pivotal moment in its evolution, confronting powerful macroeconomic headwinds while also reaching valuations that are becoming attractive from a risk-reward perspective. The key lies in the market’s ability to absorb institutional selling pressure and rebuild a solid technical base around current levels.
The coming days will be crucial in determining whether we’re witnessing a final capitulation or the beginning of a new accumulation phase. Caution remains advisable for short-term traders, while long-term investors might see a gradual accumulation opportunity within a multi-year cycle perspective.
Disclaimer: This article is provided for informational and educational purposes only. It does not constitute investment advice, a buy or sell recommendation. Cryptocurrency markets are extremely volatile and carry significant risks of capital loss. Always conduct your own research and consult a professional financial advisor before making any investment decisions.