
Bitcoin faces a critical period marked by extreme fear and a major test of resilience. As of February 4, 2026, the price stands at $76,350, marking a significant decline and highlighting a striking dichotomy between growing infrastructural adoption and short-term price dynamics disconnected from traditional markets.
Macroeconomic and Geopolitical Context for 2026
The global financial ecosystem is undergoing an unprecedented phase of reconfiguration. The de-dollarization phenomenon, once relegated to marginal theory, has become tangible reality as BRICS bloc nations now represent over 40% of global GDP.
However, this ambition collides with brutal market realities: Bitcoin’s intrinsic volatility, illustrated by an 11% decline in January 2026 alone, complicates its adoption as a stable value standard by central banks. Current instability is fueled by a series of « risk-off » catalysts: partial US government shutdown, renewed trade tensions, rising Japanese government bond (JGB) yields, and escalating geopolitical frictions.
Market Capitalization and Dominance Status
| Indicator | Value on 04/02/2026 | Context |
| BTC/USD Price | $76,350 | Decline from $78,740 |
| Total Crypto Capitalization | $2.67 Trillions | Relative stagnation |
| BTC Dominance | 57.29% | Hegemony maintained |
| Fear & Greed Index | 14 (Extreme Fear) | Capitulation sentiment |
| 24h Volume | $187.2 Billion | High activity |
Bitcoin maintains robust dominance of 57.29%, affirming its status as the sector’s barometer, even as Ethereum and altcoins face greater selling pressure.
Multidimensional Technical Analysis
Daily Chart Structure: Critical Fibonacci Breakdown
Bitcoin’s daily chart displays major structural deterioration. After 2025 peaks, the asset entered an accelerated correction phase in early 2026. A particularly alarming technical signal is the decisive break of the Fibonacci extension at $76,150.
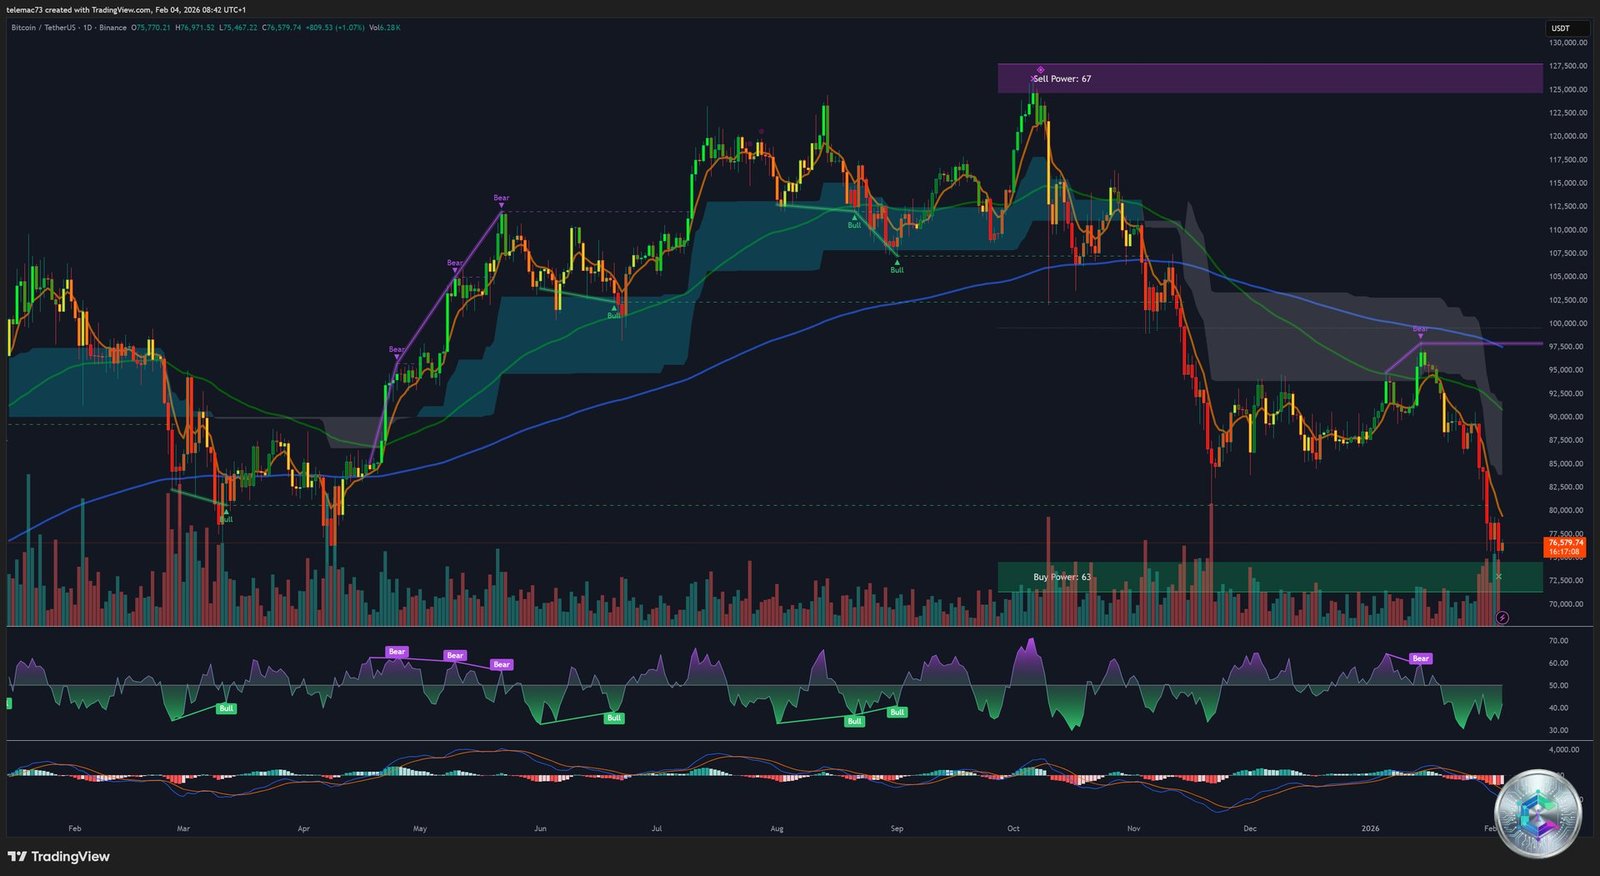
This level should have served as a technical bounce zone but was pierced, transforming a healthy correction into a momentum-driven downslide.
Simple moving averages (SMA) and exponential moving averages (EMA) confirm this trend. Price currently trades below its 20-day SMA, located around $89,400, a level analysts consider necessary to cross for a bullish « change of character. »
The RSI (Relative Strength Index) on the daily chart flirts with oversold territory at 27, which could suggest seller exhaustion. However, the MACD shows a bearish crossover of moving averages, indicating additional downward pressure is likely before any real stabilization.
4-Hour Dynamics: Rejection and Liquidity Zones
On the 4-hour timeframe, the sharp rejection near $90,000 is striking. This zone has become a « supply wall » where investors who bought at 2025 peaks seek to exit at breakeven or with minimal losses.

Volatility intensified following the expiration of $24 billion in options at week’s end, which « freed » price from its lateral trading channel, pushing it toward new local lows.
A fragile support formation exists between $74,500 and $76,000. This level corresponds to a « nine-month low » recently touched, and any sustained break below would open the door to a return toward the $60,000 zone, a floor identified by multiple institutions including Bernstein.
15-Minute Micro-Analysis: Liquidity Hunting
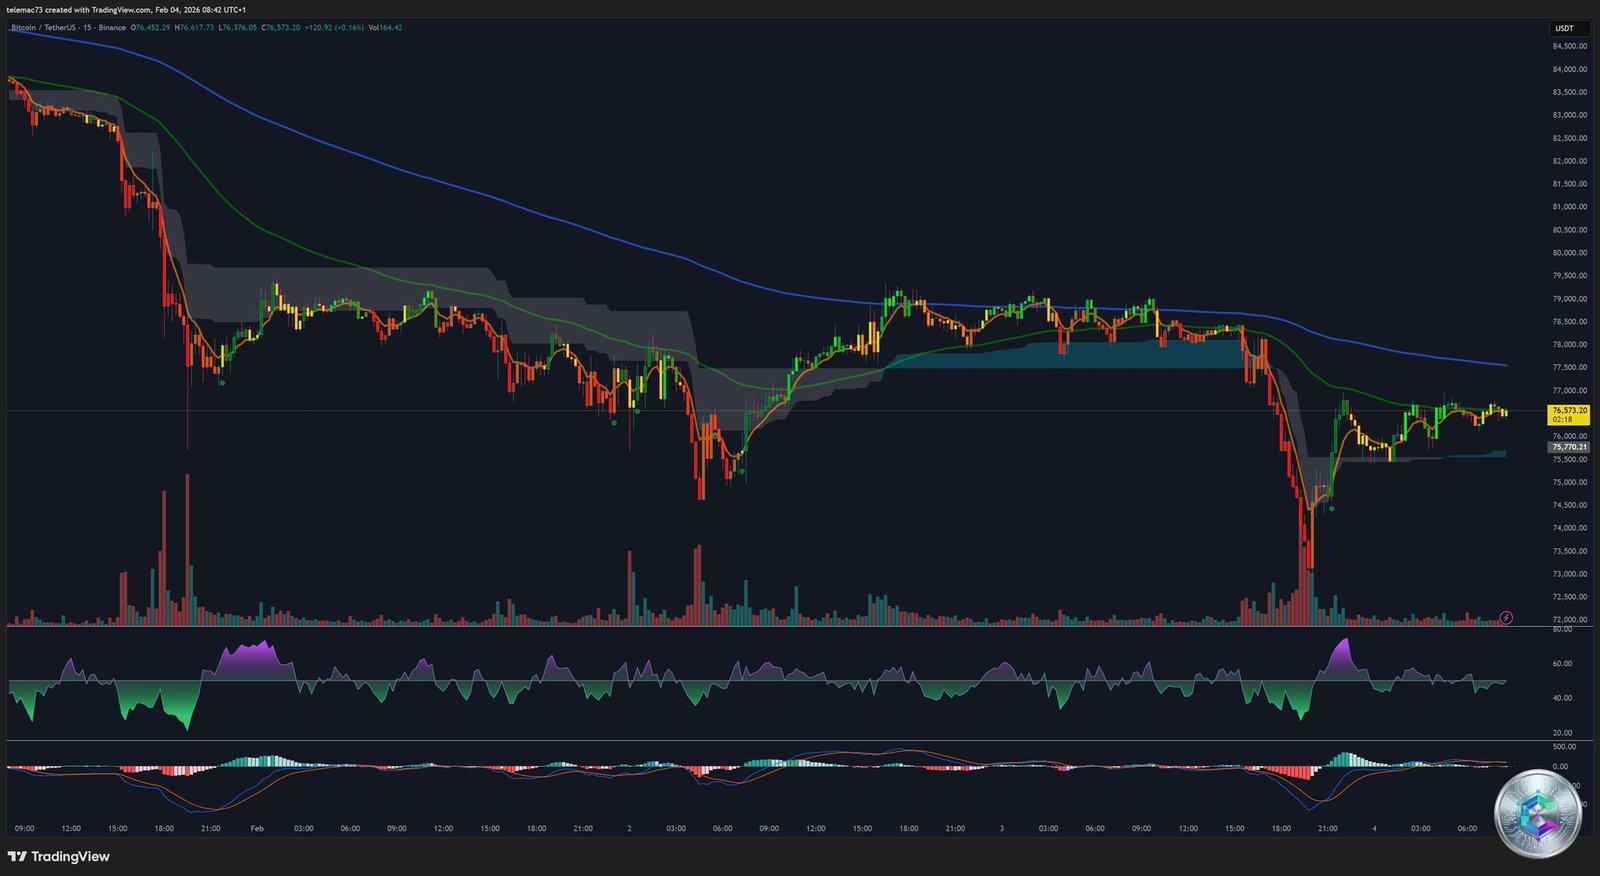
The 15-minute chart reveals feverish activity dominated by algorithmic trading and leveraged position liquidations. Price movements are often impulsive, followed by periods of directionless drift.
Order book liquidity is reported as 30% below its October peak, making the market vulnerable to sharp reversals even on relatively low volumes. Massive liquidation zones exist around $85,000 on the upside and toward $72,000 on the downside.
Identification of Key Levels: Supports, Resistances, and Pivots
| Level Type | Price (USD) | Technical Importance |
| Psychological Resistance | 100,000 | Ultimate barrier, FOMO barrier |
| Structural Resistance | 92,000 – 95,000 | « Bull Trap » zone, strong supply overhang |
| Trend Resistance | 88,000 – 89,400 | 20-day moving average and rejection zone |
| Cycle Pivot | 78,500 | Boundary between correction and uptrend |
| Competition Support | 74,500 – 76,000 | 9-month low, current defense zone |
| Macro-Cycle Support | 69,000 – 72,000 | 2021 high, structural floor |
| Generational Floor | 58,000 – 62,000 | Institutional buying zone, 200-week SMA |
Rigorous identification of technical levels is essential for navigating this « extreme fear » environment. The major pivot of the current structure sits at $78,500; sustained navigation above this point would return the advantage to buyers, while evolution below maintains the bearish bias.
Order Flow and Heatmap Analysis

Examination of the « Heatmap » and order flow reveals crucial information about large player positioning:
- Liquidity Imbalance: Significant liquidity void exists between $65,000 and $72,000. If the $74,500 support fails, the absence of massive buy orders in this zone could trigger rapid price decline due to lack of counterparty.
- Sell Walls: Concentrated sell orders are visible at $80,000, $88,000, and especially $95,000. These levels will act as glass ceilings during any bounce attempt.
- Whale Behavior: On Bitfinex, some whales are observed accumulating long positions for the end-2026 horizon, betting on a cyclical rebound despite immediate pain.
Market Sentiment and Investor Behavior
Market sentiment is currently in a state of prostration. The Fear & Greed Index showing a value of 14 (Extreme Fear) reflects dull panic rather than violent capitulation.
A striking element of this period is unusual silence on social media. « Number go up » memes and relentless « buy the dip » encouragements have disappeared, replaced by widespread weariness. This phenomenon often precedes the final phase of a correction, where remaining « weak hands » finally abandon positions out of time frustration.
The MicroStrategy Case and the « Pain Threshold »
The market closely watches MicroStrategy’s (MSTR) position, whose average acquisition cost for Bitcoin holdings is estimated at around $76,000. As spot price fluctuates precisely around this level, uncertainty looms over the company’s strategy should the price settle sustainably below.
The fact that the largest corporate Bitcoin reserve is near its break-even point creates major psychological tension on the market.
Institutional Flows and ETF Dynamics
2026 marks maturity for spot Bitcoin ETFs, but this maturity brings challenges. While the year began « like a lion » with $1.2 billion in net inflows on the first two days of January, the trend reversed sharply.
In February 2026, digital asset investment products are recording massive outflows. In a single week, outflows reached $1.7 billion, with Bitcoin representing the lion’s share at $1.32 billion in disinvestments. These outflows are attributed to a more « hawkish » Fed stance and « whale » selling related to the four-year cycle.
A notable divergence appears: while the entire ETF complex suffers, BlackRock’s iShares Bitcoin Trust (IBIT) continues to attract selective inflows. This suggests institutional investors are not leaving the sector en bloc but consolidating toward the most liquid and respected vehicles.
Morgan Stanley’s Entry
A long-term bullish signal amid current gloom is Morgan Stanley’s filing of forms with the SEC to launch its own Bitcoin and Solana ETFs. With approximately $8 trillion in assets under management, this Wall Street giant’s entry could significantly broaden market access and further legitimize these assets as mass investment vehicles, despite short-term volatility.
Regulatory and Infrastructural Developments
India: New Leader and Fiscal Rigor
India has established itself as the world’s largest cryptocurrency market through massive popular adoption. However, the 2026 Budget brought fiscal clarity that weighs on speculative activity.
The introduction of section 285BAA imposes mandatory reporting framework for exchanges and wallet providers, similar to traditional financial institutions. This disclosure obligation, effective April 1, 2026, marks the end of the anonymity era for Indian investors and could trigger a purge of unreported transactions before this date.
Stablecoins as Payment Infrastructure
A major 2026 trend is the transformation of stablecoins from simple trading tools into real payment infrastructure. Stablecoins are now integrated into B2B flows and treasury operations.
Visa’s expansion into USDC settlement testifies to this evolution. This growing utility creates baseline demand for blockchain technology independent of Bitcoin’s speculative price, providing a safety net for the ecosystem.
Projections and Quantitative Scenarios
AI models and quantitative analysts are currently divided on Bitcoin’s immediate trajectory, reflecting fundamental market indecision.
For February 28, 2026, forecast aggregation tools suggest an average price of $76,667. However, individual spreads are significant:
- Claude Sonnet projects a potential 7.44% rally toward $82,500
- ChatGPT and Gemini forecast continued decline toward levels between $72,500 and $75,000
These divergences indicate the market will likely remain in a range-bound consolidation phase before a new macroeconomic catalyst imposes a clear direction.
The Michael Burry Factor
Michael Burry, famous for predicting the 2008 crisis, issued a chilling warning in February 2026. He forecasts that a Bitcoin plunge could trigger a massive $1 billion sell-off in gold and silver due to risk interconnection between asset classes.
This thesis rests on the idea that Bitcoin has become so integrated into multi-asset portfolios that its crash would force collateral liquidations on precious metals to cover margin calls.
Realized Value and MVRV Calculation
Bitcoin’s realized value, which measures the average price at which each coin last circulated, is a key indicator. The MVRV Z-Score currently indicates historically undervalued market conditions.
This calculation suggests we may be approaching a major inflection point where spot price is below the perceived « true value » of the asset. Bitcoin trades at distress levels that historically marked important cycle bottoms before multi-year recoveries.
Final Summary and Recommendations
Technical and fundamental analysis of Bitcoin on February 4, 2026 paints a portrait of an asset in full confidence crisis, yet whose institutional foundations continue strengthening in the shadows.
Key Points for Risk Management
- Monitor $74,500 Support: This is the critical bulwark. A daily close below this level would invalidate short-term bounce theses and confirm the $60,000-$62,000 target.
- Neutrality Below $78,500 Pivot: While Bitcoin evolves below this pivot, « bounce trading » strategies carry elevated risk. Caution is warranted until this level is reclaimed on significant volume.
- Strategic Accumulation (DCA): For long-term investors, current levels are beginning to present historically favorable entry opportunities, especially considering the undervaluation suggested by MVRV and the imminent entry of giants like Morgan Stanley.
Bitcoin market in early 2026 is a resilience test. Between Indian fiscal pressures, global geopolitical instability, and excessive leverage purging, the asset seeks its next equilibrium.
If previous cycle history repeats, this phase of « extreme fear » and social disinterest could prove fertile ground on which the next price discovery phase toward six figures builds, once macroeconomic uncertainties dissipate.
However, in the short term, discipline and capital preservation remain absolute priorities against bearish momentum that hasn’t yet had its final say.
Disclaimer: This article is provided for informational and educational purposes only. It does not constitute investment advice, a recommendation to buy or sell, nor an inducement to conduct any financial transaction. The technical analyses and projections presented reflect market conditions at the time of writing and may change rapidly. Cryptocurrency remains a highly volatile and risky asset. Investors must conduct their own research and consult qualified professionals before making investment decisions.