
The digital asset market finds itself at a critical juncture in early February 2026, marked by an unprecedented transition between speculative euphoria and rigorous institutionalization. Ethereum (ETH), the cornerstone of smart contracts and tokenization economy, is currently experiencing intense volatility that demands multidimensional analysis.
The « Warsh Shock »: A New Monetary Paradigm
Ethereum’s evolution in Q1 2026 is inseparable from a major shift in U.S. monetary policy. The nomination of Kevin Warsh to lead the Federal Reserve by President Trump, announced January 30, 2026, sent shockwaves across all risk assets.
Warsh, whose profile is marked by a career focused on fighting inflation and historical mistrust of Fed balance sheet expansion, immediately instilled fears of global liquidity reduction. Unlike Jerome Powell’s accommodative approach, this new monetary discipline strengthens the U.S. dollar and raises real interest rates, increasing the opportunity cost of holding digital assets.
This new era triggered a generalized « risk-off » movement, exacerbated by Middle Eastern geopolitical tensions, pushing investors toward traditional safe havens. For Ethereum, this translates to valuation multiple compression. The Fear and Greed Index plunged to 14 on February 3, 2026, reflecting retail investor psychological capitulation.
Multi-Timeframe Technical Analysis: Reversal Signals

The Falling Wedge on Daily Chart
The nearly 28% drop from January highs forced the price out of its 2025 bullish channel to test the $2,200 zone. On the daily timeframe, Ethereum is evolving within a very clear falling wedge. This pattern, characterized by converging higher lows and lower highs, technically signals slowing selling pressure.
The 14-day RSI indicator supports this reversal hypothesis. Between mid-December 2025 and early February 2026, price marked successive lower lows, while RSI stabilized around 37-48. This bullish divergence suggests selling intensity is diminishing. To confirm this reversal, a daily close above $2,690 is imperative.

4-Hour Timeframe: Critical Supply Zones
Price is currently trading below its 20 and 50-period exponential moving averages, confirming short-term seller control. Each bounce attempt has been systematically rejected by the supply zone between $2,400 and $2,550, formerly major support in January.
The MACD shows bearish momentum, but the histogram displays signs of flattening, indicating that a sideways consolidation phase may succeed the free fall.

Intraday Dynamics: Volatility and Stop-Loss Hunting
On the 15-minute scale, Ethereum presents erratic volatility with deep wicks illustrating aggressive stop-loss hunts. The February 2nd technical bounce, carrying ETH from $2,163 to $2,322, was primarily fueled by short position covering rather than fresh capital inflow. The $2,200 level serves as a floor with repeated whale interventions.
Massive Liquidations: The Great Cleanup
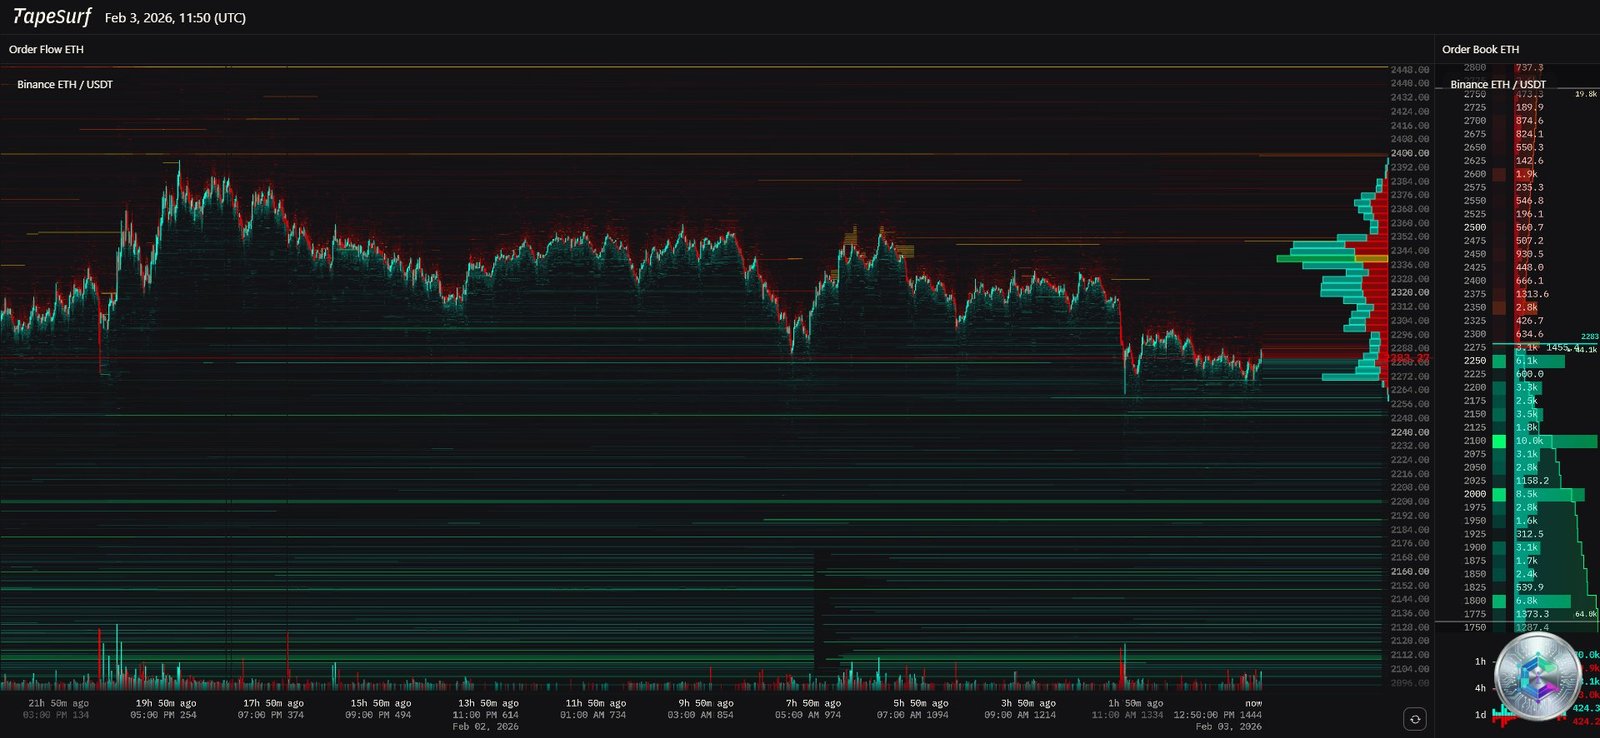
The liquidation heatmap shows extreme concentration of forced sell orders during the $2,500 psychological level breach on January 31, 2026. Within 24 hours, over $1.1 billion in long positions were liquidated, triggering a cascade effect toward $2,200. A single transaction on Hyperliquid, valued at $222.6 million, illustrates the magnitude of pain for overleveraged traders.
The majority of long position liquidations have been executed, leaving the market « lighter. » Conversely, new liquidity accumulation for short positions is forming above $2,800. Breaking through this level could trigger a « short squeeze, » forcing sellers to buy back and accelerating a rally toward $3,000.
On-Chain Analysis: Whales vs Retail Divergence
Blockchain data reveals significant ownership transfer. During general panic, wallets holding over 10,000 ETH steadily increased their balances. Since January 1, 2026, supply held by these « whales » increased from 101.18 million to 105.16 million ETH, representing net accumulation of nearly 4 million tokens.
Specific wallets like « 7 Siblings » deployed tens of millions of dollars to buy ETH around $2,300, treating the decline as an opportunity. This conviction from large capital contrasts with massive distribution from holders of less than 10 ETH, the main sellers during the crash.
However, exchange inflows reached multi-month highs on February 1st, with approximately 600,000 ETH deposited on central platforms, notably 357,000 ETH on Binance. These movements suggest selling pressure may not be completely exhausted.
Ethereum ETFs: Institutionalization and Mechanical Pressures
2026 marks the maturity of spot Ethereum ETFs in the United States, but this integration brings new price dynamics. In early February, ETF flows reversed, shifting from record January accumulation to significant net outflows. Listed crypto funds recorded weekly withdrawals of $1.7 billion, including $308 million for Ethereum products.
BlackRock’s iShares fund (ETHA) dominates with over $10 billion in assets, but its acquisition pace has slowed. Operations analysis reveals the decline was amplified by mechanical selling: when investors withdraw funds, « Authorized Participants » must sell underlying ETH, regardless of fundamentals. Between January 28-30, this pressure forced liquidation of hundreds of millions of dollars in ETH, creating liquidity « air pockets. »
2026 Technology Roadmap: Glamsterdam and Hegota
Ethereum’s technical development remains the main long-term value catalyst. 2026 is marked by two major upgrades aimed at resolving scalability and centralization issues.
Glamsterdam (First Half 2026)
The Glamsterdam upgrade will introduce parallel transaction processing, targeting theoretical throughput of 10,000 TPS on the mainnet. However, January 2026 reports indicate the scope may be reduced to guarantee mid-year launch. Critical components like EIP-7732 (Proposer-Builder Separation) face implementation delays, essential for reducing MEV manipulation risks.
Hegota (Second Half 2026)
Hegota will focus on strengthening censorship resistance and drastically reducing Layer 2 fees. By optimizing data « blobs, » Hegota aims to reduce transaction costs by an additional 95%, positioning Ethereum as the infrastructure of choice for AI agents and Real-World Asset (RWA) tokenization.
Regulatory Framework: « Project Crypto »
On the legislative front, Ethereum benefits from notable improvement in operational clarity in the United States. The launch of « Project Crypto » by the SEC and CFTC on January 29, 2026, marks the end of enforcement-based regulation for an era of harmonization.
This initiative aims for a unified framework with clear definitions and simplified registration procedures. For Ethereum, this harmonization reduces legal risks on staking providers and DeFi protocols, potentially paving the way for Ethereum ETFs including staking yields.
Key Technical Levels
Quantitative analysis provides rigorous benchmarks for risk management. Calculated pivots show convergence around key levels:
- Standard Pivot Point: $2,723
- Resistance 1 (R1): $2,803
- Resistance 2 (R2): $2,905
- Support 1 (S1): $2,621
- Support 2 (S2): $2,541
Ethereum is currently trading well below its daily pivot point of $2,723, confirming immediate bearish trend. Reclaiming this level is the first strength signal needed to consider a return toward $3,000.
Fibonacci levels from the major 2025 bull cycle:
- 38.2% Retracement: $2,753 (current resistance)
- 50% Retracement: $3,173 (cycle pivot zone)
- 61.8% Retracement: $3,593 (bullish recovery target)
Strategic Conclusions
Ethereum analysis as of February 3, 2026 depicts an asset at a crossroads, torn between brutal technical degradation and indisputable fundamental resilience.
Key Takeaways:
- Leverage purge largely complete: Late January massive liquidations « cleaned » the market of excessive speculative positions, reducing risk of additional falls.
- Significant Whale accumulation: Systematic ETH transfer from panicked retailers to institutional wallets suggests large capital sees significant value at current levels.
- Persistent macroeconomic challenge: Kevin Warsh’s nomination and the Fed’s new discipline impose liquidity constraints weighing on the entire sector. Ethereum must prove its ability to attract stable flows in a high-rate environment.
- 2026 technology calendar catalyst: Although Glamsterdam may be reduced in scope, evolution toward parallel processing and Layer 2 fee reduction remains the central pillar of Ethereum’s investment thesis as global settlement layer.
Tactical Recommendations: The $2,200 level constitutes the critical support zone for Q1 2026. As long as this level is maintained on weekly close, the long-term bullish structure remains intact despite short-term volatility. Institutional investors favor a buy-the-dip strategy rather than chasing bullish breakouts. For traders, the $2,723 to $3,000 zone represents a high-risk « no-man’s land »; confirmed reclaim of these levels is necessary to validate correction end.
Disclaimer: This article is provided for educational and informational purposes only. It does not constitute investment, financial, or trading advice under any circumstances. Cryptocurrency markets are extremely volatile and carry significant risks. Any investment decision should be made after consulting a professional financial advisor and thorough analysis of your personal situation. The author and cryptoinfo.ch cannot be held responsible for financial losses resulting from decisions made based on this article.