
The Bitcoin market is currently navigating one of the most complex periods in its recent history. After reaching historic peaks above $126,000 in October 2025, BTC has stabilized around $78,748 in early February 2026, marking a severe correction that has redefined institutional expectations and transformed optimism into « extreme fear ».
A Perfect Macro-Economic Storm
The current environment is dominated by a confluence of unfavorable macro-economic factors. Kevin Warsh’s nomination to lead the Federal Reserve, coupled with inflation data exceeding forecasts, has pushed back expectations for interest rate cuts. The US Dollar Index (DXY) has strengthened toward 97.64, exerting mechanical downward pressure on risk assets.
The most striking phenomenon remains the simultaneous crash in precious metals. « Black Thursday » on January 30, 2026, saw gold lose approximately $3 trillion in market capitalization, while silver plummeted nearly 12%. This forced correlation obliged multi-asset fund managers to liquidate their Bitcoin positions to cover margin calls, illustrating BTC’s role as a global liquidity proxy rather than a disconnected « digital gold ».
Sentiment Indicators: Extreme Fear
The Fear & Greed Index has plunged to 15, signaling capitulation among less experienced investors. Even more revealing, spot Bitcoin ETFs recorded net outflows of $1.35 billion over one week, with BlackRock’s iShares Bitcoin Trust showing withdrawals of $947 million.
This institutional capitulation is particularly significant as the average purchase price for ETFs sits at $87,830. Institutional investors, the famous « smart money », now display unrealized losses, reducing their capacity to support prices during retail panic phases.
Multi-Timeframe Technical Analysis
Daily Chart: Bearish Confirmation
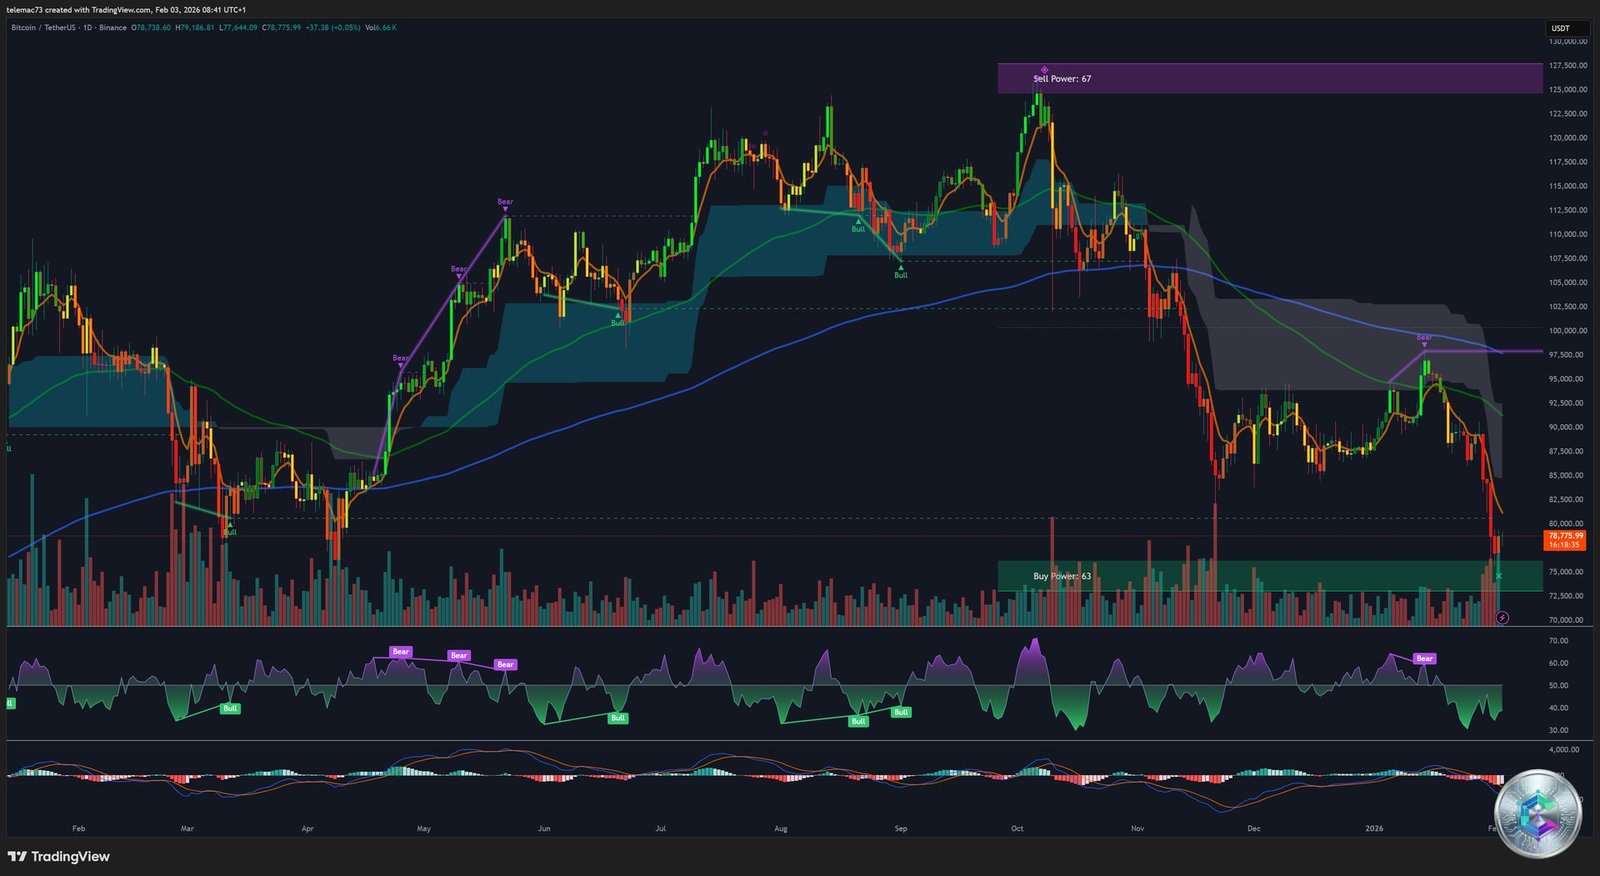
The daily chart validated a « Head and Shoulders » reversal pattern after breaking the neckline at $86,400. This breakdown accelerated the fall toward $82,500, marking buyers’ failure to defend Fibonacci retracement levels at 0.236.
The daily RSI, dropping between 20 and 25, indicates an extreme oversold condition. Historically, such levels have preceded rebounds of around 10%, but primarily confirm the current selling pressure intensity.
4-Hour Chart: The Fight for Stabilization

The 4-hour analysis reveals an attempt to form a technical floor. After reaching $74,500, the price is trying to stabilize in a corridor between $74,000 and $78,000. A potential bullish divergence on the RSI is beginning to form, though it requires a confirmed close above $80,000 for validation.
15-Minute Chart: Fragile Micro-Structure
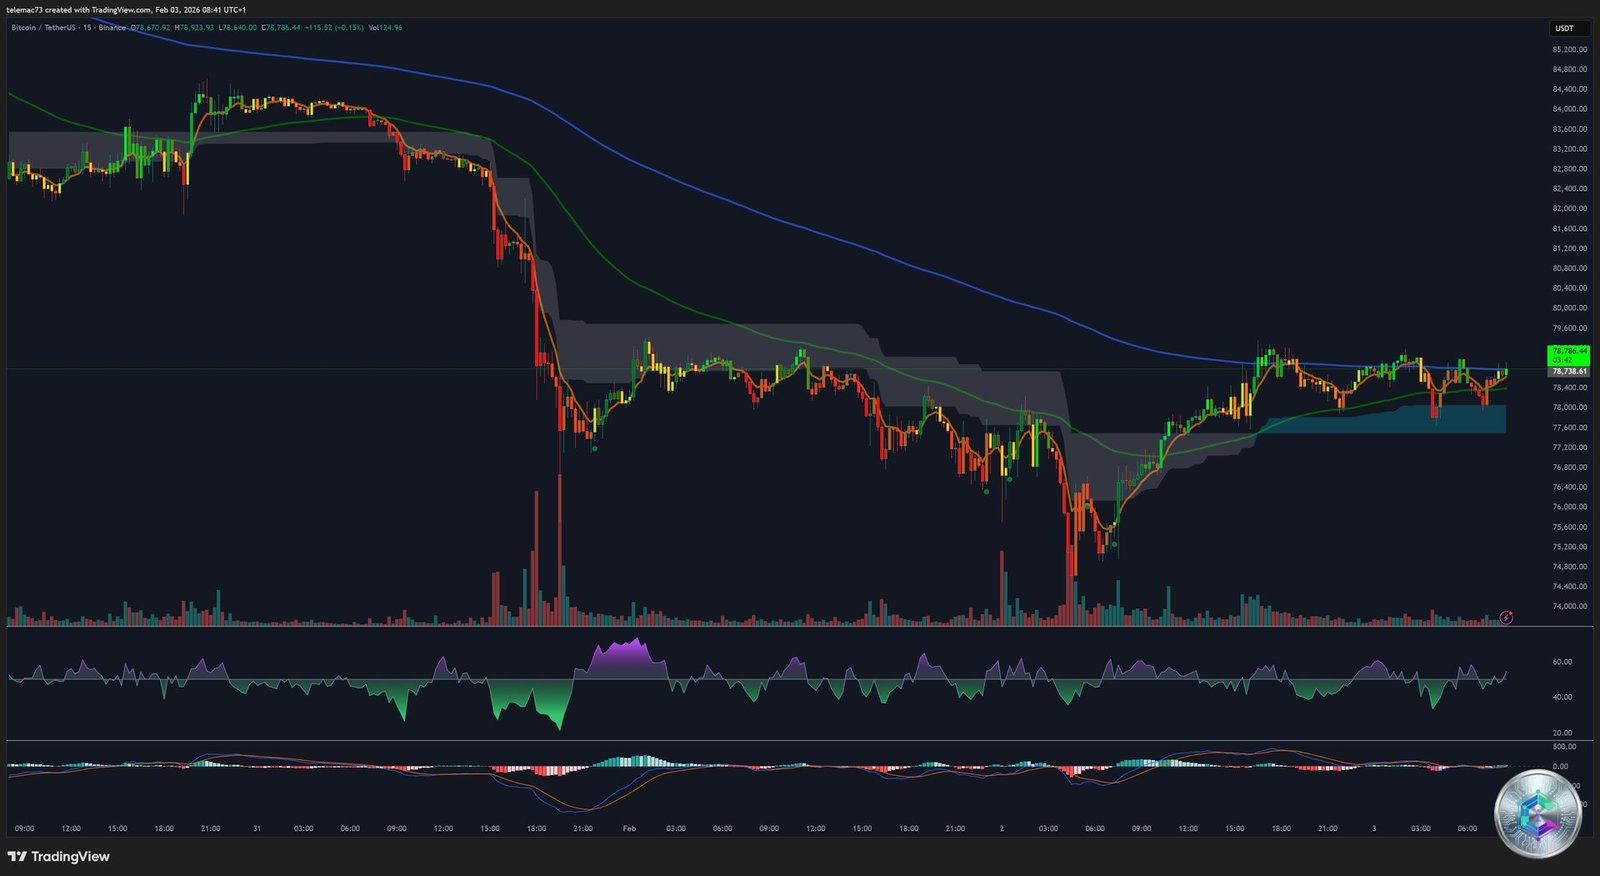
The 15-minute chart illustrates intraday volatility. The bounce from $74,500 occurs in relatively low volume, suggesting a « relief bounce » rather than a lasting trend reversal. Each incursion toward $79,500 is met with immediate selling pressure.
Order Flow and Critical Liquidity Zones
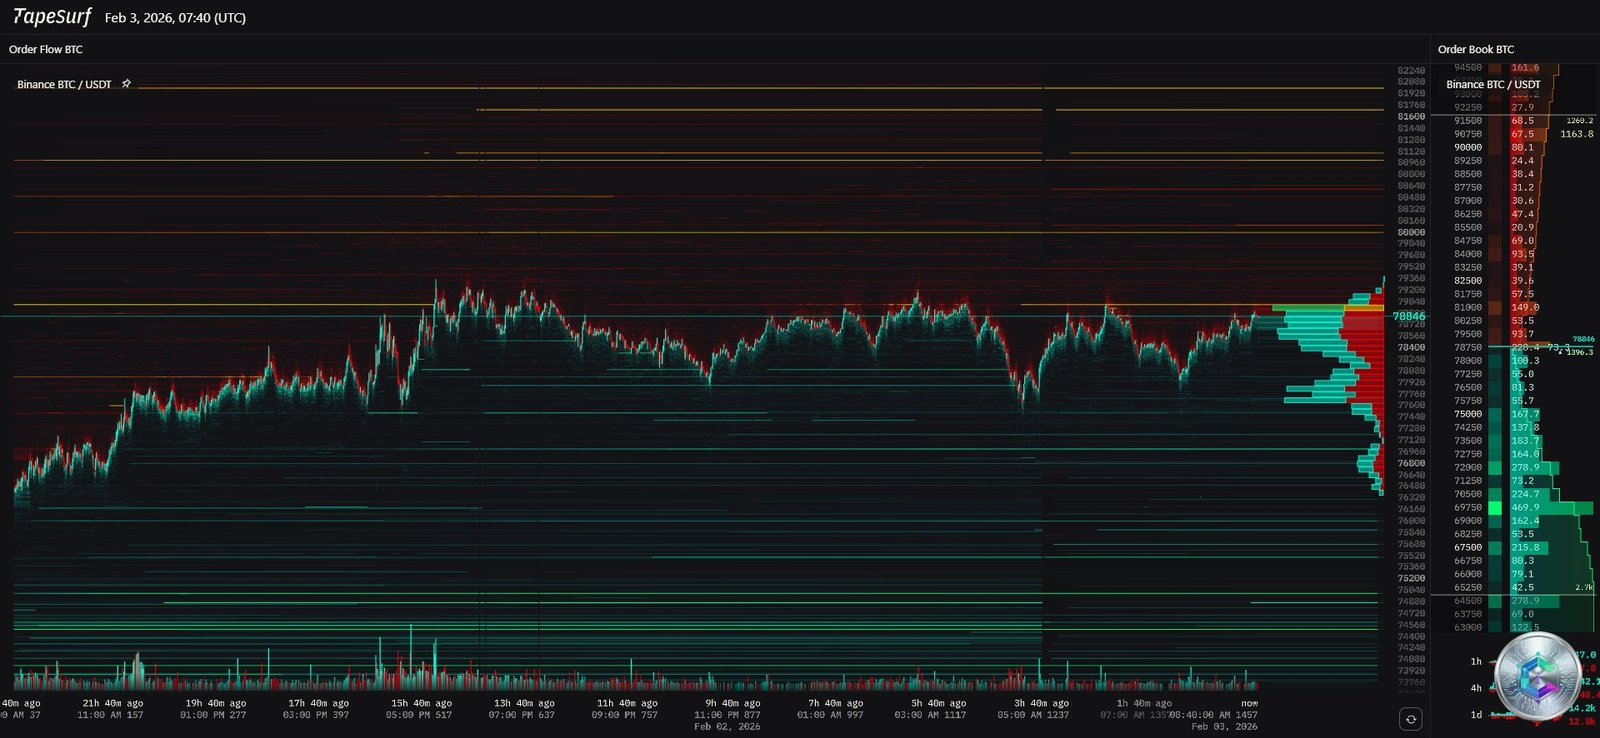
Examining the heatmap reveals critical zones acting as price action magnets. The correction toward $74,555 purged a large portion of buyer leverage, with over $2.42 billion in long positions liquidated within 24 hours.
Currently, a dense band of short position liquidations is visible between $78,500 and $80,000. If buyers manage to breach this zone, it could trigger a cascade of forced buybacks toward $82,000, or even $84,500. Conversely, below $74,000, the order flow structure is « hollow », risking a rapid drop toward $70,000.
On-Chain Metrics: Investor Distress
On-chain data reveals significant psychological distress. The cost basis of short-term holders (STH) sits at $95,400, placing new entrants in an 18% unrealized loss situation. This dynamic creates massive excess supply at each upward attempt.
Point of particular attention: MicroStrategy displays an estimated average acquisition cost of $76,000. A prolonged drop below this level could call into question the company’s treasury strategy and generate additional systemic uncertainty.
Key Technical Levels
Critical Supports
- $74,000 – $75,000: Historical demand zone and current defensive bastion. A break would trigger panic selling toward $68,000
- $70,118: Intermediate support identified by institutional algorithmic models
- $68,000: 200-week EMA, level separating a cyclical bear market from deep structural capitulation
- $55,900: Network realized price, reached only during the darkest phases of bear markets
Major Resistances
- $79,500 – $80,500: Immediate resistance reinforced by short liquidation clusters
- $84,000 – $85,000: Former uptrend line, difficult ceiling to breach without macro catalyst
- $88,000: Structural resistance linked to active investors’ entry cost
- $95,400: STH cost basis, level signaling correction end if reconquered
Q1 2026 Scenarios
Bearish Scenario (45% Probability)
Breaking the $74,000 support would trigger a rapid fall toward $68,000 to fill liquidity gaps. Testing $60,000 remains possible in case of intensifying geopolitical tensions or global liquidity shock.
Consolidation Scenario (40% Probability)
Sideways phase between $74,000 and $84,000 allowing sellers to exhaust and on-chain metrics to stabilize. Sentiment would remain in the « Fear » zone, but volatility would decrease, preparing a potential Q2 2026 rebound.
« Short Squeeze » Scenario (15% Probability)
An unexpected catalyst (pro-crypto statement, pause in rate hikes) could trigger the buyback of $3 billion in short positions above $80,000, bringing the price toward $90,000 rapidly.
Conclusion: Caution and Opportunities
Bitcoin’s situation on February 3, 2026, calls for extreme caution while offering opportunities for value investors. The $74,546 pivot remains the crucial barometer: as long as it holds, hope for stabilization remains. A daily close below $74,000 should be interpreted as a defensive sell signal.
Fundamental valuation indicators like the MVRV Z-score suggest we’re approaching a historic floor zone. For buyers, a dollar-cost averaging (DCA) approach seems more appropriate than a massive entry, given the latent supply between $87,000 and $95,000.
The Bitcoin market is undergoing a structural transformation where ETF flows and macro-economic variables now weigh heavier than traditional halving cycles. The asset’s ability to maintain its supports against a strong dollar will be the true test of its maturity as an institutional asset.
Disclaimer: This article is provided for educational and informational purposes only. It does not constitute investment advice, a buy or sell recommendation. Cryptocurrency markets are extremely volatile and carry significant risks. Always conduct your own research and consult a qualified financial advisor before making any investment decision.