
On January 26, 2026, Bitcoin is navigating through a critical phase of its evolution. Trading around $87,600, the flagship digital asset sits at a crucial inflection point, down 30% from its October 2025 all-time high of $126,000. This major correction has plunged market sentiment into an « Extreme Fear » zone with an index at 20, but a deep analysis reveals a situation far more nuanced than it appears.
Macro-Economic Context: Between Tensions and Opportunities
The global macro-economic environment plays a determining role in Bitcoin’s current dynamics. Discussions held at the World Economic Forum in Davos in January 2026 highlighted the fragility of the US dollar in the face of the BRICS bloc’s rising power. This situation creates an interesting dichotomy for BTC: on one hand, the potential weakening of the dollar is structurally bullish for Bitcoin as a non-sovereign store of value. On the other hand, the immediate uncertainty triggers risk aversion that temporarily penalizes volatile assets.
The US Federal Reserve maintains a restrictive monetary policy, with only a marginal 2.8% probability for a rate cut at the January 28, 2026 FOMC meeting. This monetary rigidity continues to act as a glass ceiling on risk assets, while trade tensions and the threat of a new government shutdown add a geopolitical risk premium.
A Structural Evolution in the Mining Sector
A paradigm shift is occurring on the supply side. Bitcoin miners are massively pivoting toward Artificial Intelligence, reallocating their energy capacity to AI data centers that are more profitable in the short term. This phenomenon has led to a decline in hashrate (-6%) and difficulty (-2%), but more importantly, it reduces miners’ forced selling pressure on the market. Less dependent on selling their freshly mined BTC to cover operational expenses, miners can hold their inventory, reducing available supply on the secondary market. This is an often underestimated fundamental support factor for the medium term.
Multi-Timeframe Technical Analysis: Market Structure
Daily View: Weakened Underlying Trend
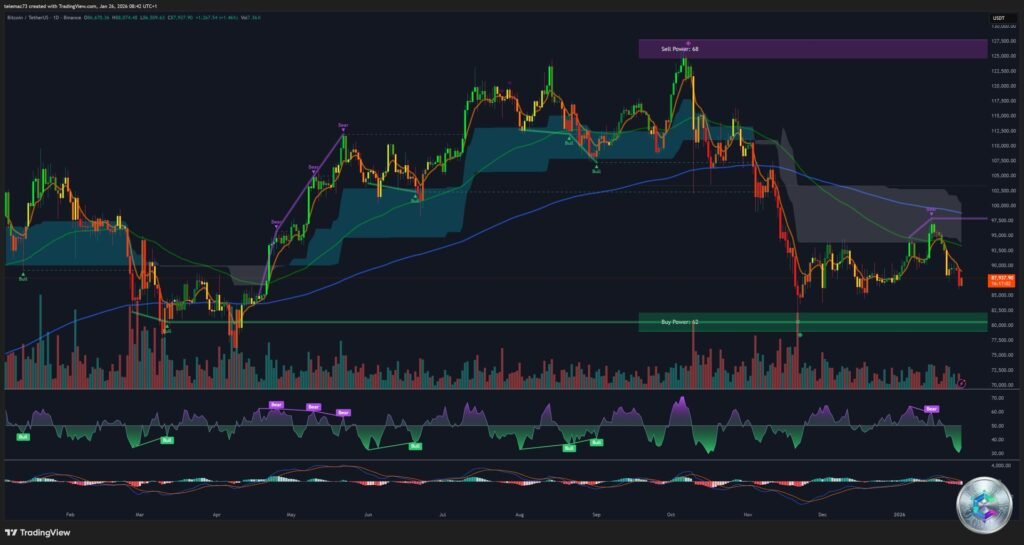
On the daily timeframe, Bitcoin has suffered significant technical degradation. The week’s major event was the break of the critical horizontal support at $88,604, the floor of a rectangle formation with resistance at $97,048. This breakdown theoretically opens the path to targets toward the $80,000 zone. Additionally, Bitcoin broke below its long-term bullish channel floor, signaling a slowdown in buyer momentum.
Moving average analysis confirms this negative bias. Price now evolves below its short and medium-term moving averages: the 18-day MA and 50-day MA (located near $90,145) act as dynamic resistances, while the 100-day MA sits far above around $100,915. Bearish crossover signals between short-term MAs are validating, reinforcing algorithmic selling pressure.
4-Hour View: The Swing Traders’ Battle
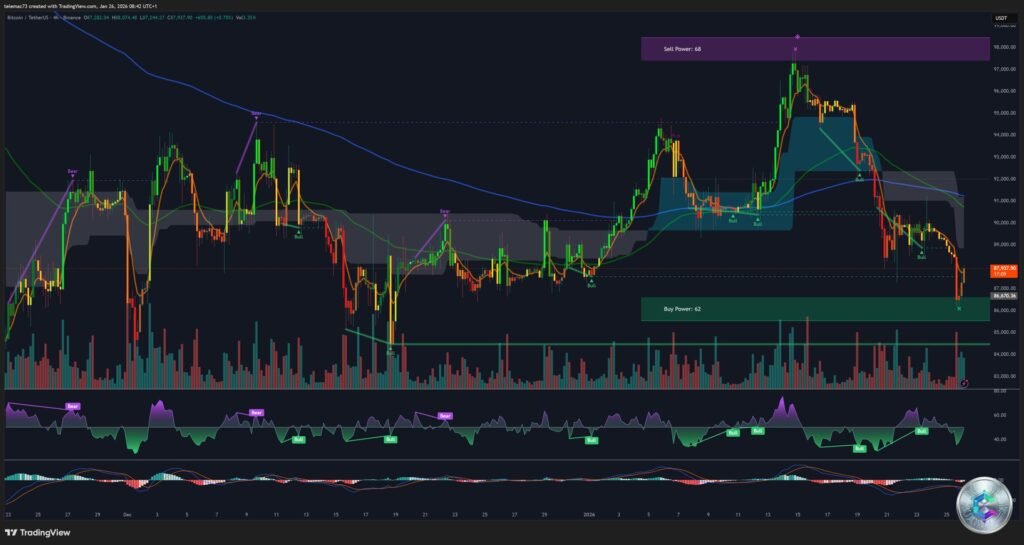
The 4-hour scale offers essential granularity for identifying potential reversals. The recent bullish recovery attempt ended in failure at the $92,000 zone, validating a lower highs structure. More concerning, this rise toward 92k was accompanied by a hidden bearish divergence on the RSI, a classic harbinger of reversal.
Since the 92k rejection, price has formed a structure resembling a bear flag or descending consolidation channel. The base of this structure currently sits around $87,000. A decisive H4 close below this level would validate the continuation pattern. However, we note fierce defense on the lower wicks, a sign of institutional absorption of selling.
15-Minute View: Micro-Structure and Intraday Trading

For active operators, the 15-minute chart reveals participant nervousness. Price is trapped in a micro-range between $87,200 (intraday support) and $87,900 (immediate resistance). Movements are choppy, characterized by numerous wicks, typical of a directionless market where high-frequency algorithms dominate trading.
Pivot point analysis is unequivocal: price evolves below the Central Pivot located at $88,256. As long as the market stays under this equilibrium level, the intraday bias is bearish. The first intraday support (S1) sits at $87,039, a critical level to watch for potential breakdown, while the second support (S2) at $86,586 represents the last rampart before acceleration toward monthly lows.
Market Depth Analysis: Order Flow and Liquidations
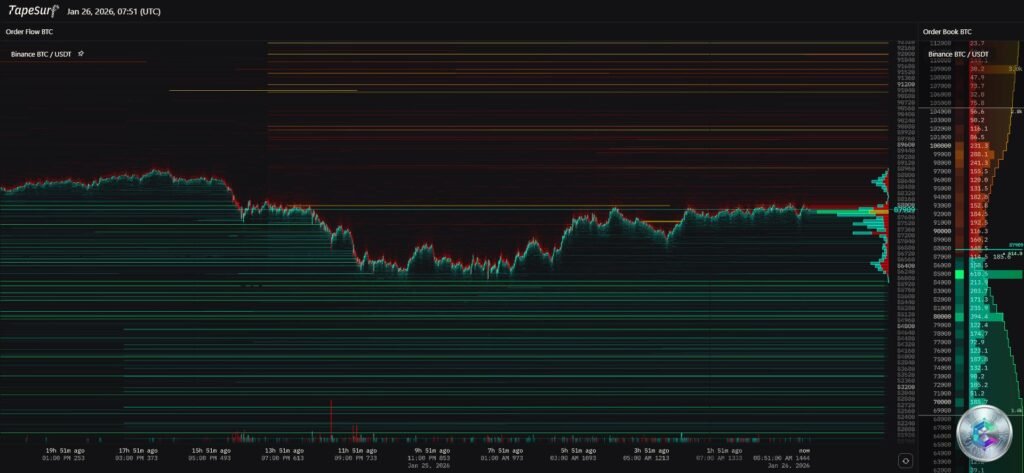
Buy Walls: The Institutional Bulwark
Market depth data reveals a major positive anomaly for bulls. There exists a massive concentration of buy liquidity positioned between $87,000 and $90,000, with more than 1.37 million BTC held or demanded in this zone. This « buy wall » acts as a powerful shock absorber. For price to sustainably decline below $87,000, sellers must consume all this passive liquidity, requiring considerable selling volume. This density explains the repeated bounces whenever price touches $87,200.
Liquidation Clusters: Magnetic Attraction
Liquidation heatmaps show dense clusters of leveraged positions. To the South, large volumes of long position liquidations are concentrated just below $87,000 and down to $86,000. If support gives way, the triggering of these forced sell orders could provoke a cascade of liquidations, accelerating price downward very rapidly. The market often tends to hunt this liquidity before reversing.
To the North, interestingly, resistance above current price is sparse between $92,000 and $104,000. This means the order book on the sell side is relatively empty above 92k. If Bitcoin manages to break through the $92,000 – $94,500 barrier, there’s little friction to prevent a rapid climb toward $100,000. This is an important risk asymmetry: downside is slowed by massive buy walls, while upside beyond 92k is potentially explosive due to lack of sellers.
Key Technical Levels to Monitor
Based on confluence between chart analysis, moving averages, and order book volumes, here are the critical levels:
- Major Resistance: $97,048 – Recent consolidation rectangle top, medium-term bearish invalidation level
- Pivot Resistance: $94,500 – Critical breakout point. Above this, the sell order book is empty toward 100k
- Key Resistance: $92,000 – Recent rejection zone, psychological and technical threshold
- Central Pivot: $88,256 – The intraday judge. Bearish bias as long as price stays below
- Current Price: ~$87,600 – Zone of compression and indecision
- Immediate Support: $87,000 – Current range bottom, protected by institutional buy wall
- Critical Support: $85,800 – $86,000 – Last technical rampart before free fall
- Structural Support: $80,700 – $81,500 – Theoretical target of daily rectangle breakdown
- Ultimate Support: $74,000 – Secular bullish trend support, long-term channel floor
Probabilistic Forecast Scenarios
Scenario A: Liquidity Hunt and Bounce (45%)
This is the favored scenario for institutional structures. Bitcoin briefly breaks $87,000 to trigger retail traders’ stop-losses and touch liquidity toward $86,000 – $86,500. Once this liquidity is absorbed, a rapid rejection wick forms, bringing price back above $87,500. An H4 close back above the Central Pivot ($88,256) would validate this « Bear Trap » with a target return toward $92,000.
Scenario B: Capitulation and Bearish Continuation (35%)
If negative macro-economic news accumulates, the buy wall at 87k could crumble. A decisive and high-volume break of $86,000 without immediate bounce, with a retest of this level as resistance and a daily close below $85,800, would open the path to acceleration toward the $80,700 – $81,500 zone, where value investors await entry.
Scenario C: Immediate Recovery (20%)
Less probable without positive external catalyst. Buyers aggressively defend $87,200 and push price directly above $89,000, with a rapid test of $94,500 to exploit the empty sell order book.
Conclusion: An Asset at a Tipping Point
The in-depth analysis of Bitcoin in this January 2026 depicts an asset in a major resilience testing phase. Technically, bears have the tactical advantage in the short term as long as price stays below $88,256. The break of the daily rectangle structure is a serious warning signal that should not be ignored.
However, order book analysis nuances this pessimism. The exceptional density of buy orders between 87k and 90k suggests the decline is laborious and costly for sellers. Moreover, the fundamental context with solid miners and latent monetary inflation remains supportive for the long term.
The key for the week will be volatility management around the $88,256 pivot. A weekly close above this level would be a remarkable sign of strength, while a close below would open the door to a prolonged correction of several additional weeks.
Important Disclaimer: This article constitutes a market analysis for educational and informational purposes only. It should not be interpreted as personalized financial investment advice. Crypto-asset markets are highly volatile and carry substantial risks of capital loss. Always do your own research (DYOR) and consult a qualified financial advisor before making any investment decision.