
The Bitcoin market is currently navigating a critical consolidation phase, oscillating within a narrow range between $88,000 and $90,500. This comprehensive technical analysis deciphers key levels, support and resistance zones, as well as the macroeconomic catalysts shaping price action in early 2026.
Macroeconomic Context: A Perfect Storm
In January 2026, Bitcoin navigates a complex environment marked by several contradictory factors. On one hand, long-term fundamentals remain solid with asset class maturation and positive discussions at the World Economic Forum in Davos regarding tokenization. On the other hand, the market faces intense pressure from the massive unwinding of institutional « basis trade » and significant capital outflows from Spot ETFs.
Market sentiment reflects this dichotomy: the Crypto Fear & Greed Index displays a score of 24/100, signaling « Extreme Fear ». Historically, these sentiment levels have often marked contrarian buying opportunities for patient investors.
Institutional Flows: The Great Unwinding
The most striking data point from late January 2026 concerns Bitcoin Spot ETFs. Over a four-day period ending January 22, these investment vehicles recorded cumulative net outflows of $1.62 billion, with BlackRock’s IBIT leading the redemptions.
It’s crucial to understand that these outflows don’t reflect a fundamental loss of confidence. Rather, they represent the mechanical unwinding of the « Basis Trade »: hedge funds are closing their long positions on Spot ETFs while buying back their short positions on CME futures, as compressed premiums make this arbitrage strategy less attractive compared to U.S. Treasury yields (currently around 4.23%).
Paradoxically, while speculators are selling, corporate treasuries are accumulating. Entities like Strategy acquired 22,305 BTC between January 12 and 19 for $2.13 billion, illustrating a classic transfer of ownership from « weak hands » to « strong hands ».
Multi-Timeframe Technical Analysis
Daily View: Rectangle Consolidation

On the daily timeframe, Bitcoin has broken the bullish channel from late 2025 and established itself in a classic rectangle formation:
- Range High (Resistance): $96,900 – $98,000
- Range Low (Support): $87,400 – $88,500
- 50-day EMA: For the first time in several months, BTC has broken below this moving average, which now sits around $91,500 and acts as dynamic resistance
- 14-day RSI: Oscillates below 40, indicating seller dominance without reaching deep oversold territory
4-Hour View: Descending Channel
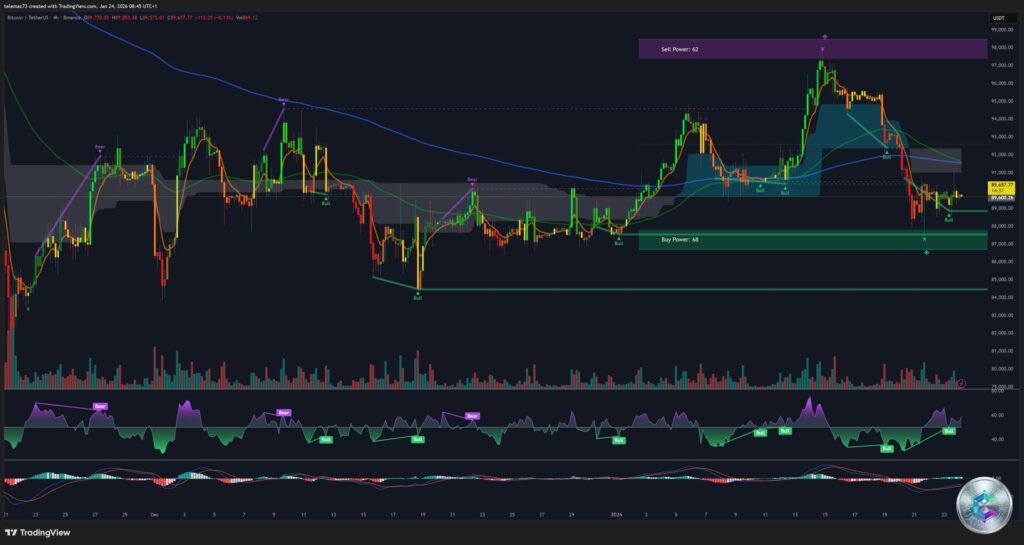
Zooming into the 4-hour timeframe, the daily rectangle resolves into a more granular descending channel. The asset is making lower highs and lower lows, with the latest lower high established around $90,500.
Bollinger Bands show significant tightening (« squeeze »), a reliable technical precursor to imminent volatility expansion within the next 24-48 hours. Two scenarios emerge:
- Bear Flag Scenario: A break below $88,300 with volume would target $84,000
- Reversal Scenario: A decisive break above $91,000 would invalidate the short-term bearish thesis
15-Minute View: Liquidity Hunting

The 15-minute chart reveals « liquidity hunting » operations conducted by high-frequency algorithms. Frequent wicks below $89,000 and above $90,000 signal liquidity grabs where market makers trigger stop-losses to fill institutional orders.
Two unfilled CME futures gaps act as magnets:
- Resistance Gap: $90,000 – $91,000
- Support Gap: ~$88,000
Statistically, price has a high probability of filling the nearest gap in the short term.
Liquidity Heatmap Analysis

The liquidation heatmap reveals where price is likely to move to find necessary counterparties for large orders:
- Long Liquidations (Support): A massive cluster of stop-loss orders sits between $87,200 and $87,500. A break into this zone could trigger a cascade toward $85,000 before a technical bounce.
- Short Liquidations (Resistance): A significant cluster of short seller stops resides above $91,200. Breaking this level would trigger forced buybacks, providing fuel to challenge the $94,000 resistance.
Key Technical Levels
| Level Type | Price | Significance |
|---|---|---|
| Resistance 3 | $103,500 | Macro target / Psychological barrier |
| Resistance 2 | $96,911 | Rectangle High / Range Top |
| Resistance 1 | $91,500 | 50-day EMA / Bearish invalidation threshold |
| Intermediate Resistance | $90,500 | CME Gap / Intraday breakout point |
| PIVOT POINT | $89,500 | Intraday equilibrium / Fair Value |
| Support 1 | $87,400 | Range Low / Liquidation trigger |
| Support 2 | $82,000 | Major structural support |
| Support 3 | $74,000 | Macro support / Bullish line in sand |
Catalysts to Monitor
Several critical macroeconomic events could trigger the next directional impulse:
- FOMC Meeting (January 27-28, 2026): Consensus anticipates rates holding in the 3.50% – 3.75% range. Chairman Powell’s forward guidance will be decisive.
- Clarity Act: The legislative blockage of this regulatory framework maintains uncertainty and restrains institutional capital deployment.
- Treasury Yields: The 10-year rate around 4.23% maintains a high discount rate for growth assets.
Forecast Scenarios
Scenario A: Range Reclaim (40% Probability)
If the Fed maintains an accommodative stance and geopolitical tensions ease, Bitcoin could reclaim the $91,500 pivot and gradually climb toward the range high ($96,900). ETF outflows would cease and opportunistic buyers would enter around $88,000.
Scenario B: Flush and V-Shaped Recovery (35% Probability)
A break of the $87,400 support could trigger a liquidation cascade toward $82,000 – $84,000, followed by aggressive buying from long-term holders creating a rapid V-shaped recovery. This « maximum pain » scenario often marks the true bottom of a correction.
Scenario C: Bearish Continuation (25% Probability)
Regulatory crackdown combined with persistently elevated bond yields could lead to a sustained loss of $82,000 and slow erosion toward $74,000, invalidating the Supercycle thesis in the short term.
Conclusion: No-Trade Zone for Trend Followers
Bitcoin in January 2026 presents a classic dilemma: solid long-term fundamentals versus fractured short-term market structure. The $87,000 – $89,000 zone represents a strategic accumulation region for patient investors.
Strategic Recommendations:
- For Long-Term Investors: The $87,400 – $88,000 zone is favored for progressive capital deployment (DCA), with strict invalidation below $82,000.
- For Momentum Traders: Long positions only on confirmed H4 close above $91,500. Short positions viable on rejections at $90,500 with targets at $88,000.
The imminent FOMC meeting will likely serve as a catalyst to break this deadlock. Until then, capital preservation and patience remain essential.
⚠️ Important Disclaimer
This article is provided for informational and educational purposes only. It does not constitute financial, investment, or trading advice in any way. Cryptocurrency markets are extremely volatile and carry significant risks of capital loss. The technical analyses and forecasts presented here are based on historical data and do not guarantee future performance. Each investor must conduct their own research and consult a qualified financial advisor before making any investment decision. The author and cryptoinfo.ch disclaim all responsibility for any losses resulting from the use of this information.