
Ethereum (ETH) is currently navigating a critical phase of its market cycle, hovering around $2,950 after breaking below the major psychological support at $3,000. This comprehensive technical analysis examines multiple timeframes to understand the current market structure and identify strategic opportunities.
Macroeconomic Context: Tensions Weigh on Risk Assets
Ethereum’s technical weakness cannot be separated from the current geopolitical context. Transatlantic tensions regarding Greenland and threats of tariffs have reintroduced significant risk premium to financial markets. ETH, maintaining a high correlation with traditional risk assets, is experiencing downward pressure amplified by a strengthening US Dollar (DXY).
Spot Ethereum ETFs recorded net outflows of nearly $300 million in a single session on January 21st, signaling either capitulation or tactical hedging by institutional investors. This capital flight, combined with the Federal Reserve’s high rate environment, has created significant headwinds for short-term valuation.
The Fundamental Paradox: Record Usage vs Falling Prices
Paradoxically, while prices decline, the Ethereum ecosystem is experiencing remarkable structural expansion. Daily transactions have reached an all-time high of 2.5 million, propelled by massive Layer-2 adoption and stablecoin velocity. BlackRock explicitly identifies Ethereum as the undisputed leader in real-world asset tokenization, commanding a 66% market share.
This dislocation between price and utility creates a structural opportunity for investors capable of tolerating short-term geopolitical volatility. Institutional capital is deeply anchoring in Ethereum for settlement infrastructure, creating a fundamental floor invisible on hourly charts but essential for the medium term.
Multi-Timeframe Technical Analysis
Daily View: Symmetrical Triangle Breakdown
The daily chart reveals a symmetrical triangle structure broken to the downside in mid-January. After a sharp rejection from the $3,450 zone in December, ETH failed to maintain the bullish breakout above $3,300. The subsequent breakdown of the triangle’s lower boundary and the psychological $3,000 level confirms a « bull trap » scenario.
- Current Price: ~$2,950
- 100-day SMA: Price broke this dynamic support around $3,050, now acting as immediate resistance
- 200-day SMA: Located at $3,636, technically classifying the asset in a medium-term bear market
- RSI (14): At 41.6, entering bearish control zone but not yet oversold, leaving room for continued decline
- Ichimoku: Price dropped below the cloud (Kumo), validating the trend reversal
Theoretical Target: Technical theory suggests a price objective at the triangle formation’s base, around $2,600.
4-Hour View: Bearish Channel and Continuation Flag

On the H4 timeframe, the structure is defined by a series of descending highs and descending lows. The drop from $3,200 has transformed into lateral consolidation between $2,920 and $3,000, forming a classic « bear flag. »
The exponential moving average ribbon (EMA Ribbon) is deployed downward, acting as a dynamic ceiling. Each return to the $3,000-$3,020 zone meets resistance from the 50-period EMA. The H4 RSI oscillates around 43, showing a hidden bearish divergence where indicators cool without the price recovering significantly.
Key Level: An H4 close below $2,920 would validate the flag’s downside breakout, opening the path toward $2,850.
15-Minute View: Micro-Structure and Intraday Trading

The 15-minute chart reveals a bearish drift tendency during Asian and European morning sessions, with volatility spikes at New York open, often correlated with ETF flow data. Volume spikes are visible primarily on selling candles, indicating aggressive sellers while buyers remain passive with limit orders.
The rapid descent left inefficiencies (Fair Value Gaps) upward, around $3,010-$3,020, which algorithms often seek to fill before resuming the dominant trend.
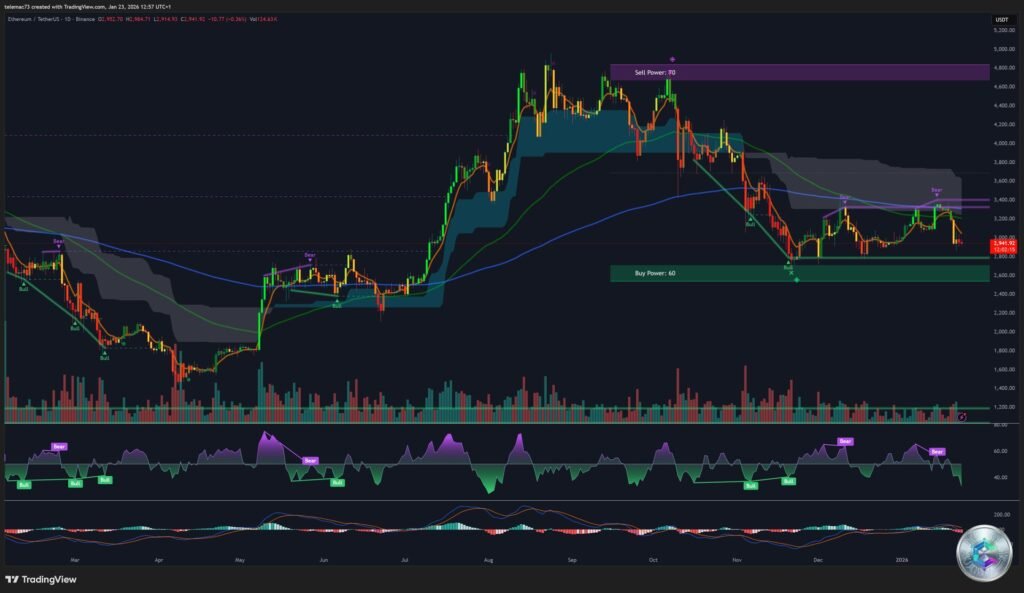
Order Book Analysis: The « Sell Wall » Revealed

The heatmap analysis reveals a critical order book configuration explaining ETH’s difficulty in reclaiming $3,000.
The Sell Wall at $3,000
A massive concentration of sell orders is strategically positioned between $2,982 and $3,000, representing approximately $77.6 million in Binance futures. This wall constitutes a « suppression barrier » where large entities (Market Makers or institutional funds) deliberately cap the price.
For buyers to regain control, they would need to absorb this entire supply, requiring massive buying volume or a powerful external catalyst.
Support Liquidity at $2,800
Conversely, immediate buying liquidity is thin at current levels. The first significant density of buy orders isn’t at $2,900, but lower, in the $2,800-$2,850 zone. « Whales » are patient and have positioned their safety nets at this major structural support.
Implication: The path of least resistance is downward, toward this liquidity reservoir. A quick wick to $2,800 to fill these orders before a rebound is a classic market manipulation scenario.
Critical Technical Levels
| Level | Price ($) | Significance |
|---|---|---|
| R3 | 3,300 | Reversal confirmation / Triangle high |
| R2 | 3,150 | Consolidation range high |
| R1 | 3,050 | Probable rejection zone / 100-day MA |
| Pivot | 2,995 | Intraday Bull/Bear demarcation line |
| S1 | 2,920 | H4 Flag low / Fragile support |
| S2 | 2,850 | Major Structural Support / Buy Wall |
| S3 | 2,750 | Capitulation Zone |
Fibonacci Retracements
Based on the November ($2,622) to December ($3,450) swing:
- 0.618 ($2,938): Current level – Critical defense zone
- 0.786 ($2,800): The « Golden Pocket » for strategic buying
- 1.000 ($2,622): November low – Ultimate support
Strategic Scenarios
Scenario A: « Liquidity Hunt » (55% Probability)
ETH continues to slide slowly under the weight of macro uncertainty and the sell wall. A violent wick crosses $2,900, touches the $2,800-$2,820 zone, triggering passive buy orders and liquidating late leveraged longs.
Strategy: Staggered limit buy orders between $2,800 and $2,840. Stop Loss below $2,740. Bounce target: $3,050.
Scenario B: Bearish Breakdown (30% Probability)
Worsening geopolitical news or Bitcoin falling below $87,000 triggers selling panic. The $2,800 support gives way, accelerating toward $2,622 or even $2,400.
Alert Signal: Daily close below $2,800 with significant volume increase.
Scenario C: V-Shaped Rebound (15% Probability)
Unexpected positive news allows buyers to absorb the $77M wall. Price quickly reclaims $3,000 and $3,050, forcing short sellers to cover (Short Squeeze).
Signal: 4H close above $3,050 with volume confirming the breakout.
Conclusion: Defensive Posture but Structural Opportunity
The comprehensive analysis of January 23, 2026, indicates that Ethereum is in a defensive short-term posture. The convergence of degraded macroeconomic sentiment, institutional capital outflows, and technical deterioration below $3,000 gives sellers tactical advantage.
However, it’s crucial to distinguish market noise from fundamental melody. The long-term thesis, supported by BlackRock and record transaction volumes, suggests current weakness is a valuation dislocation, not a model failure. The $2,600-$2,800 zone represents an accumulation opportunity for investors capable of tolerating geopolitical volatility.
Recommendation: Caution is warranted. It’s preferable to wait for the market to test deep liquidity around $2,800 before deploying significant capital for purchases. For active traders, selling bounces toward $3,000 remains the strategy offering the best mathematical expectation as long as the 100-day moving average isn’t reclaimed.
⚠️ Important Disclaimer: This article is provided solely for educational and informational purposes. It does not constitute investment advice, a buy or sell recommendation, or a solicitation to conduct transactions in financial markets. Cryptocurrency markets are extremely volatile and carry substantial risks of capital loss. Any investment decision must be made after consulting with a qualified financial advisor and taking into account your personal financial situation, investment objectives, and risk tolerance. Past performance does not guarantee future results.