
On this January 23rd, 2026, Bitcoin is navigating through a critical period of turbulence, trading around $89,500. The digital asset stands at a decisive crossroads, caught between a weakened short-term technical structure and ambivalent macroeconomic fundamentals. The cryptocurrency market is currently sailing through an « Extreme Fear » zone, with a sentiment index that has plummeted to 24, reflecting pervasive investor pessimism.
The Macroeconomic Context: Geopolitical Storm and Regulatory Uncertainty
January 2026 has been marked by several major events weighing heavily on risk asset markets. Trade tensions between the United States and the European Union, particularly surrounding negotiations concerning Greenland, have triggered a widespread « risk-off » movement. Contrary to the « digital gold » narrative, Bitcoin has reacted as a high-beta asset, showing a stronger correlation with technology indices like the Nasdaq than with traditional safe-haven assets.
The January 27th deadline holds paramount importance: the joint meeting between the SEC (Securities and Exchange Commission) and the CFTC (Commodity Futures Trading Commission) could redefine the regulatory landscape for digital assets in the United States. This meeting, led by Paul S. Atkins (SEC) and Michael S. Selig (CFTC), aims to harmonize cryptocurrency classification and establish a clear framework for the industry. The uncertainty preceding this event acts as a brake on investment, with institutional players preferring to wait before committing new capital.
Market Depth Analysis: The Heatmap Reveals Danger Zones
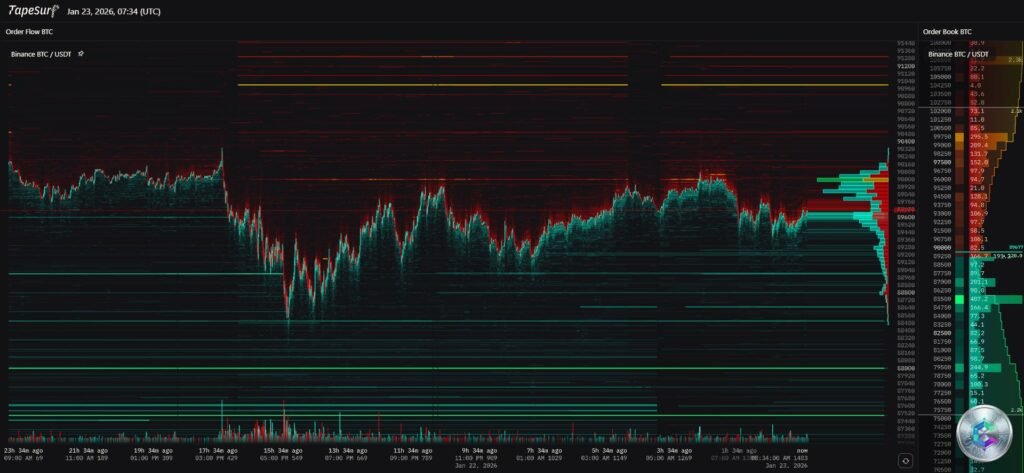
The liquidation heatmap analysis reveals two particularly critical magnetic zones for short-term price evolution. Just below the current price, around $88,000, lies a massive concentration of liquidity. This zone represents both institutional buy limit orders and, more dangerously, liquidation levels for heavily leveraged long positions.
The market has a natural tendency to « hunt liquidity. » If the price breaks $89,000 with volume, a liquidation cascade could precipitate the price toward $85,000-87,000 before a potential rebound. Above, the $90,000 barrier constitutes a major psychological and technical resistance wall, aggressively defended by sellers.
Multi-Timeframe Technical Analysis
15-Minute Chart: Intraday Volatility and Algorithmic Nervousness

The 15-minute timeframe reveals palpable market nervousness. Numerous downward wicks around $89,200, immediately bought back, indicate that trading algorithms are actively defending this micro-structural level. The intraday pivot sits at $89,700: as long as the price remains below, short-term traders favor short positions on rebounds. Volume spikes appear primarily on red candles, signaling more aggressive selling pressure than buying demand.
4-Hour Chart: Compression and Consolidation
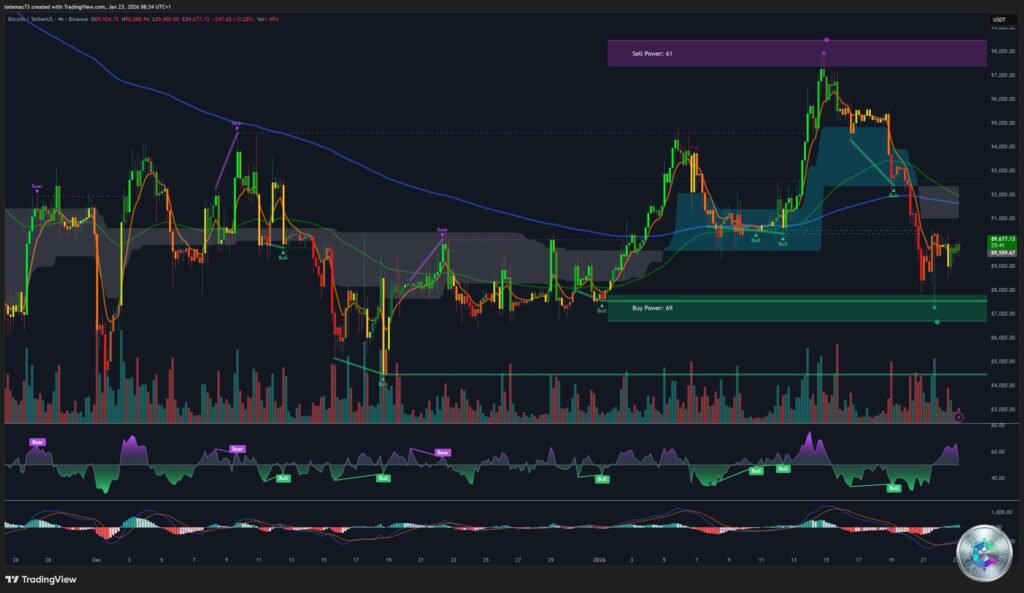
On the 4-hour scale, Bitcoin evolves within a slightly descending channel, typical of a compression phase before a violent move. Increasingly lower highs indicate sellers are progressively taking control. The RSI (Relative Strength Index) oscillates below the neutral 50 zone, unable to sustainably penetrate bullish territory. The MACD shows a timid bullish crossover attempt, but the histogram remains weak, testifying to buyers’ lack of conviction.
Daily Chart: Reversal Structure in Formation

The daily chart analysis reveals concerning structural signs. The price now evolves below the 50-day Exponential Moving Average (located around $90,298), which has shifted from dynamic support to resistance. A complex « Head and Shoulders » chart pattern is forming, with a critical neckline situated between $87,000 and $88,000. If this line were to be broken on a daily close, chart theory projects a technical target toward $74,000, corresponding to the head’s amplitude.
Some analysts also note a troubling similarity with the 2022 price structure preceding the major correction, suggesting that the current consolidation might only be a pause before another bearish leg.
On-Chain Flows: The Battle Between Distribution and Accumulation
On-chain data reveals a concerning dynamic in January 2026. Over 17,000 BTC were transferred to centralized exchanges within 48 hours, a behavior typically associated with selling intent. Long-Term Holders, who had accumulated during previous decline phases, have begun distributing their holdings, with approximately 68,650 BTC sold over the past 30 days.
Conversely, corporate demand continues to support the market, though its impact appears to be diminishing. MicroStrategy recently acquired an additional $2.1 billion worth of BTC, but these purchases no longer trigger the sustained rallies observed previously. The market seems to have integrated these acquisitions as a constant, reducing their catalytic effect.
Key Technical Levels to Monitor
| Level | Price (USD) | Significance |
|---|---|---|
| Resistance R3 | $92,500 | Potential short squeeze zone |
| Resistance R2 | $91,500 | Immediate decline invalidation |
| Resistance R1 | $90,298 | 50-day MA – Major dynamic resistance |
| PIVOT | $89,700 | Intraday tipping point |
| Current Price | ~$89,500 | Indecision zone |
| Support S1 | $88,800 | Top of buy wall |
| Support S2 | $87,500 | Neckline – Critical zone |
| Support S3 | $84,200 | Intermediate technical target |
| Support S4 | $80,000 | Major psychological support |
Forecast Scenarios
Scenario 1: Leverage Purge and Rebound (55% Probability)
The market slowly slides below $89,000, triggering a cascade of long liquidations toward $85,000-86,000. Institutional limit orders absorb this panic selling, and the price quickly rebounds in « V-Shape » to close above $88,000. Recommended strategy: place staggered buy orders between $84,500 and $86,500.
Scenario 2: Bearish Continuation toward 80k (25% Probability)
If the macroeconomic environment deteriorates (tension escalation or regulatory failure), a break of $87,500 with volume would validate the Head and Shoulders pattern. The price would then drift toward $80,000 where prolonged consolidation would take place. Strategy: cut long positions below $87,000.
Scenario 3: The « Bear Trap » and Recovery (20% Probability)
Unexpected positive news (explicit pro-crypto statement) allows the price to hold $88,500 forming a double bottom. A clear break of $90,300 would trigger a short squeeze toward $95,000. Strategy: buy only on confirmation of a 4H close above $90,500.
Conclusion: Patience and Discipline in a Fragile Market
The comprehensive Bitcoin analysis as of January 23rd, 2026 reveals an asset in temporary fragility within a secular bull market. Short-term technical signals are predominantly bearish or neutral, dominated by the loss of key moving averages and the threat of a reversal pattern. The heatmap confirms that immediate danger lies downward, with a high risk of liquidation cascade below $88,000.
For professional investors, patience remains the cardinal virtue of this sequence. It is inadvisable to anticipate the bottom in the current « No Man’s Land » zone (89k-90k). Prudence dictates waiting either for the liquidity purge toward 85k-86k to enter at favorable prices, or for confirmed reconquest of $91,500 to validate the bullish trend resumption.
Overall Bias: Short-Term Bearish / Medium-Term Neutral
Key Level to Watch: $87,500 – $88,000
⚠️ Important Disclaimer
This article presents a technical and fundamental analysis of the Bitcoin market for strictly educational and informational purposes. It does not constitute investment advice, a buy or sell recommendation, nor an incitement to trade. Cryptocurrency markets are extremely volatile and carry substantial risks of capital loss. Each investor must conduct their own research (DYOR – Do Your Own Research) and consult a qualified financial advisor before any investment decision. Past performance does not predict future results. The author and platform disclaim all responsibility for any losses resulting from the use of information contained in this article.