
In early 2026, Bitcoin is navigating through an intense consolidation phase between $90,000 and $98,000, characterized by extreme volatility compression. Our in-depth technical analysis reveals a market in a state of precarious equilibrium, where massive institutional flows through spot ETFs clash with American regulatory uncertainties. This rare configuration could trigger an explosive move in the coming weeks.
A Complex Macroeconomic Dynamic
The current macroeconomic context creates a paradoxical environment for Bitcoin. On one hand, the Federal Reserve maintains positive real interest rates with 10-year TIPS around 1.83%, theoretically increasing the opportunity cost of holding non-yielding assets like BTC. On the other hand, growing political tensions surrounding the Fed’s independence strengthen Bitcoin’s narrative as a non-sovereign and uncensorable asset.
U.S. inflation is progressively normalizing with CPI at 2.7% and Core CPI at 2.6% in December 2025, close to the Fed’s 2% target. This macroeconomic stabilization, combined with the closure of U.S. markets for Martin Luther King Jr. Day on January 19, could create reduced liquidity conditions favorable to increased volatility on crypto markets.
Post-Halving Supply Shock Meets Institutional Demand
Bitcoin’s fundamental equation in 2026 is dominated by an unprecedented structural imbalance. U.S. spot Bitcoin ETFs absorbed more than $1.5 billion over two days in mid-January, approximately $750 million per day. This demand literally crushes the daily issuance of new Bitcoins, estimated at only 450 BTC/day (approximately $43 million at current prices).
The ratio is staggering: ETF demand exceeds new supply by a factor greater than 17x. This massive absorption progressively drains the secondary market and creates conditions for mechanical price appreciation, independent of short-term sentiment.
Strategy’s recent acquisition of over $1 billion in additional Bitcoin illustrates this corporate accumulation strategy that acts as an artificial floor under the price. These companies become buyers of last resort during corrections, reducing downside volatility in the long term.
Multi-Timeframe Technical Analysis: A Bullish Continuation Setup
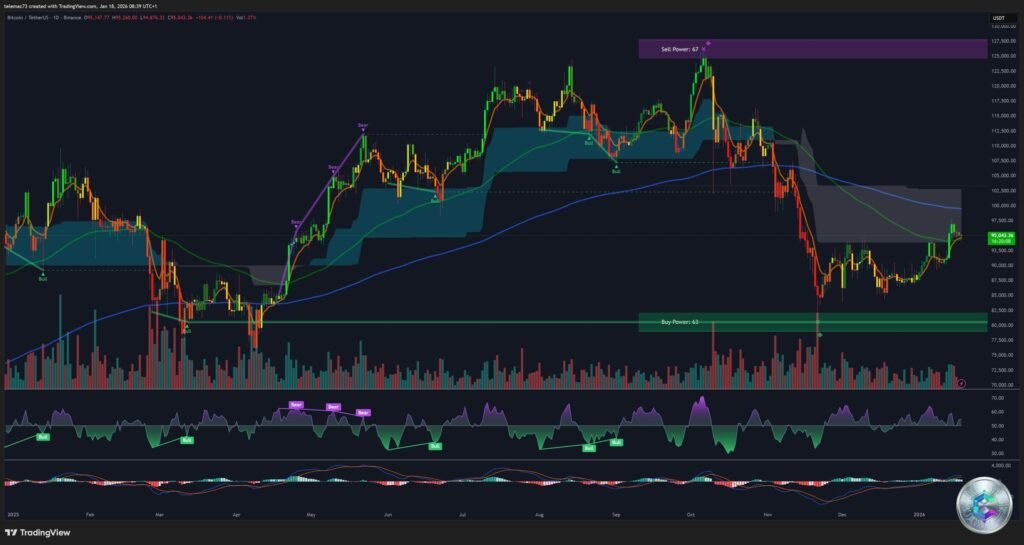
Daily View: The Underlying Trend Remains Bullish
On the daily horizon, the price structure displays a series of higher lows, a characteristic signature of sustained demand during corrections. The critical level to watch is the 21-day Exponential Moving Average (EMA 21), currently positioned around $91,200. This moving average acts as the « lifeline » of the bullish trend. As long as the daily closing price stays above, the momentum remains favorable to buyers.
The $98,000 zone constitutes a major resistance, corresponding to the psychological threshold near $100,000 and the cost basis of short-term holders who entered at the top (Short-Term Holder Realized Price). The market must absorb the supply from these participants seeking to exit at breakeven before it can continue its progression.
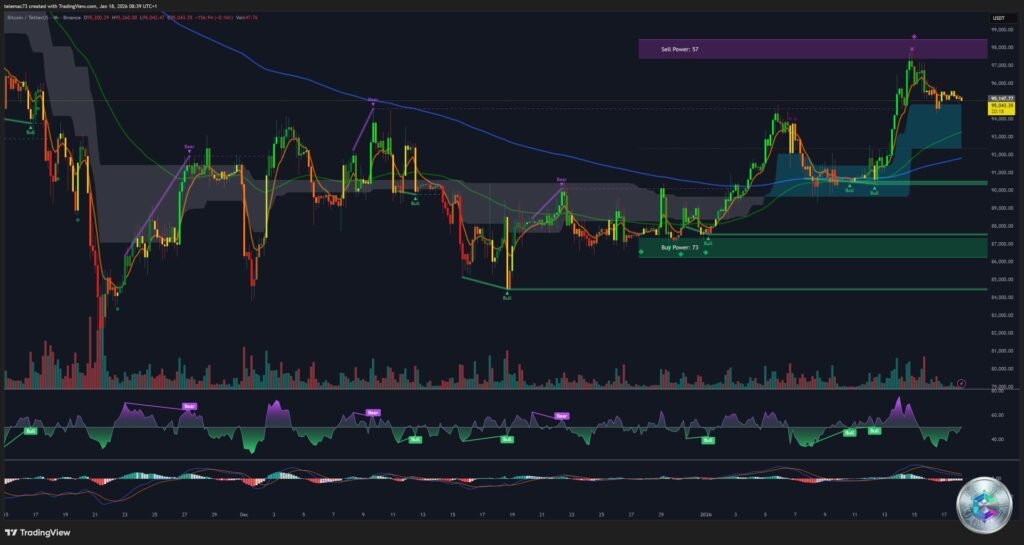
4-Hour View: The Bull Flag in Formation
Analysis of the 4-hour chart reveals a classic continuation chart pattern: a bull flag. After the rapid impulse that carried the price toward $97,800, Bitcoin is consolidating in a descending channel. This statistically buyer-favorable pattern suggests that a breakout of the flag’s upper line would project a theoretical target well beyond $100,000.
Bollinger Bands show significant tightening (Squeeze), an indicator historically predictive of explosive moves. The price is compressed between the intermediate support of $92,800 and the resistance at $96,000. Critical levels to watch are:
- $95,700: Local pivot level whose maintenance on a 4H close would signal continued strength
- $92,800 – $93,000: The bottom of the consolidation channel, whose loss would invalidate the short-term bullish scenario
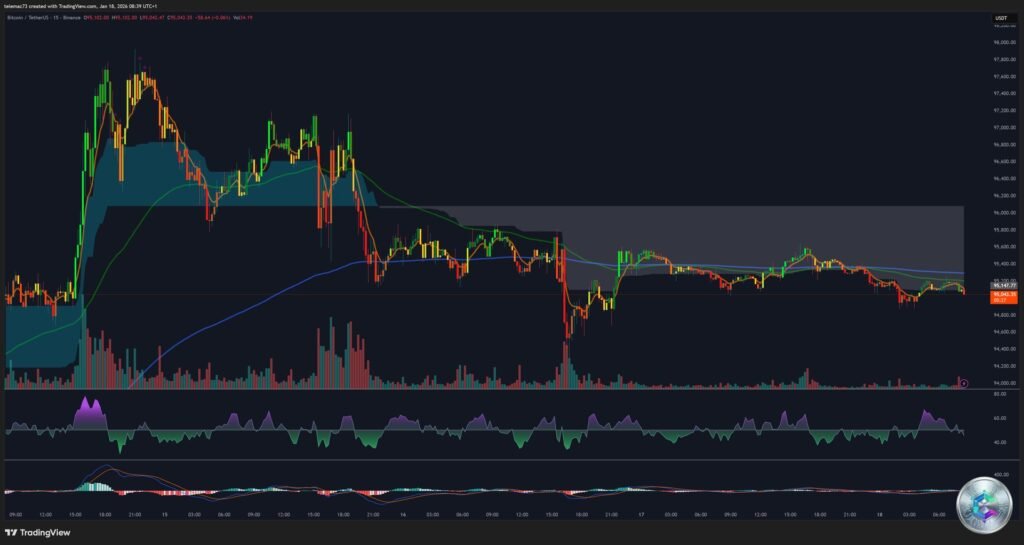
15-Minute View: Microstructure and CME Gaps
For intraday traders, the 15-minute chart reveals « choppy » behavior typical of waiting environments. Breakout attempts above $95,500 are quickly sold, while drops below $94,800 are bought back. Analysis of CME futures reveals unfilled price gaps that often act as magnets:
- Upper gap around $97,350: High probability of filling in the short term
- Lower gaps around $88,000 – $91,000: Potential targets in case of reversal
The Gamma Squeeze: An Explosive Threat for Sellers
The most critical aspect of the current analysis lies in a rare configuration on derivatives markets: market makers are currently in a « Short Gamma » position in the $95,000 – $104,000 zone.
How Does a Gamma Squeeze Work?
When market makers sell call options to speculators, they find themselves « Short Gamma. » To maintain their delta-neutral hedge, they must adjust their portfolio in real-time. If the price rises, their short exposure increases, forcing them to buy Bitcoin spot. This forced buying pushes the price even higher, increasing their hedging needs and triggering new purchases.
This positive feedback loop creates a vertical acceleration of price, often called a « melt-up. » The 45% reduction in open interest at the end of December « cleaned » the market, making the impact of these hedging flows even more significant.
Contrarian Signal: Negative Funding Rates
A powerful technical signal appears with negative funding rates on perpetual contracts, notably on Binance. This means short positions are paying long positions, indicating that the majority of speculators are betting on a decline.
In a bull market, negative funding rates are often a bottom indicator. If the price starts to rise (pushed by ETF flows or the Gamma Squeeze), these short positions will have to be bought back urgently, fueling a classic « Short Squeeze » that would add to the Gamma Squeeze dynamics.
Liquidity Heatmap: The Battle Zones
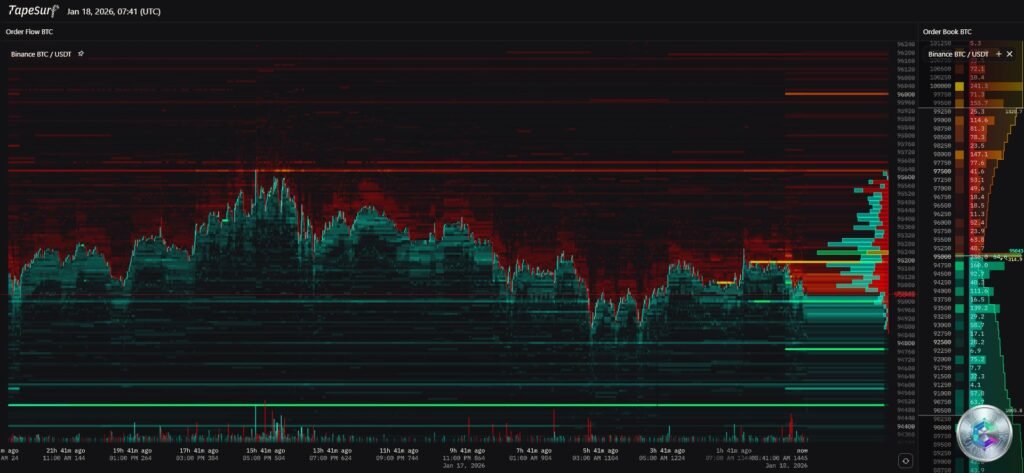
Analysis of market depth via the Heatmap reveals two critical zones:
The $90,000 Cluster: Massive concentration of buy orders and liquidation thresholds for leveraged long positions. This is a critical defense level. If the price violently crosses $90,000, it will trigger a cascade of liquidations. Data estimates that over $10.6 billion in long positions are at risk of liquidation if the price revisits the $84,000 zone.
The $98,000 – $102,000 Cluster: High density of sell orders acting as a natural brake on the upside. However, the asymmetry is notable: only about $2 billion in short positions are liquidatable up to $104,000, versus $10.6 billion in long positions around $84,000.
Forecast Scenarios
Scenario A: Institutional Breakout & Gamma Squeeze (Probability: 50%)
Thesis: ETF flows continue to absorb supply, price breaks $95,700 then attacks $98,000. The break of $98,000 triggers the Gamma Squeeze.
Trigger: Daily close > $98,000
Targets:
- TP1: $104,000 (End of Short Gamma zone)
- TP2: $113,000 (Fibonacci 1.618 extension)
- TP3: $130,000 (Long-term macro target)
Scenario B: Rejection and Stop Hunt (Probability: 35%)
Thesis: Regulatory uncertainty and weak macro weigh on sentiment. Price fails to pass $96,000 and pulls back.
Trigger: Break of $92,800 support and daily close < $91,200 (EMA 21)
Targets:
- S1: $90,000 (Psychological support)
- S2: $84,000 – $86,000 (« Max Pain » zone)
Scenario C: Stagnation and Compression (Probability: 15%)
Thesis: Market awaits a clear catalyst, oscillating in the 92k – 96k range with decreasing volatility.
Strategic Recommendations
For active traders and professional investors, the current posture should be one of « aggressive patience »:
- Entry Management: Avoid market buying in the middle of the range (94k-95k). Favor either buying on pullbacks toward $91,500 – $92,000 (with tight stop), or buying on confirmed breakout above $98,000.
- On-Chain Monitoring: Monitor ETF flows daily. As long as net inflows remain positive (>$200M/day), dips are buying opportunities.
- Key Indicator: Monitor the 21-day EMA (currently $91,200). This is the barometer of trend health. A sustained loss would justify reducing exposure.
- Stop-Loss Levels: For long positions, a stop below $90,000 limits losses in case of a bearish scenario.
Conclusion
Bitcoin in January 2026 is no longer a simple retail speculative asset; it has become a complex macro-asset influenced by real rates, banking regulation, and sophisticated derivative flows. The analysis suggests that considerable bullish pressure is accumulating beneath the surface, ready to be released as soon as the $98,000 lock breaks.
The convergence of a structural supply shock (post-halving), massive institutional demand (ETFs), and an explosive technical configuration (potential Gamma Squeeze) creates an asymmetric risk environment favorable to patient buyers. However, downside risks remain present, particularly around the critical $90,000 support.
The coming weeks will be decisive in determining whether Bitcoin can transform this resistance zone into a springboard toward new all-time highs or whether a deeper correction is necessary before the next bullish impulse.
Disclaimer: This article is published for exclusively educational and informational purposes. It does not constitute in any way investment advice, a buy or sell recommendation, or an incentive to trade. Cryptocurrency markets are extremely volatile and carry substantial risks of capital loss. Any investment decision should be made after consultation with a qualified financial advisor and based on your personal situation, risk tolerance, and financial objectives. Past performance does not predict future performance. Cryptoinfo.ch disclaims all responsibility for financial losses that may result from the use of information contained in this article.