
On January 14, 2026, Ethereum is showing remarkable performance with a rally of over 5% in 24 hours, pushing the price to around 3,300 USDT. This bullish surge places ETH in a crucial strategic position, directly under a major resistance zone. What lies ahead? Let’s dive into an in-depth technical analysis to understand the current market dynamics.
Market Overview
Ethereum maintains a short to medium-term bullish trend, but the recent impulse brings it directly under a significant seller liquidity zone visible across multiple timeframes. The overall bias remains bullish but extended, with a high risk of technical pullback.
Key levels to watch:
- Short-term pivot zone: 3,280-3,340 USDT – as long as price holds above, the intraday structure remains constructive
- Major swing supports: 3,050-3,100 USDT, then 2,650-2,850 USDT
- Major resistances: 3,350-3,400 USDT, then 3,600-3,800 USDT, and finally 4,600-4,900 USDT
Fundamental and On-Chain Context
Record Network Activity
Ethereum recorded its highest historical activity levels at the end of 2025 and early 2026. The network processed over 2.2 million daily transactions, with 48% growth in transaction volumes and more than 10.4 million monthly active addresses.
The volume of stablecoin transfers on Ethereum exceeded $8 trillion in Q4 2025 alone, nearly double that of Q2. This intensity of usage validates the current valuation over the long term, although very abrupt « network growth » peaks have historically preceded short-term blow-off corrections.
Massive Institutional Flows
Stablecoins and real-world assets (RWA) remain dominated by Ethereum, representing approximately 65-70% of global tokenized value. Major institutions like JPMorgan use Ethereum for tokenized money market funds.
Despite a few weeks of net outflows from spot ETFs, investment products linked to ETH recorded over $12.7 billion in inflows in 2025, representing a 138% increase year-over-year.

Daily Technical Analysis
Price Structure
On the daily chart, we observe a broad bearish movement from the 4,600-4,900 USDT peak that found a major bottom in the 2,600-2,800 USDT zone. This zone has served as strong support multiple times and corresponds to the bearish targets mentioned in on-chain analyses.
Since this bottom, ETH has built a rounded floor with ascending lows, coming back to test the former congestion zone of 3,300-3,600 USDT.
Moving Averages
- 50-day MA: rising toward 3,100 USDT and beginning to turn upward
- 200-day MA: slightly above price, in the 3,300-3,400 USDT zone, acting as the main dynamic resistance
The return to contact with the 200 MA after a violent rebound from 2,600-2,800 USDT signals a first trend reversal test. Historically, the first contact with this average often results in a consolidation phase.
Oscillators
Daily RSI: climbing from the 30-40 zone and now sitting in a neutral/positive regime (approaching 60), without extreme extension. Signals show a bullish series on lows, with some bearish divergences at former peaks.
MACD: bullish crossover with positive histogram, but already well advanced. Momentum remains bullish, but the risk of exhaustion increases near resistances.

4-Hour Analysis – Intraday Structure
Range Breakout
The 4h chart reveals a long sideways range between 2,850 and 3,050 USDT, which served as an accumulation base. The clean bullish breakout of this range, accompanied by significant volume, propelled the price toward 3,300-3,350 USDT.
Price now trades in a resistance zone around 3,350-3,400 USDT, corresponding to a former distribution structure.
Moving Average Dynamics
- 200 MA 4h: below price, around 3,050-3,100 USDT, acting as trend support
- 50 MA 4h: rising sharply toward 3,150-3,200 USDT
As long as price maintains above these averages, the dynamic remains clearly bullish.
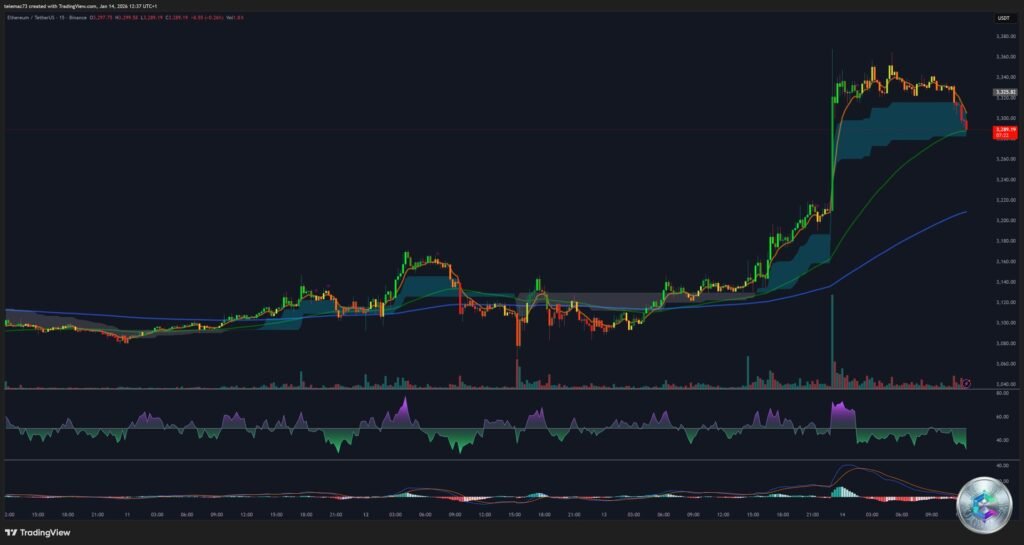
Intraday 15-Minute Analysis + Heatmap
Short-Term Structure
The 15-minute chart shows a long bullish drift phase between 3,100 and 3,200 USDT, followed by a vertical impulse propelling price toward 3,350 USDT with a significant volume spike.
Since this peak, we observe consolidation through a controlled pullback toward 3,300-3,320 USDT, with candles remaining mostly above the local value area.

Heatmap and Order Flow Reading
The heatmap reveals crucial liquidity information:
Above current price: several seller liquidity clusters between 3,340-3,380 USDT, then toward 3,420-3,500 USDT. These pockets can attract price but also constitute potential resistance walls.
Below price: large buy walls around 3,280 USDT, 3,250 USDT, then 3,200-3,220 USDT and 3,100-3,120 USDT. These zones indicate that market makers and large orders are looking to accumulate on dips.
Tactical Implications
- As long as 3,280-3,300 USDT holds, buyers maintain control and can attempt to re-attack 3,340-3,380 USDT
- A break below 3,280 USDT would likely open a flush toward 3,250 then 3,220-3,230 USDT
- A break below 3,200-3,220 USDT would transform the current move into a fake breakout, with risk of return toward 3,050-3,100 USDT
Probable Scenarios
Bullish Scenario (Continuation)
Condition: maintaining above 3,280-3,300 USDT with visible bid defenses, and absence of violent rejection at 3,350-3,380 USDT.
Expected development:
- Re-test and bullish breakout of 3,350-3,380 USDT
- Extension toward 3,450-3,520 USDT (4h targets)
- Potentially 3,600-3,800 USDT if BTC remains solid
Invalidation: repeated 4h closes below 3,250 USDT, then passage below 3,200 USDT.
Corrective Scenario (Prudent)
Condition: clear rejection of the 3,350-3,400 USDT zone with strong seller absorption and break of 3,280 then 3,200 USDT.
Expected development:
- Stair-step pullbacks on supports 3,200 → 3,050-3,100 → 2,850-2,950 USDT
- If 2,850 USDT breaks on daily, possible acceleration toward 2,600-2,800 USDT
Invalidation: daily closes above 3,600 USDT, indicating a true bullish trend resumption.
Operational Conclusion
The underlying trend remains bullish but in a transition phase. ETH is breaking out of a significant range and testing its first major structural resistance zone. The 3,280-3,340 USDT zone represents the battlefield in the very short term.
Strategic zones for swing trading:
- Defensive buy: on pullbacks toward 3,050-3,100 USDT, invalidation below 2,900 USDT
- Aggressive buy: on rejection of 2,850-2,950 or 2,600-2,800 USDT in case of deep correction
- Progressive profit-taking: between 3,350-3,400, then 3,450-3,520 and 3,600-3,800 USDT
On-chain metrics and institutional adoption (massive staking, tokenization, ETFs) remain very positive for 2026, but several analyses also point to a consolidation risk toward 2,600-2,800 USDT before a more sustainable recovery.
⚠️ Important Disclaimer
This analysis is provided for educational and informational purposes only. It does not constitute investment advice or a buy/sell recommendation. Cryptocurrency markets are extremely volatile and carry significant risks of capital loss. Always conduct your own research (DYOR) and consult a qualified financial advisor before making any investment decision. Cryptocurrency trading may not be suitable for all investors.