


Bitcoin is moving through one of the most catalyst-dense stretches of its recent history this August 2026: thinning liquidity, record correlation with Wall Street, a security earthquake around self-custody, and internal fractures over the protocol’s future. Here is a complete read of the market, combining fundamentals, order-book microstructure and multi-timeframe technical analysis.
A market on macro life support
The Bitcoin ecosystem is going through a severe liquidity contraction — a genuine « summer lull » during which daily volumes on top-tier exchanges have fallen to roughly $4 billion. In a structurally thinner order book, even modest flows are now enough to generate outsized price swings, leaving the asset particularly exposed to sudden directional shocks.
This fragility is amplified by a growing interdependence with traditional equity markets: Bitcoin’s correlation with the S&P 500 now stands at a historically high 84.5%. Weakness across traditional indices, fuelled by geopolitical and monetary uncertainty, is therefore weighing directly on BTC’s price and neutralising any attempt at a bullish decoupling. Institutional investors have adopted a defensive stance, awaiting decisive macro catalysts — chief among them the next U.S. Consumer Price Index (CPI) release, where a hotter-than-expected reading would push back expectations of Federal Reserve easing.
On top of this sits an unusual geopolitical risk premium: developments around a U.S. military operation in Venezuela, and the possibility of American control over local oil reserves, introduce additional uncertainty for global inflation expectations — a factor traditionally supportive of Bitcoin’s store-of-value narrative, though its short-term effects remain unclear.
Institutional flows and the regulatory battle
The market’s institutional structure shows a striking dichotomy. On one side, world-class players — Abu Dhabi’s sovereign wealth via Mubadala, Edelman Financial, Tudor Investment — continue to hold colossal Bitcoin positions, confirming its status as a top-tier store of value; global crypto inflows reached $47.2 billion across 2025. On the other, short-term tactical flow remains driven by risk aversion: U.S. spot Bitcoin ETFs recorded net outflows of roughly $145 million on August 10, ending a seven-session streak of positive inflows that had totalled over $750 million.
This flow reversal is directly tied to legislative uncertainty. The « Clarity Act, » the year’s most anticipated regulatory catalyst aimed at clarifying jurisdiction between the SEC and the CFTC, has suffered a significant delay: the Senate’s procedural vote has now been pushed to September 15, 2026, amid complex negotiations over conflicts of interest for officials holding digital assets. This delay keeps the regulatory risk premium elevated, explaining part of the profit-taking seen on ETFs.
The Coldcard exploit: a crisis of confidence in self-custody
No read of the August 2026 market would be complete without the shockwave triggered by the exploit of Coldcard hardware wallets, made by Canadian firm Coinkite. Since July 30, a critical vulnerability has been actively exploited: a firmware flaw dating back to March 2021 caused the hardware random number generator to fail, forcing the device to fall back on a deterministic software generator. The result: theoretical 128-bit security collapsed to roughly 40 bits on some devices, allowing attackers to reconstruct recovery phrases offline, without ever needing physical access to the wallet.
Losses are substantial: according to Galaxy Research and TRM Labs, the attack unfolded across at least four waves, for an estimated total of 1,367 to 1,816 BTC ($89–116 million) stolen from more than 5,200 addresses. A limited portion of the funds has already been routed through mixers such as Wasabi. The episode makes July 2026 the second-worst month of the year for crypto theft, with $247.4 million siphoned off in total.
Beyond the financial hit, it’s the founding maxim « Not your keys, not your coins » that is being shaken: retail investors are, in effect, trading an exchange’s counterparty risk for a hardware and firmware vulnerability risk at the source. Paradoxically, this crisis is acting as an accelerant for financialisation: wealthy holders, unsettled by the complexity of auditing their own cold-storage devices, are increasingly turning to regulated ETFs and institutional custody solutions offering multi-party governance, regular audits and insured recovery procedures.
Protocol fractures: BIP-110 and the eCash hard fork
The Bitcoin network, which has seen no major consensus change since Taproot activated in late 2021, faces two forking events this month that crystallise deep ideological tensions.
The BIP-110 soft fork aims to drastically limit arbitrary data inscribed on-chain (Ordinals, Inscriptions, Runes) to preserve the network’s lightness. The signalling window opened at block 961,632 (~August 9) and closes at block 963,647, with the activation threshold lowered to 55%. Despite this reduced bar, miner support remains thin, hovering around 2% and driven almost entirely by the Ocean pool — a broad rejection that raises the risk of a minor chain split, though with negligible expected impact on regulated products.
The eCash hard fork, led by Paul Sztorc and LayerTwo Labs, is set to split off at block 964,000 (~August 21) to introduce Drivechains (BIP300/301) and advanced sidechains. The main flashpoint: the unilateral reallocation of roughly 500,000 dormant bitcoins historically linked to Satoshi Nakamoto — a move sharply criticised by institutional players such as Fidelity Digital Assets, who view it as a dangerous precedent for immutability and property rights. For custodians and exchanges, the fork requires meticulous technical preparation, including replay protection and tax handling of distributed tokens.
Microstructure: what the order-book heatmap reveals
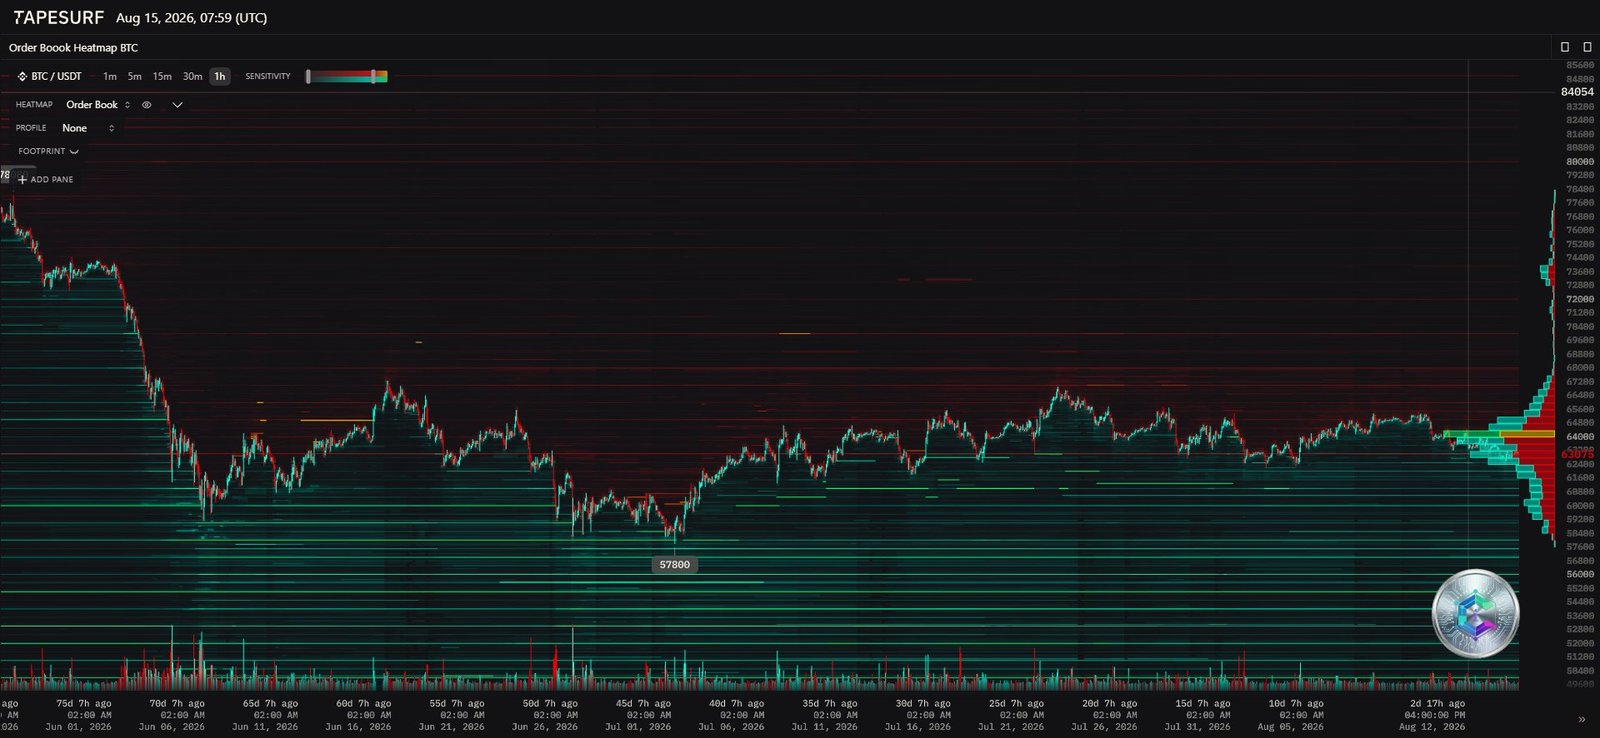
Analysing the order book through a heatmap offers a level of granularity plain candlesticks cannot match. Above the current spot price (around $63,075), the heatmap reveals a particularly dense scarlet-red sell wall starting near $64,000 — the signature of systematic distribution by market makers and institutions on every rally attempt. It would take a positive liquidity shock, such as a surprise regulatory approval or an accommodative monetary pivot, to absorb this supply.
Conversely, buy-side liquidity is progressively thickening below $62,000, with a massive institutional capitulation floor located around $57,000. The Point of Control (POC) from the volume profile sits within the tight $63,000 band, acting as a psychological magnet. The market is effectively squeezed between a dense sell wall and a solid buy-side floor — a classic setup that typically precedes a directional expansion in volatility.
Multi-timeframe technical read
Daily chart (D1): consolidation under pressure
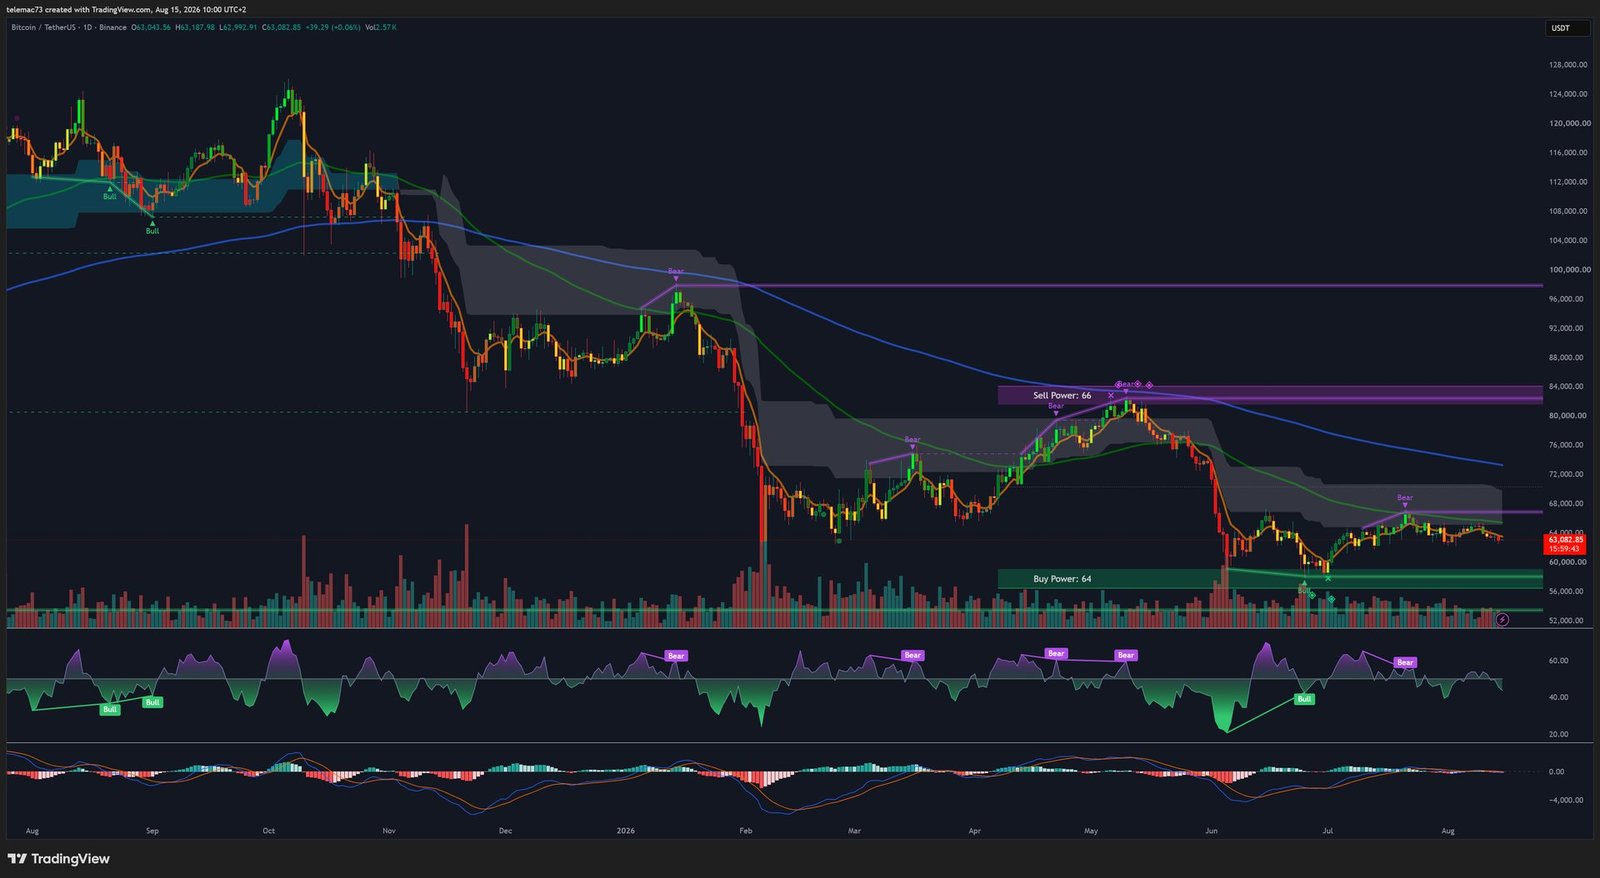
The daily chart shows an extended bearish consolidation structure, with the market trying to carve out a bottom within a key institutional value zone. The cycle’s major support is defined by the « Buy Power: 64 » block, broadly around $60,000: holding it is an absolute technical imperative for buyers, as any daily close below would open the path toward the $57,000 buy wall. Conversely, the main obstacle to a sustained bullish recovery sits in the « Sell Power: 66 » zone, between $80,000 and $84,000.
On the oscillator side, the daily RSI, having recently plunged into extreme oversold territory, is starting to curve slightly higher, hinting at fading selling pressure. The MACD, while still negative, shows a contracting histogram and a signal line about to cross from below — a setup that has historically, at times, preceded an accumulation phase, pending confirmation from volume.
4-hour chart (H4): bear flag under resistance
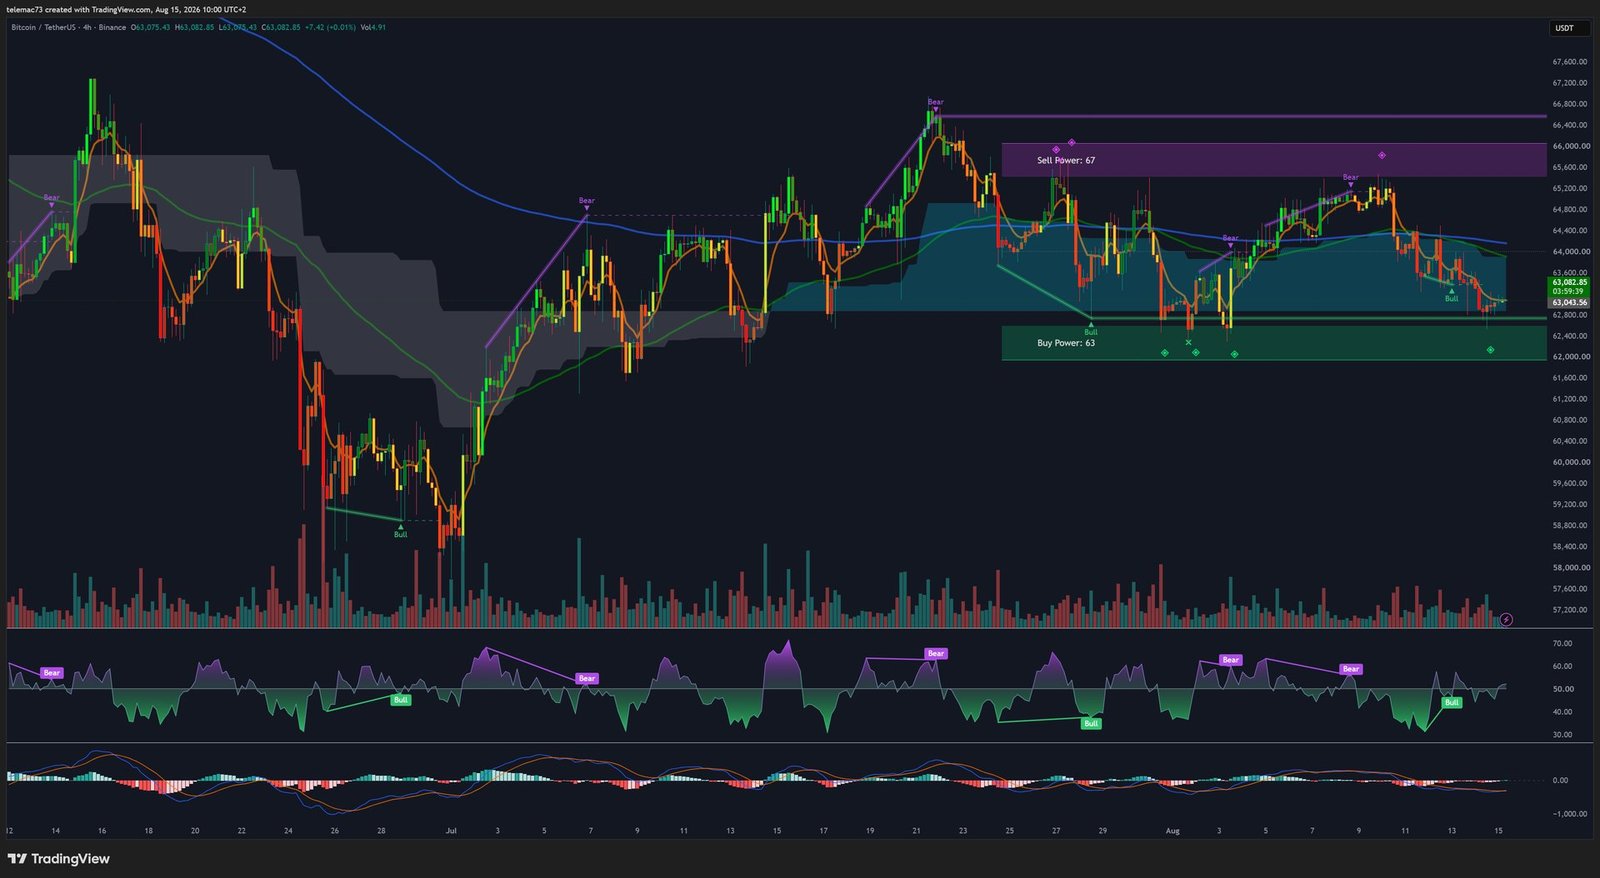
On the 4-hour timeframe, price is confined within a narrow descending channel forming a textbook Bear Flag. The upper boundary is locked by the « Sell Power: 67 » resistance ($64,500–$65,500), aligning tightly with the heatmap’s sell walls, while the lower boundary rests on the « Buy Power: 63 » support ($62,000–$63,000). The moving average crosses price from above, acting as a dynamic ceiling.
The technical picture here is notably more pessimistic than on the daily: the RSI is printing a series of lower highs and lower lows without managing to reclaim the 50 line, while the MACD has just confirmed a bearish crossover (Death Cross) near the zero line. This configuration reinforces the statistical odds of a downside break of the bear flag.
15-minute chart (M15): algorithmic trench warfare
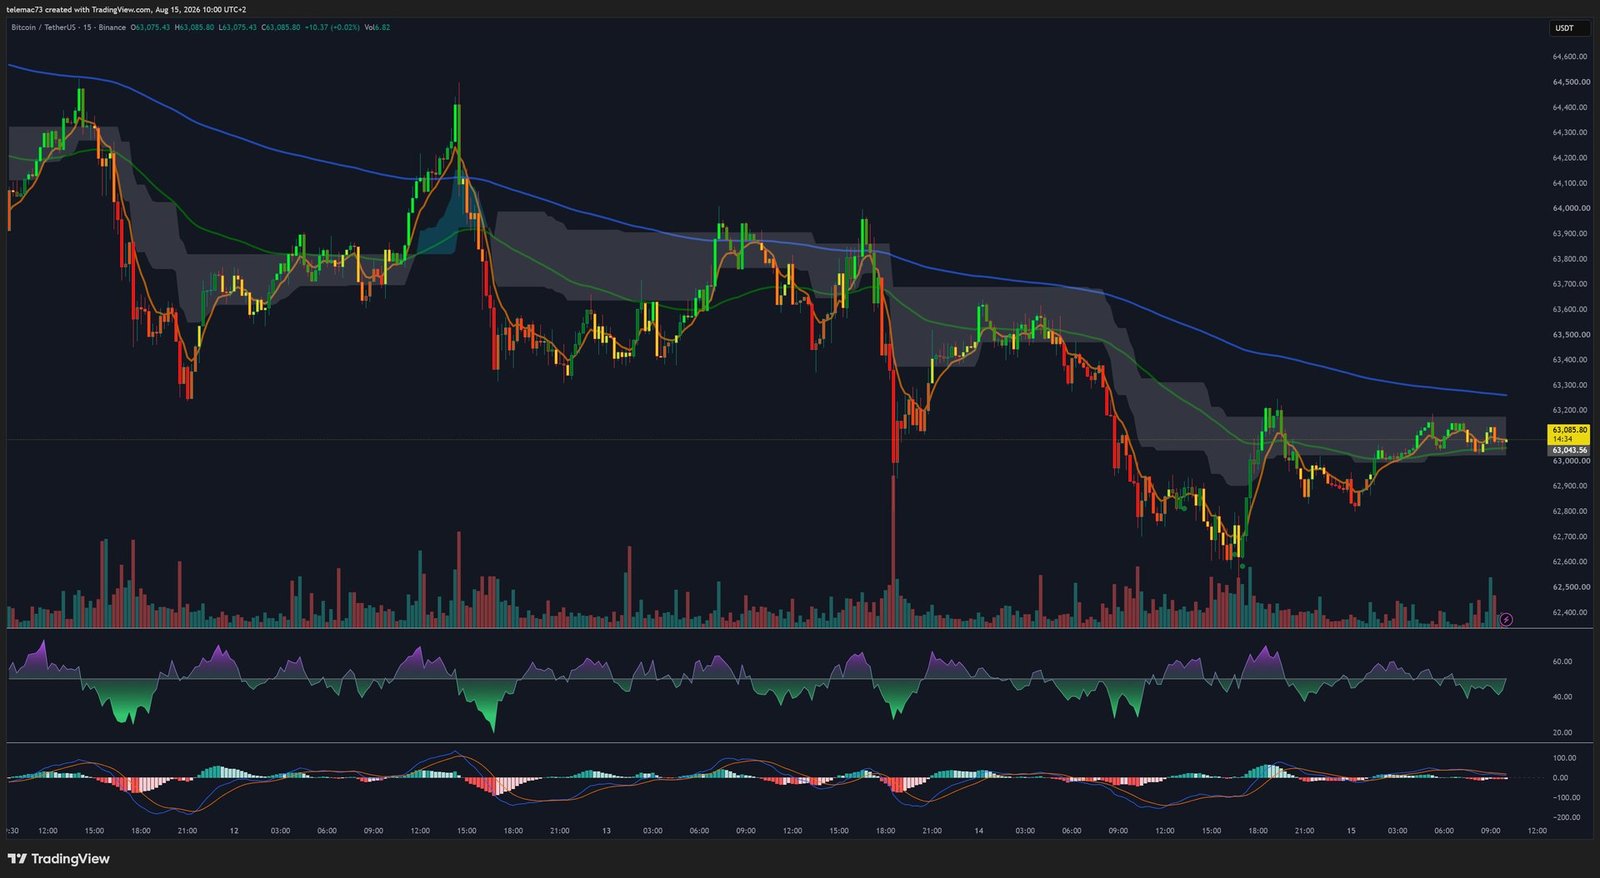
Intraday, the market recently suffered a sharp break below $62,500 accompanied by a volume spike, typical of a liquidity sweep designed to flush over-leveraged long positions. Price then staged a V-shaped recovery, a sign of active dip-buying. The structure of recent candles is tracing an Asymmetric Compression Triangle — lower highs, higher lows — usually a precursor to an imminent breakout. A break above $63,200 would invalidate the local bearish structure, while a break below $62,800 would likely trigger a fresh test of the H4 support.
Key levels to watch
- Macro-cycle resistance: $80,000 – $84,000 (D1, institutional cycle wall)
- Intermediate resistance: $64,500 – $65,500 (H4 / Heatmap, bear flag ceiling)
- Intraday resistance: $63,200 – $63,500 (M15, triangle boundary)
- Point of Control (POC): $63,000 – $63,100 (Heatmap)
- Intraday support: $62,500 – $62,800 (M15)
- Intermediate support: $62,000 – $63,000 (H4, flag base)
- Macro-fundamental support: $60,000 – $62,000 (D1, long-term bull market line)
- Extreme capitulation support: $57,000 (Heatmap, deep buy-side liquidity)
Synthesis: a market caught in a vice
The convergence of multi-timeframe chart analysis, order-book reading and an unstable fundamental backdrop points to implications that go beyond simple price action. The extreme short-term compression is not random noise — it reflects a paralysis among market participants facing simultaneous headwinds: a self-custody confidence crisis, an uncertain regulatory calendar, and protocol-level fractures.
The Coldcard crisis is notably dampening wealthy holders’ natural impulse to move bitcoins into cold storage, redirecting attention toward ETFs — whose institutional infrastructure positions them as preferred vehicles for the next wave of capital, despite recent net outflows. Meanwhile, protocol-level turbulence (miners’ rejection of BIP-110, hostility around the Satoshi-linked coin reallocation via eCash) imposes a silent risk premium: institutional custodians often freeze fund movements around critical blocks, further drying up spot liquidity.
Finally, the $64,500 resistance on H4 is reinforced by the asymmetry of macro and legislative information: the Clarity Act vote’s delay to September 15, combined with the wait for U.S. inflation data, is pushing market makers to pull liquidity and stack protective sell orders. The market remains, in effect, hostage to the U.S. political and monetary calendar.
Ultimately, Bitcoin sits at a technical crossroads this August 2026: a 4-hour bear flag compressed above a major macro support, with daily indicators tentatively hinting at fading selling pressure. The depth of the heatmap’s resistances, combined with equity-market correlation and the security and regulatory shocks, suggests the path of least resistance remains tilted to the downside — or, at minimum, confined to a prolonged consolidation. A break of $60,000 would open the door toward $57,000, while reclaiming $65,000 would require an exceptional alignment of macro and regulatory catalysts.
Disclaimer: this article is provided for educational and informational purposes only. It does not constitute investment advice, a recommendation to buy or sell, or a solicitation to trade any financial instrument. Cryptocurrencies are highly volatile and risky assets. Always do your own research (DYOR) and consult a licensed financial advisor before making any investment decision.

