


The Bitcoin market is going through a delicate phase of transition and macroeconomic consolidation this July 2026. After a 33% correction from its October 2025 all-time high, the asset found an annual low near $58,000 at the end of June, before attempting a tentative stabilization. Cross-referencing high-frequency charts, order book data, and the macroeconomic backdrop now allows for a precise picture of the capital flows currently at play.
Multi-timeframe structure and chart signals
The daily chart (1D): underlying trend under pressure
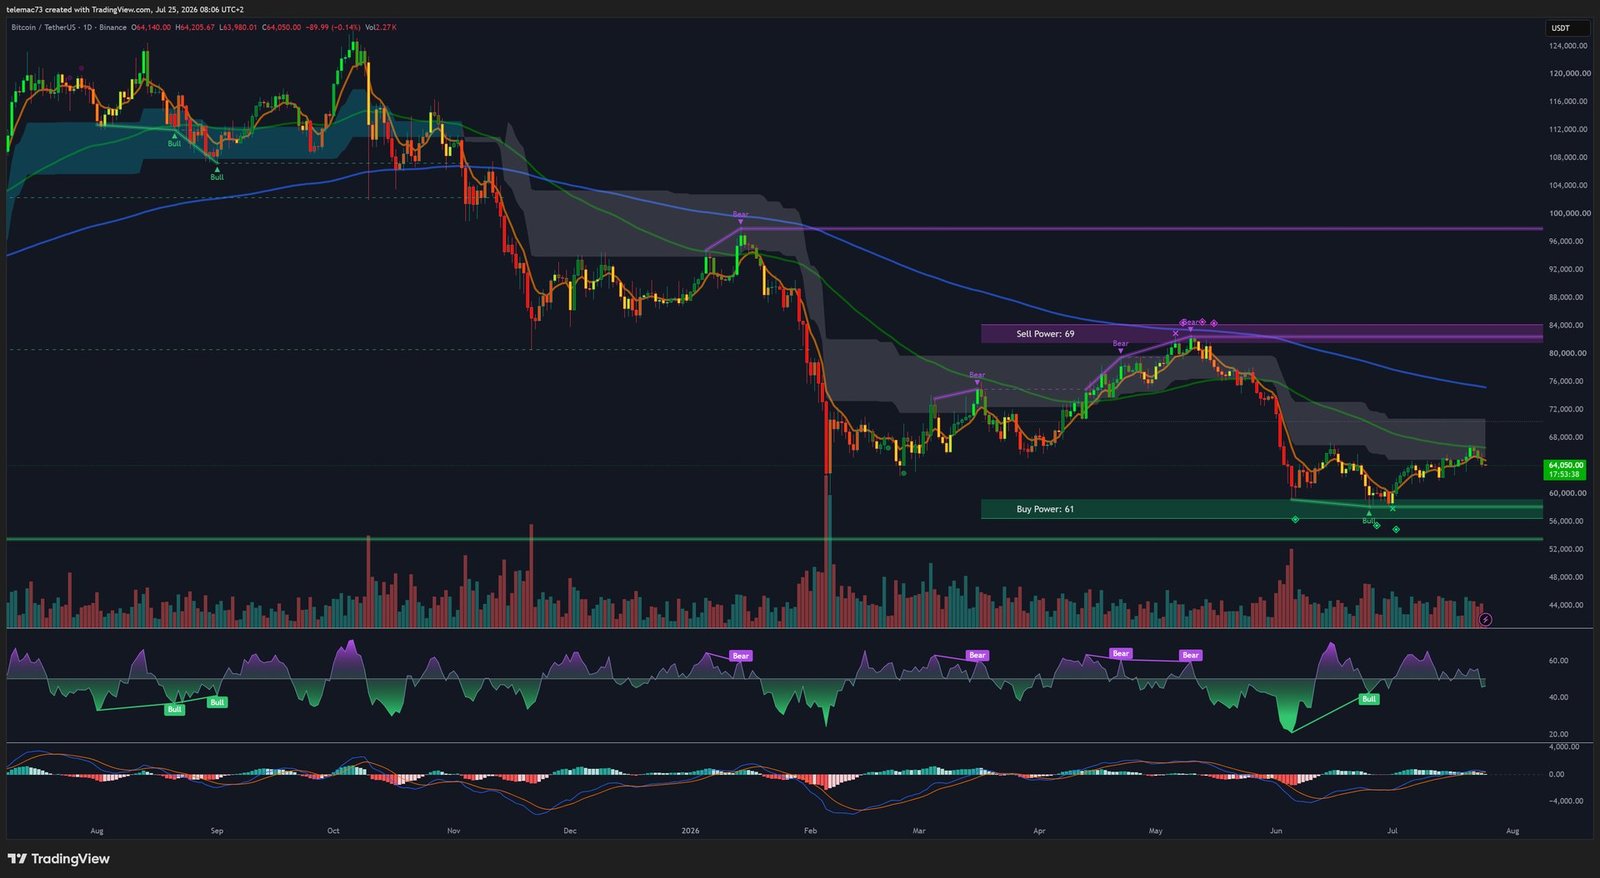
The daily chart reveals a technical environment dominated by a long-term corrective structure. A major weakness signal, in the form of a historic bearish crossover (a Death Cross), materialized in late spring 2026 when the 50-day exponential moving average (EMA 50) crossed below the 200-day exponential moving average (EMA 200). Since that event, price has traded beneath both trend indicators, with the EMA 200 acting as a major dynamic barrier around $74,000.
The recent technical bounce initiated from the key $58,000 support ran into resistance at the daily EMA 50, which coincides with the $65,000–$65,600 zone. This technical rejection was confirmed by the daily Relative Strength Index (RSI), which flashed a bearish « Bear » signal below its neutral zone, evidencing buyers’ inability to sustain a lasting upward impulse. The daily chart also highlights a major long-term accumulation zone labeled « Buy Power: 61 » between $56,000 and $58,000, while the main distribution zone, « Sell Power: 69, » sits considerably higher, between $81,000 and $84,000.
The intermediate chart (4H): rejection and the return of bearish momentum
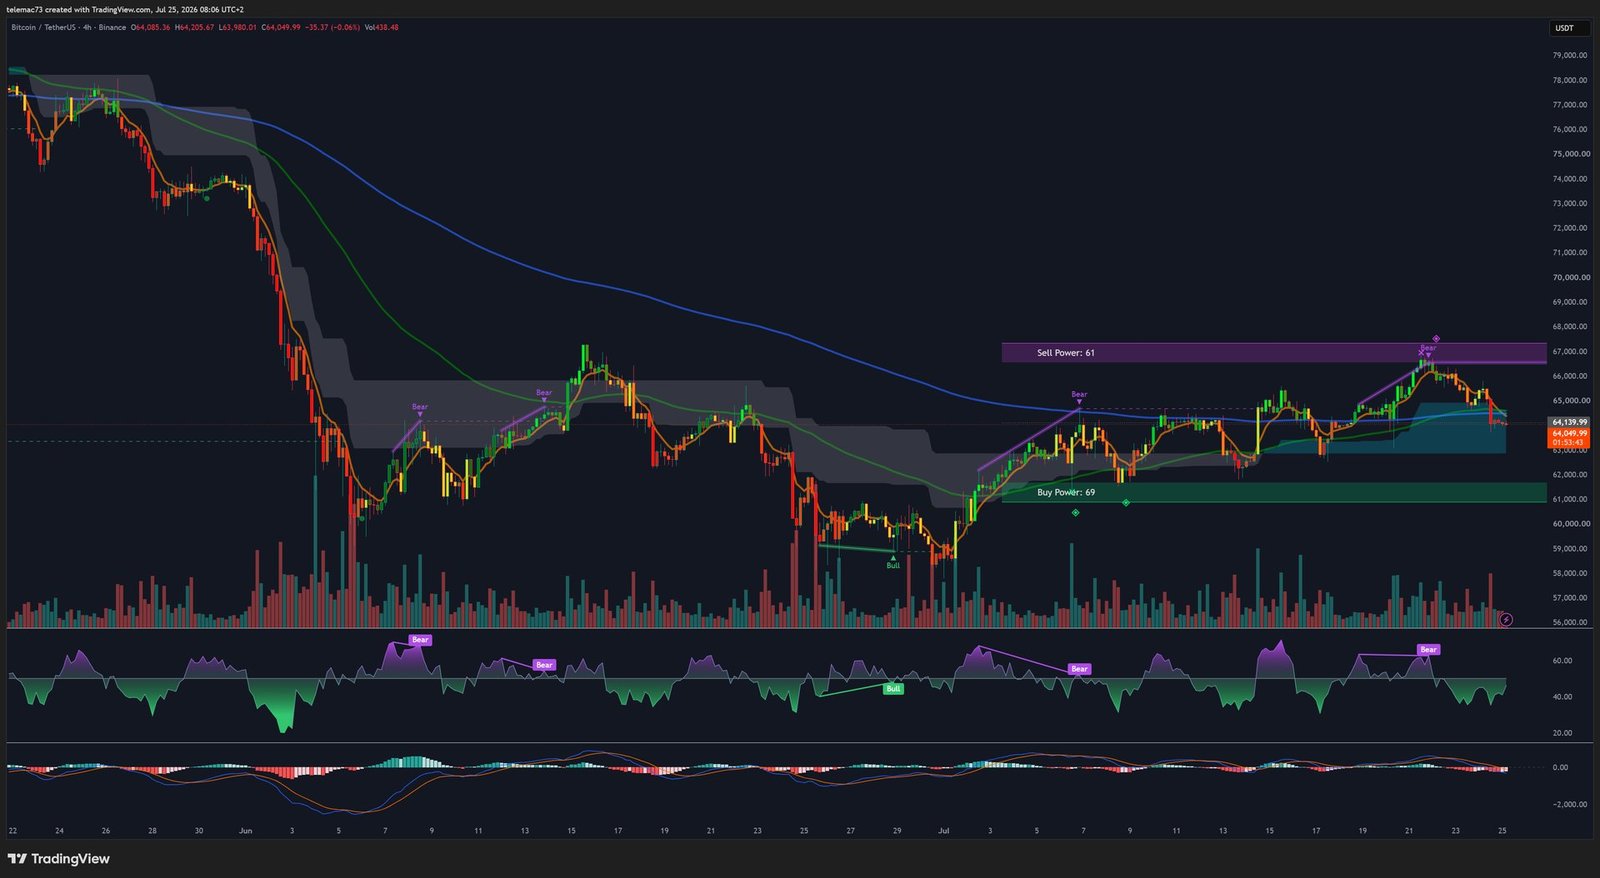
On the 4-hour horizon, the short-term structure shows a rapid deterioration of the bullish dynamic observed in mid-July. After briefly breaking above the reference EMAs, price suffered a sharp rejection below the intermediate « Sell Power: 61 » resistance zone, spanning $66,000 to $67,500, falling back toward $64,050.
This reversal had been anticipated by a bearish divergence on the 4H RSI, whose reading now sits around 40, heading toward the oversold zone. The most concerning signal, however, comes from the MACD, which confirmed a clear bearish crossover above its zero line: the widening red histogram confirms intensifying selling pressure and suggests a likely return toward the « Buy Power: 69 » support zone, between $60,500 and $61,500.
The intraday chart (15M): compression channel and bear flag risk
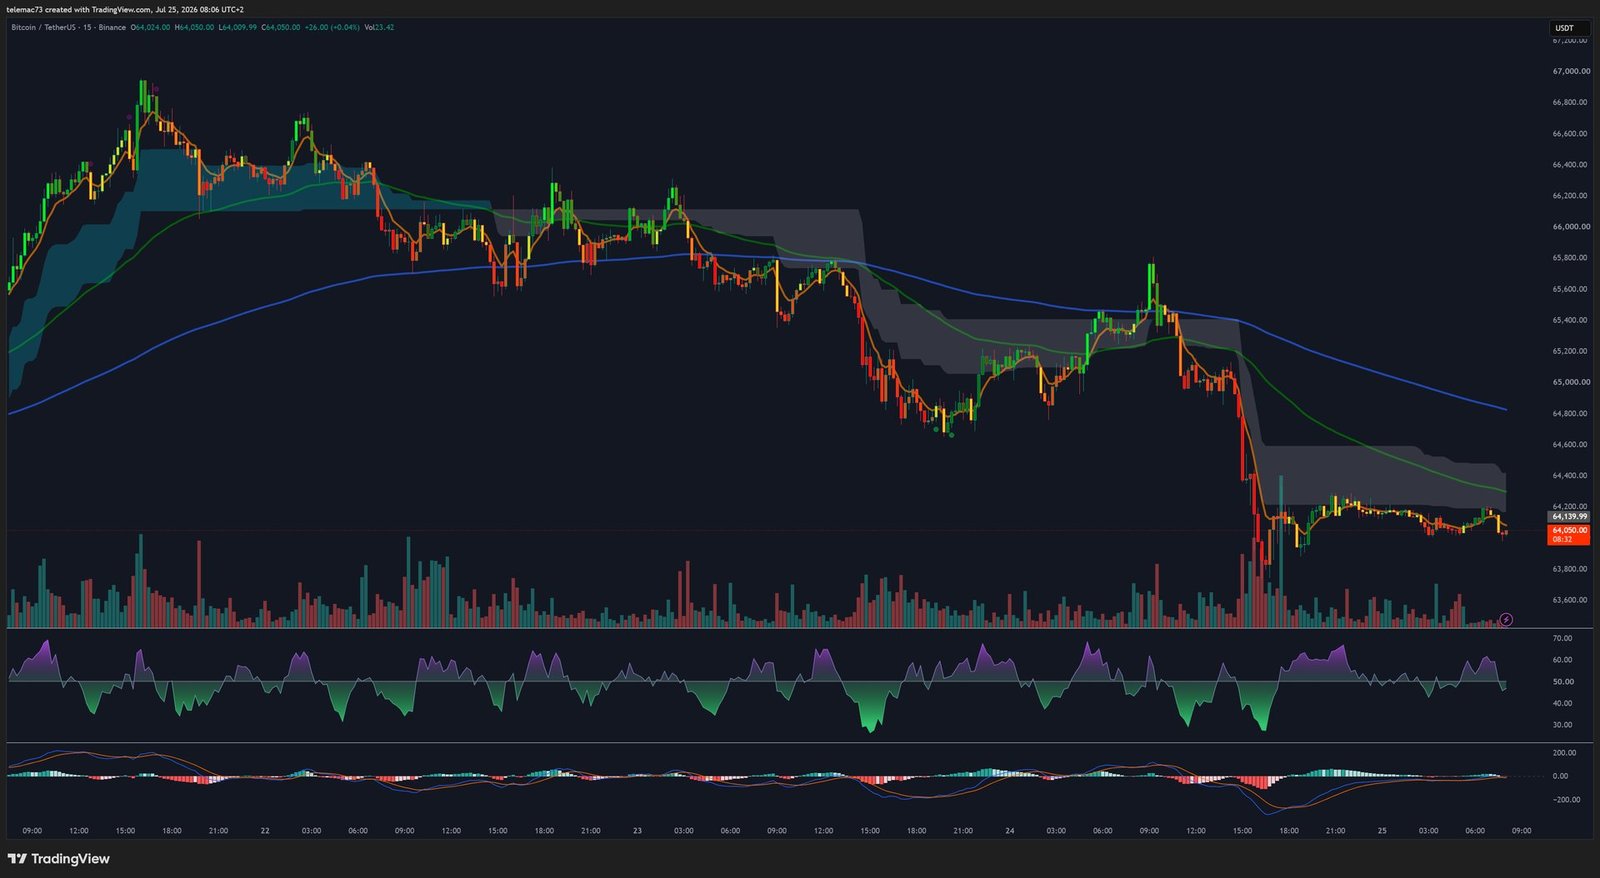
The 15-minute chart details the precise dynamics of the recent decline. Following a rapid drop from $66,200 on July 23, the EMA 50 crossed below the EMA 200, triggering an intraday Death Cross that keeps price under pressure.
Since this drop, Bitcoin has been trading within a narrow horizontal channel, bounded by $63,800 and $64,300, resembling a short-term continuation Bear Flag. During the initial capitulation, the 15M RSI reached deeply oversold levels (below 30) before recovering toward a neutral reading near 48, aided by this sideways drift. The MACD, meanwhile, has flattened around the zero line, reflecting a temporary drop in volatility ahead of the next directional impulse.
Liquidity mapping and order book structure
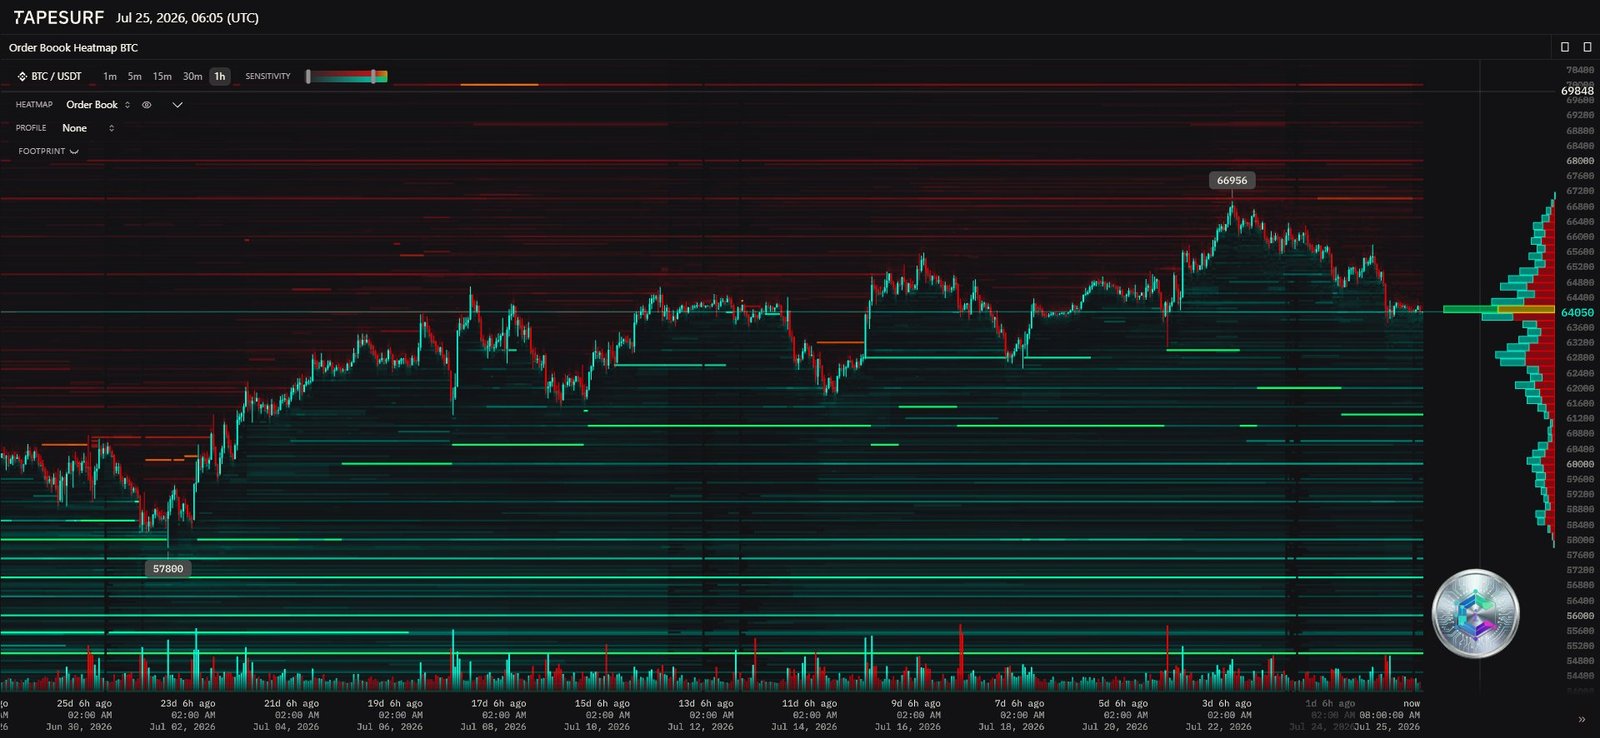
Analysis of the order book heatmap provides essential insight into the positioning of institutional investors and market makers. Bitcoin’s price currently sits very precisely around a major High Volume Node at $64,050. This level, marked by an ultra-prominent horizontal bar on the volume profile, acts as the Point of Control (POC) and the immediate pivot of attraction for the asset.
Above this Point of Control, limit sell orders (asks) thicken as they approach $66,956 and extend in successive walls up to $69,848. This build-up of sell orders limits the room for a rapid advance and confirms that any rally toward $67,000 will meet strong distribution pressure. Conversely, market support is structured lower down, with significant blocks of limit buy orders (bids) positioned around $57,800 and reinforcing continuously down to $56,000. This defensive positioning shows that large buyers prefer to wait for a pullback toward the long-term support levels rather than actively accumulating at current prices.
Technical summary across timeframes
The table below summarizes the key indicators and chart setups observed across the different timeframes analyzed:
| Timeframe | Price level (USD) | EMA 50 / 200 | RSI | MACD | Active setup |
|---|---|---|---|---|---|
| Daily (1D) | $64,050 | Death Cross established; EMA 50 resistance at $65,631 | Neutral-bearish (~49.7); rejection below pivot | Below zero line; histogram losing momentum | Long-term compression below $68,000 |
| 4-Hour (4H) | $64,049 | Broke below EMA 50 and EMA 200 | Neutral-bearish (~40); « Bear » divergence confirmed at $67,000 | Death Cross active above zero line | Short-term correction toward the $61,000 zone |
| 15-Minute (15M) | $64,139 | Death Cross established July 23; EMAs trending down | Neutral (~48); back to equilibrium after oversold | Flat around zero line; momentum fading | Consolidation channel / potential bear flag |
Fundamental, institutional and macroeconomic factors
ETF flows stabilize amid moderate global demand
Bitcoin’s behavior remains closely correlated with flows into U.S. spot ETFs. The asset recently benefited from a recovery phase marked by six to seven consecutive sessions of net positive inflows, totaling roughly $930 million to $1 billion in incoming capital. This move helped stabilize the price above $63,000 after a correction period marked by outflows exceeding $8 billion.
However, over a 30-day horizon, ETPs still show a net drawdown of roughly 40,010 BTC (around -$2.40 billion), indicating that current institutional interest reflects tactical accumulation at lows rather than aggressive long-term buying commitment.
Federal Reserve outlook and liquidity impact
The main macroeconomic catalyst for the end of the month is the FOMC meeting on July 28–29, 2026, chaired by Kevin Warsh. The federal funds rate, currently set between 3.50% and 3.75%, is widely expected to remain unchanged, with the probability of a hold ranging between 82% and 93% following the release of a June inflation reading of 3.50% year-over-year.
While this slowdown in inflation removes the risk of further monetary tightening, the prospect of keeping interest rates elevated for an extended period (« higher for longer ») weighs heavily on overall liquidity. This environment limits the expansion of valuation multiples for risk assets, including Bitcoin, and explains the low participation observed during the summer period.
Mt. Gox supply pressure and the mining sector’s shift
Latent selling pressure tied to Mt. Gox creditor repayments continues to fuel caution among market participants. The early-June transfer of 10,422 BTC (roughly $739 million) to new storage addresses reignited fears of forced liquidations, triggering waves of leveraged position closures in the futures markets. Although these tokens were not sold directly on spot exchanges, the total volume still held by the trustee (34,504 BTC, or roughly $2.43 billion) represents a significant psychological barrier ahead of the October 31, 2026 deadline.
At the same time, the mining sector is undergoing a major restructuring driven by the historic drop in hash price to $30.6 per PH/s per day, a level that pushes previous-generation mining rigs below their operational profitability threshold. To offset this drop in revenue, major industry players such as Iris Energy, Terawulf, and CleanSpark have begun shifting their infrastructure toward high-performance computing hosting dedicated to artificial intelligence. This diversification, illustrated by Iris Energy’s multi-billion-dollar infrastructure agreements with Microsoft and Nvidia, allows these companies to reduce their dependence on Bitcoin’s price and limits the need to forcibly sell their token reserves to cover operating costs.
Chart outlook and operational recommendations
Bearish continuation scenario
If Bitcoin fails to break out above the current compression channel at $64,300, the bear flag pattern on the 15-minute timeframe risks being validated. In that scenario, a break of the immediate $63,000 support level would trigger a pullback toward the intermediate « Buy Power: 69 » support zone on the 4H chart, between $60,500 and $61,500.
Losing that zone would once again expose the asset to the major support at $58,115. A break of this key threshold on a daily close could trigger cascading liquidations of long positions in the derivatives market, opening the path toward a return to the long-term support at $55,000.
Bullish reversal scenario
To invalidate the active bearish signals on the daily and 15-minute timeframes, buyers must reclaim the daily 50-day moving average level at $65,631. A confirmed daily close above this barrier would neutralize the RSI’s bearish signal and open the way toward the top of the intermediate congestion zone at $66,700.
Breaking through the major psychological and technical resistance at $68,000, which concentrates a high density of sell orders in the order book, would serve as confirmation of a bullish recovery heading toward the key $70,000 threshold.
Strategic guidance for traders
Given the neutrality of daily indicators and the fragility of the short-term structure, a cautious and disciplined trading approach is strongly recommended. Aggressive directional exposure in the middle of the current compression zone around $64,050 should be avoided. Accumulation strategies should focus exclusively near the support levels identified between $58,000 and $60,000, while applying strict risk management rules in the event of a confirmed break below $58,115. Short-term bullish exposure could only be considered with a satisfactory confidence level after a reclaim and validated retest of the $65,631 pivot.
Disclaimer: This article is for educational and informational purposes only. It does not constitute investment advice, a recommendation to buy or sell, or a solicitation to trade any financial asset. Cryptocurrency markets are highly volatile and carry a significant risk of capital loss. Always do your own research (DYOR) and consult a licensed financial advisor before making any investment decision.

