

Bitcoin is hovering around $65,900 in late July 2026, squeezed between a massive sell wall and record whale accumulation. While the Fear & Greed Index sinks deeper into fear territory, on-chain data tells a very different story: more than 270,000 BTC absorbed by large wallets in a matter of weeks, and 72% of the supply locked up by long-term holders. Here is our full multi-timeframe read of the market, from the order book heatmap down to the 15-minute chart.
A market decoupling from equities
The first half of 2026 marked a clear break in Bitcoin’s behavior relative to traditional stock markets. Long correlated with the Nasdaq 100 as a « risk-on » asset, Bitcoin is now diverging noticeably: while the Nasdaq and the S&P 500 push higher, the digital asset has seen sporadic pullbacks. Roughly 30% of this selling pressure is thought to stem from a rotation of institutional capital toward AI-related equities.
The geopolitical backdrop isn’t making the picture any clearer: renewed tensions between the United States and Iran have pushed oil prices to multi-week highs, while gold has held comfortably above $4,000 an ounce. Bitcoin, often billed as « digital gold, » has so far failed to fully capture that safe-haven flow, largely because the US dollar hasn’t shown pronounced weakness. Without a clean macro narrative, the asset remains dependent on internal and regulatory catalysts.
2026: the year of the regulatory tipping point
Several structural developments are reshaping institutional risk perception this year: a federal ban on a US CBDC, removing a potential sovereign competitor; the OCC’s national trust bank charter granted to key industry players; and CFTC pressure in favor of the « CLARITY Act. » On the infrastructure side, Swift’s rollout of a 24/7 blockchain settlement system, involving 17 major global banks, validates the operational viability of decentralized architecture at scale.
Spot ETF flows remain volatile, however, alternating between net inflows of several hundred million dollars and occasional outflows — a sign of cautious, tactical positioning by fund managers.
The legacy of summer 2024: a market that digested the worst
The current resilience of supply owes much to two major shocks absorbed during the summer of 2024. First, the German government’s liquidation of roughly 49,858 confiscated BTC, sold at an average price of $57,900 for about $2.89 billion. In hindsight, that decision translates into an estimated opportunity cost of over $2.3 billion for Berlin, given the asset’s appreciation since.
Second, the historic Mt. Gox repayments injected more than 140,000 additional BTC toward exchanges. Combined, these two events drove traders’ unrealized profit margins as low as -17%, a distress level comparable to the FTX collapse. It was precisely within that capitulation that the current macro floor was forged: sellers exhausted themselves, and the wealth transfer toward strong hands was completed.
Whales are accumulating, floating supply is drying up
The most striking signal of summer 2026 comes from on-chain data. Since late June, wallets holding more than 1,000 BTC have accumulated roughly 270,000 BTC, worth nearly $16.7 billion, at an average price close to $60,000. This behavior from multi-year-horizon players, indifferent to short-term noise, sends a clear message: current levels are being treated as an accumulation zone, not a top.
Another key statistic: long-term holders (coins untouched for more than 155 days) now control about 72% of circulating supply, or 16.3 million BTC taken off the market. Mechanically, this sharply reduces the supply available to absorb any fresh wave of institutional demand — historically fertile ground for price shocks.
On the valuation side, the Puell Multiple is showing signs of recovery, suggesting the sharpest phase of miner capitulation is behind us, while Metcalfe’s valuation bands have once again acted as solid support.
Fear sentiment that contradicts the data
The Crypto Fear & Greed Index currently sits at 34, in « Fear » territory — a striking disconnect from the whales’ massive accumulation. The average crypto market RSI hovers around 44, close to oversold conditions. Past cycles suggest prolonged phases of institutionalized fear often mark opportunity windows for patient participants. Another signal worth watching: implied volatility (BVIV) is approaching a critical floor of 36%, a level that has historically preceded a directional volatility expansion.
Multi-timeframe technical reading
Heatmap: mapping liquidity
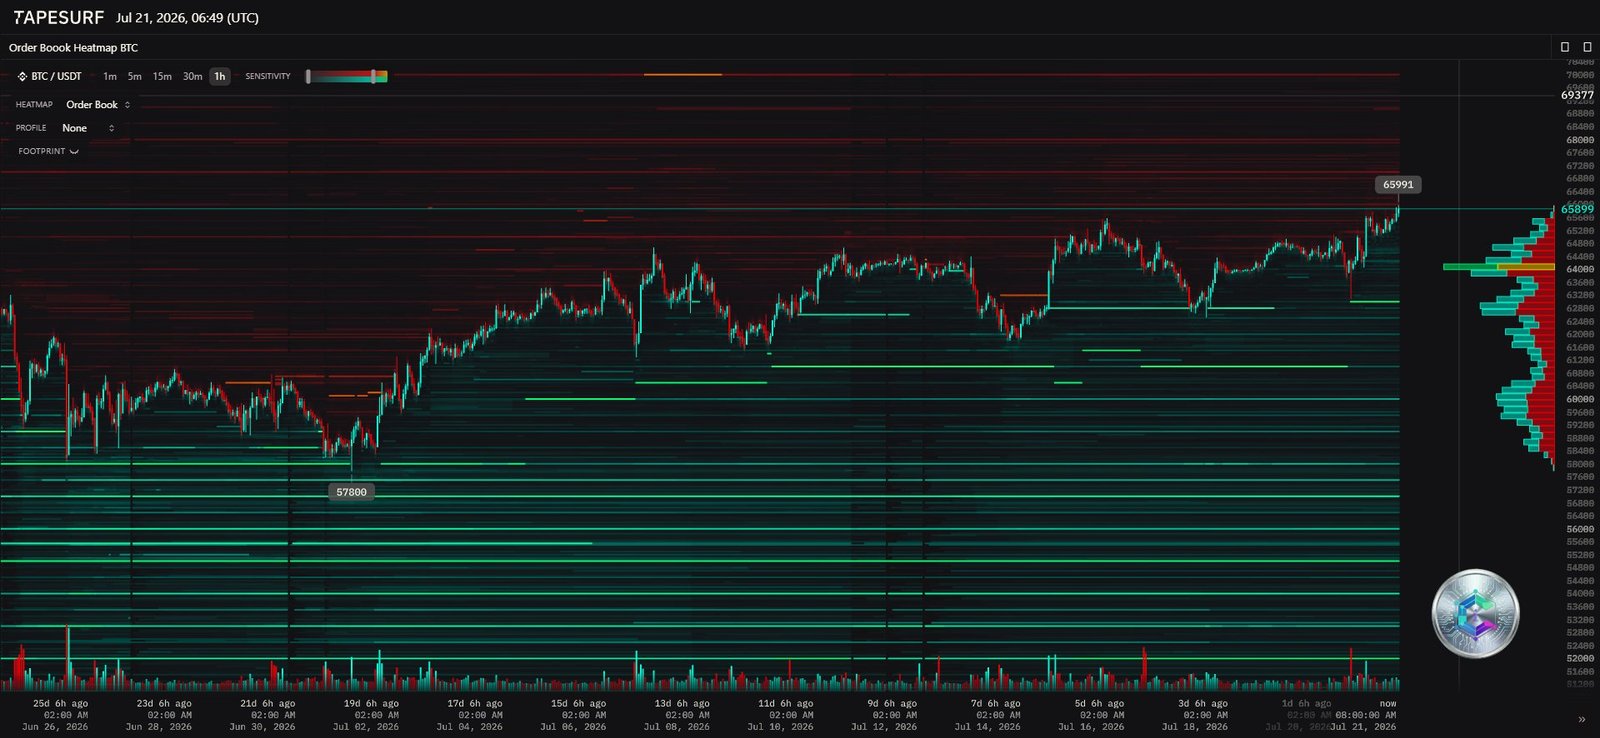
With price trading around $65,899, the heatmap reveals a clear asymmetry. Immediately above, a massive sell wall stands at $65,991, acting both as a magnet and a psychological resistance. Deeper down, a colossal buy wall sits at $57,800, which corresponds precisely to the German government’s 2024 liquidation zone. Between these two levels, the market is boxed in by considerable opposing forces.
Daily chart (1D): the underlying trend
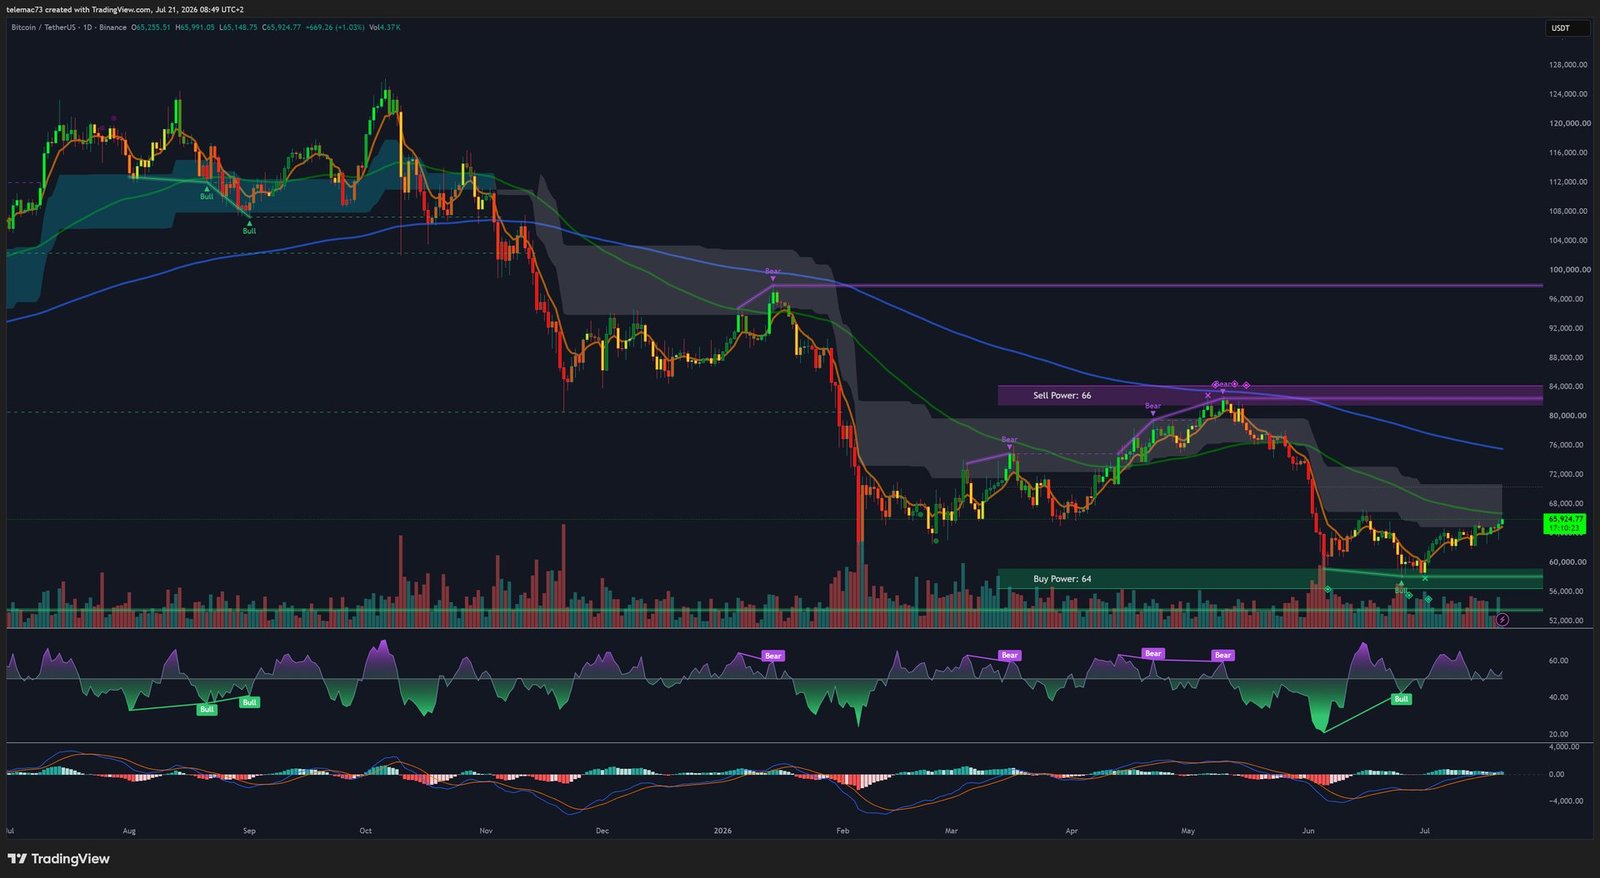
The daily chart shows a market squeezed into a $5,000 corridor between the 200-week SMA ($63,322), the lifeline of the long-term uptrend, and the 200-week EMA ($68,521), the ultimate target before a fresh price-discovery phase. The daily RSI, around 48, shows a bullish divergence: price prints lower lows while the oscillator prints higher lows, a sign that selling pressure is losing steam. The MACD confirms this fading bearish momentum, and the overall candle structure traces a wide compression triangle whose resolution appears imminent.
4-hour chart (H4): the bull flag
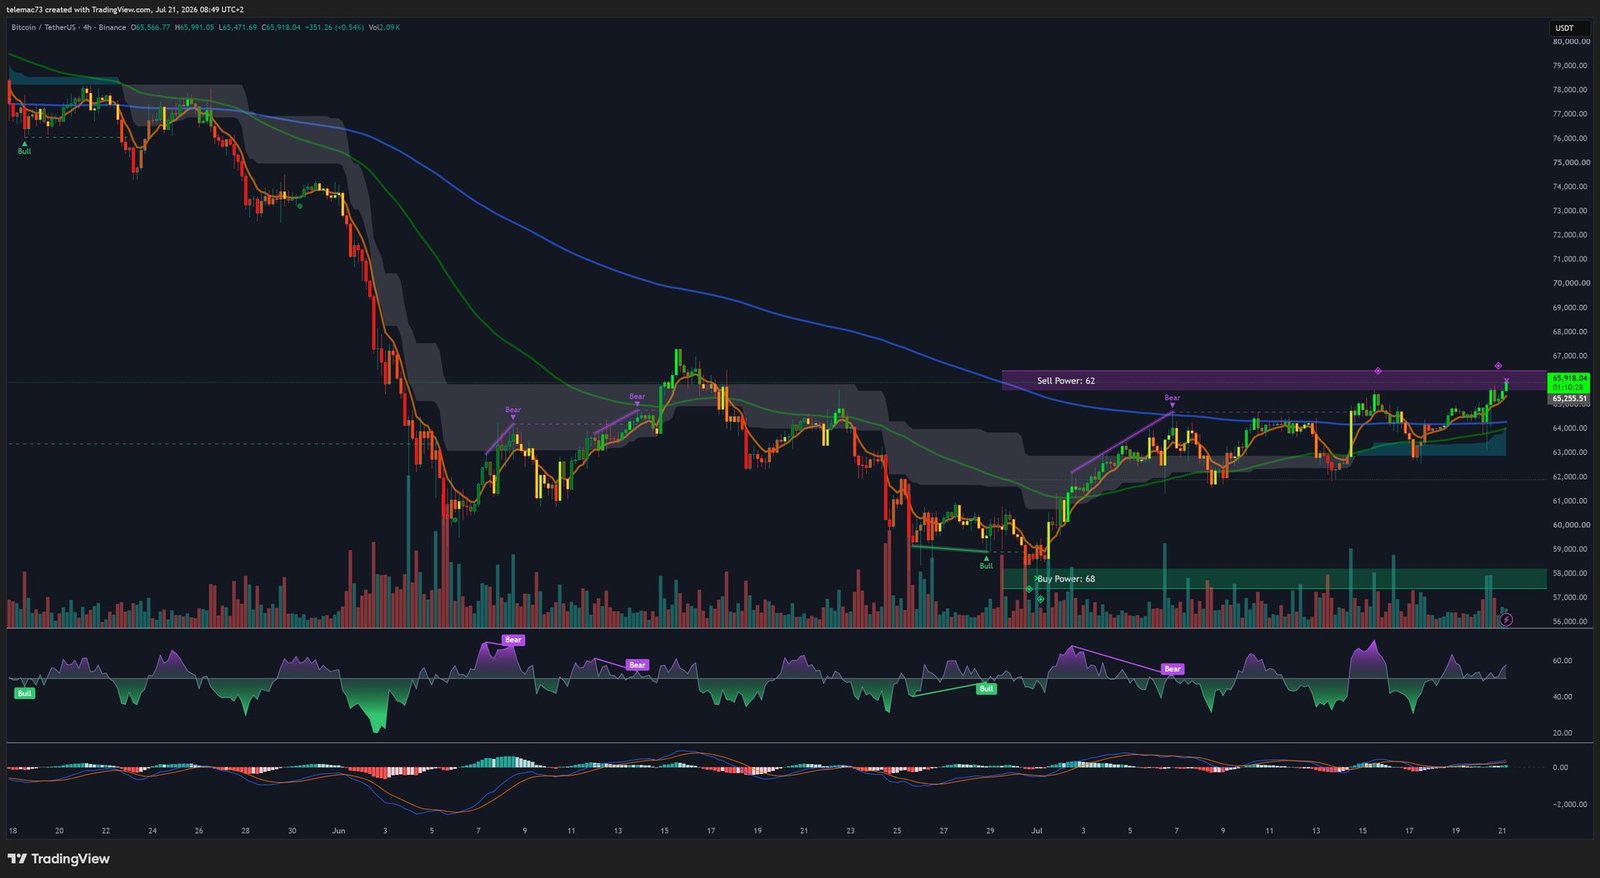
On the intermediate timeframe, the most visible pattern remains a bull flag: after a vigorous buying impulse forming the « pole, » price is moving through an orderly descending channel, typically read as a pause before continuation. The theoretical target of this pattern points to the intermediate resistance zone near $65,000. The H4 RSI oscillates moderately between oversold and overbought, and its recent return to the midline (50) leaves room for a fresh bullish impulse.
15-minute chart: market microstructure
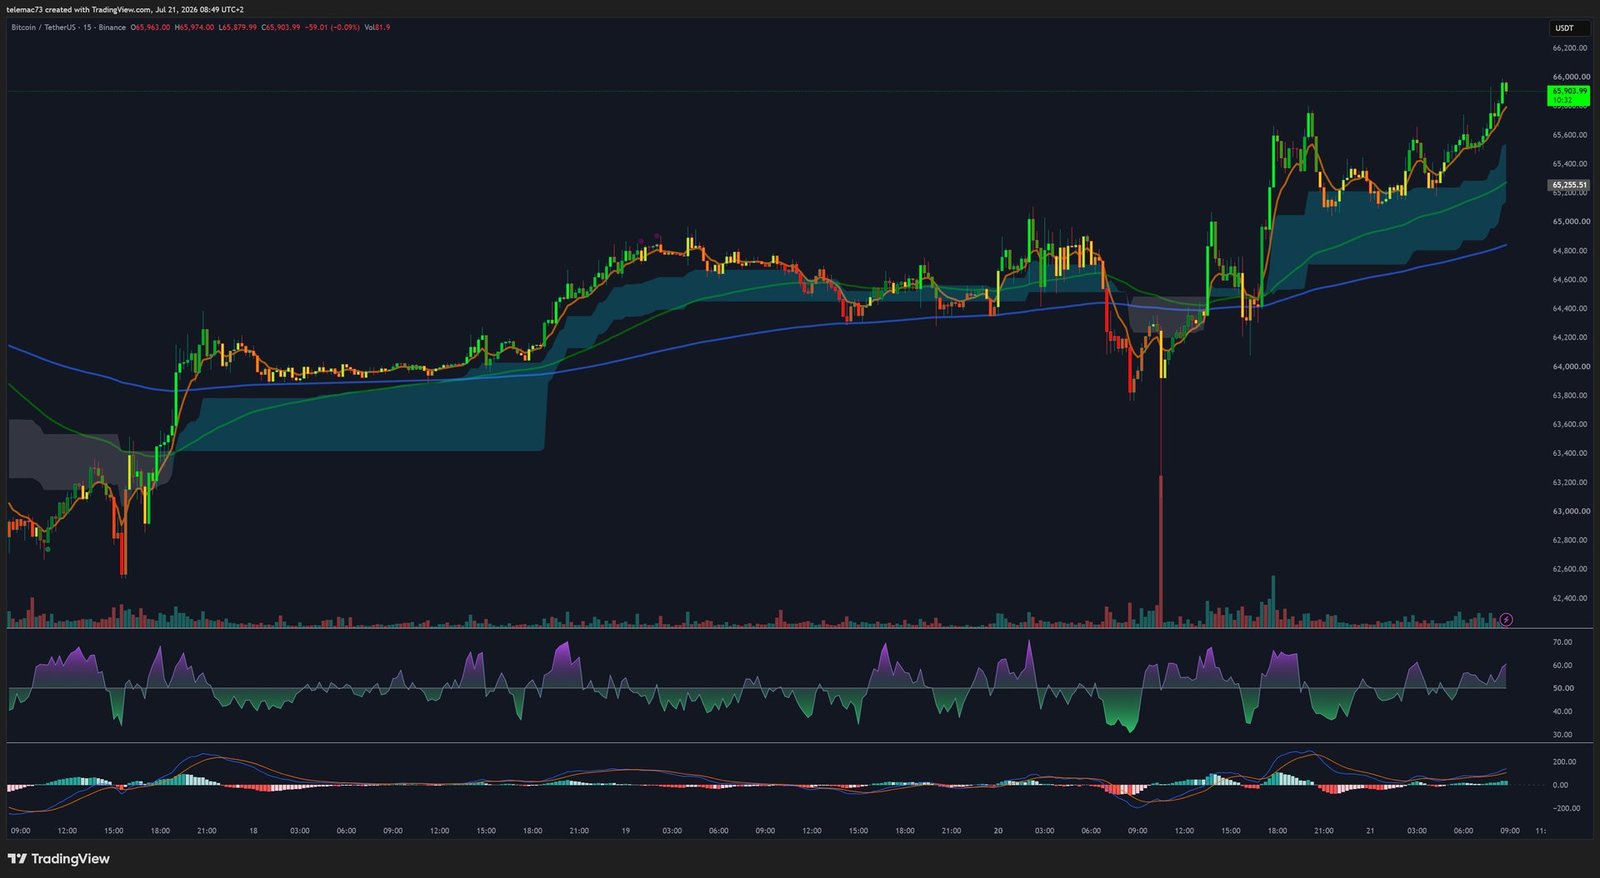
On this intraday scale, microstructure is jittery, marked by long wicks revealing aggressive liquidity sweeps. A recent sell-volume spike was quickly absorbed, without follow-through, evidence of hidden institutional buy orders. The intraday pivot sits at $63,700, while immediate resistance lies around $64,600. A clean close above that level would open the door toward the $65,991 sell wall identified on the heatmap.
Key levels at a glance
| Level (USD) | Category | Meaning |
|---|---|---|
| $68,521 | Major macro resistance | 200-week EMA, ultimate bull target |
| $65,991 | Liquidity resistance | Massive sell wall (heatmap) |
| $65,000 | Intermediate target | H4 Bull Flag objective |
| $64,600 | Intraday resistance | Short-term momentum demarcation line |
| $63,700 | Pivot support (15m) | Aggressively defended local low |
| $63,322 | Critical macro support | 200-week SMA, bull market lifeline |
| $60,300 | High-liquidity zone | Structural volume node |
| $57,800 | Extreme support | Colossal buy wall (heatmap) |
| $54,000 | Historical support | Daily bullish RSI divergences |
Conclusion: a compressed giant, ready to release
By late July 2026, Bitcoin resembles a compressed spring. The macro climate remains tense, with a Fear & Greed Index at 34, but that surface-level caution masks an on-chain accumulation of rare intensity: over 270,000 BTC absorbed by whales and 72% of supply held by long-term holders. The trauma of Germany’s 2024 state sales, while costly for Berlin, paradoxically served as a rite of passage for market liquidity.
Technically, the convergence across timeframes — the H4 bull flag, the daily RSI divergence, the preservation of the 200-week SMA at $63,322 — points toward a bullish resolution, with the $65,991 wall as the last obstacle before the 200-week EMA at $68,521. As long as the $63,322 line holds, the thesis of a market in asymmetric accumulation remains the most likely scenario.
Disclaimer: this article is intended for educational and informational purposes only. It does not constitute investment advice or a recommendation to buy or sell. Crypto-asset markets are highly volatile; only invest what you are prepared to lose and always do your own research before making any decision.

