


This July 2026, Bitcoin is navigating one of the tensest consolidation phases of its recent history. Trapped in a tight corridor between $62,000 and $64,500, the leading digital asset trades over 40% below its October 2025 all-time high, squeezed between a bond market that still offers competitive yields, persistent geopolitical tension between Washington and Tehran, and institutional caution that hasn’t fully shaken off last year’s traumas. The Fear & Greed Index has slid to 22, signaling palpable fear — yet the total crypto market capitalization holds firm around $2.28 trillion.
On the regulatory front, the world is fragmenting: Japan is moving toward spot Bitcoin ETFs by 2027 under a flat 20% tax regime, while the United States remains split between pioneering initiatives (New Hampshire) and repeated political roadblocks. This report offers a complete read of the situation: the psychological legacy of 2025, institutional flows, on-chain signals, Texas mining stress, and a full multi-timeframe technical breakdown across the daily, 4-hour, and 15-minute charts, plus the order book heatmap.
The still-open wounds of February 2025
Current institutional caution can’t be understood without revisiting the February 2025 shock. Bitcoin fell 28% from its $109,000 peak to a low of $78,200. Ethereum plunged 33%, memecoins collapsed 41%, and the entire smart-contract sector lost more than a third of its value within weeks.
That crash was no ordinary profit-taking event: it combined a macroeconomic shock (25% US tariffs on several major trading partners, a collapsing carry trade) with an unprecedented security breach — the $1.4 billion hack suffered by exchange Bybit, orchestrated by the Lazarus Group via a « blind signing » attack against Safe(Wallet)’s infrastructure. It remains the largest theft in crypto history and permanently reshaped the custody security standards institutions now demand.
| On-chain metric | Change (Feb. 2025 vs Jan. 2025) | Implication |
|---|---|---|
| Average daily revenues | -48% | Sharp drop in network usage |
| DEX volume | -27% | Contraction of speculative activity |
| Stablecoin transfers | -42% | Liquidity drying up |
| Ethereum DeFi revenues | -80% | Capital flight from yield protocols |
| Solana DeFi revenues | -65% | Collapse of memecoin leverage |
ETFs: an institutional tug-of-war far from over
June and early July 2026 saw sustained institutional selling pressure. US spot Bitcoin ETFs endured a 13-session streak of net outflows, wiping out more than $4.37 billion — the worst run since February 2025. As recently as July 9, Bitcoin ETFs shed another $95.3 million. Yet the picture isn’t one-sided: on July 3, a sudden reversal brought in $221.7 million in net inflows, breaking a ten-day losing streak and hinting at tactical repositioning by smart money at local market lows.
| Period (2026) | US spot Bitcoin ETF flows | Price impact |
|---|---|---|
| 13-day streak (June) | -$4.37B | Drop to ~$74,000 (-17%) |
| Early-June week | -$1.72B (worst since Feb. 2025) | Loss of key supports |
| July 3, 2026 | +$221.7M | Broke the losing streak |
| July 9, 2026 | -$95.3M | Rejection below $64,200 |
On-chain signals: a dormant whale stirs, Realized Price as the compass
On July 15, 2026, a wallet dormant for over 8.5 years moved 5,908 BTC (roughly $383 million) — a classic signal of potential distribution via OTC channels. On the long-term valuation front, analyst PlanB continues to defend his Stock-to-Flow model, targeting an equilibrium zone around $500,000 over the 2026–2028 window, while acknowledging a dip below $53,000 remains possible without invalidating the thesis.
More decisive in the near term is the network’s Realized Price — the volume-weighted average cost basis of all circulating BTC — currently sitting around $53,000. This level acts as a major psychological and statistical floor, below which most holders would slip into unrealized losses.
Texas mining under thermal stress
Summer heat in Texas is directly weighing on Bitcoin’s supply. Olenox Industries (NASDAQ: OLOX) reported its fleet utilization rate capped at 67% of capacity in June, forcing a switch to low-power mode and repeated voluntary curtailment events with grid operator ERCOT. The result: just 14.92 BTC mined for the month, far below nominal capacity. This production decline, combined with rising operating costs, is pushing some miners to liquidate a growing share of their reserves — adding further selling pressure on top of ETF outflows.
Multi-timeframe technical breakdown
Daily chart: the rendezvous with the 200-week SMA
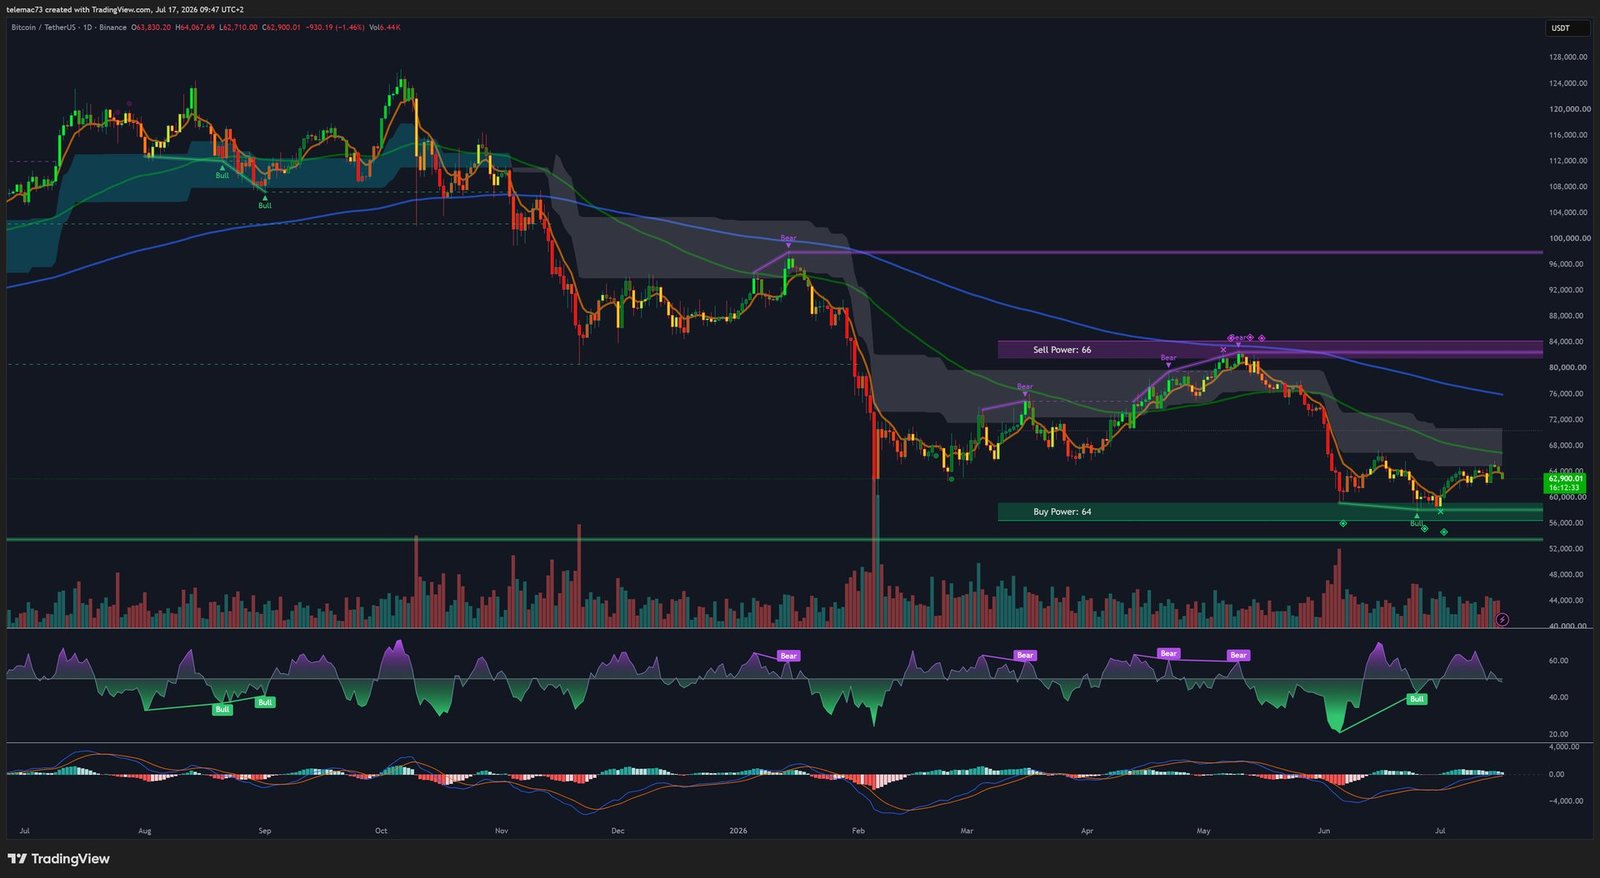
On the daily timeframe, Bitcoin remains inside a broad falling wedge stretching back from its all-time highs, printing successive lower highs and lower lows. The key level in this structure is the 200-week SMA, currently hovering around $63,100 — a level analyst Benjamin Cowen calls a « date with destiny, » historically separating the continuation of a bull market from a prolonged crypto winter. Price has laboriously reclaimed this average after dipping below $57,000, though momentum remains thin. The daily RSI barely holds above 50, and the MACD stays below its zero line, awaiting a Golden Cross that would invalidate the bearish structure. A sustained close above $65,000–$66,800 would confirm a reversal; a break below $62,300 would open the door to $61,200 and then $57,000.
4-hour chart: compression before the explosion
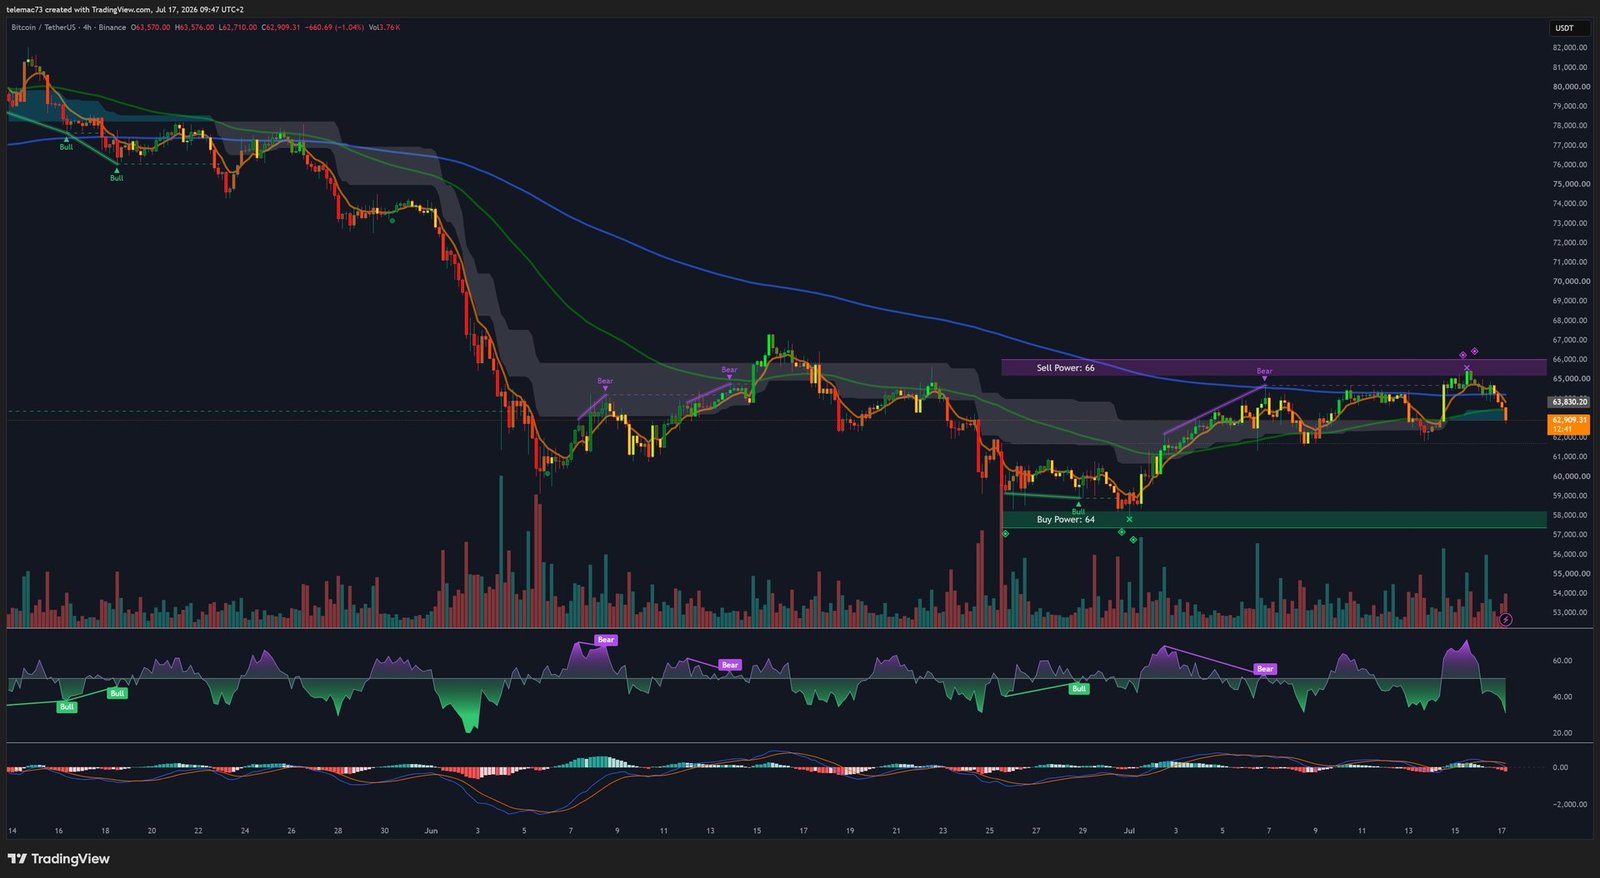
On this intermediate scale, the initial bear-flag pattern has morphed into a symmetrical compression triangle, with price printing higher lows around the $63,500 pivot. A sell wall (« Sell Power ») caps any advance toward $66,000, while a buyer’s floor holds just under $58,000. The H4 RSI, swinging between oversold and overbought without clear direction, could form a classic bullish divergence if price tests a fresh low while printing a higher RSI low — one of the more reliable technical signals for a short-term reversal. Resolution of this compression, in either direction, should unleash a 5–10% impulsive move.
15-minute chart: the noise of a market under strain
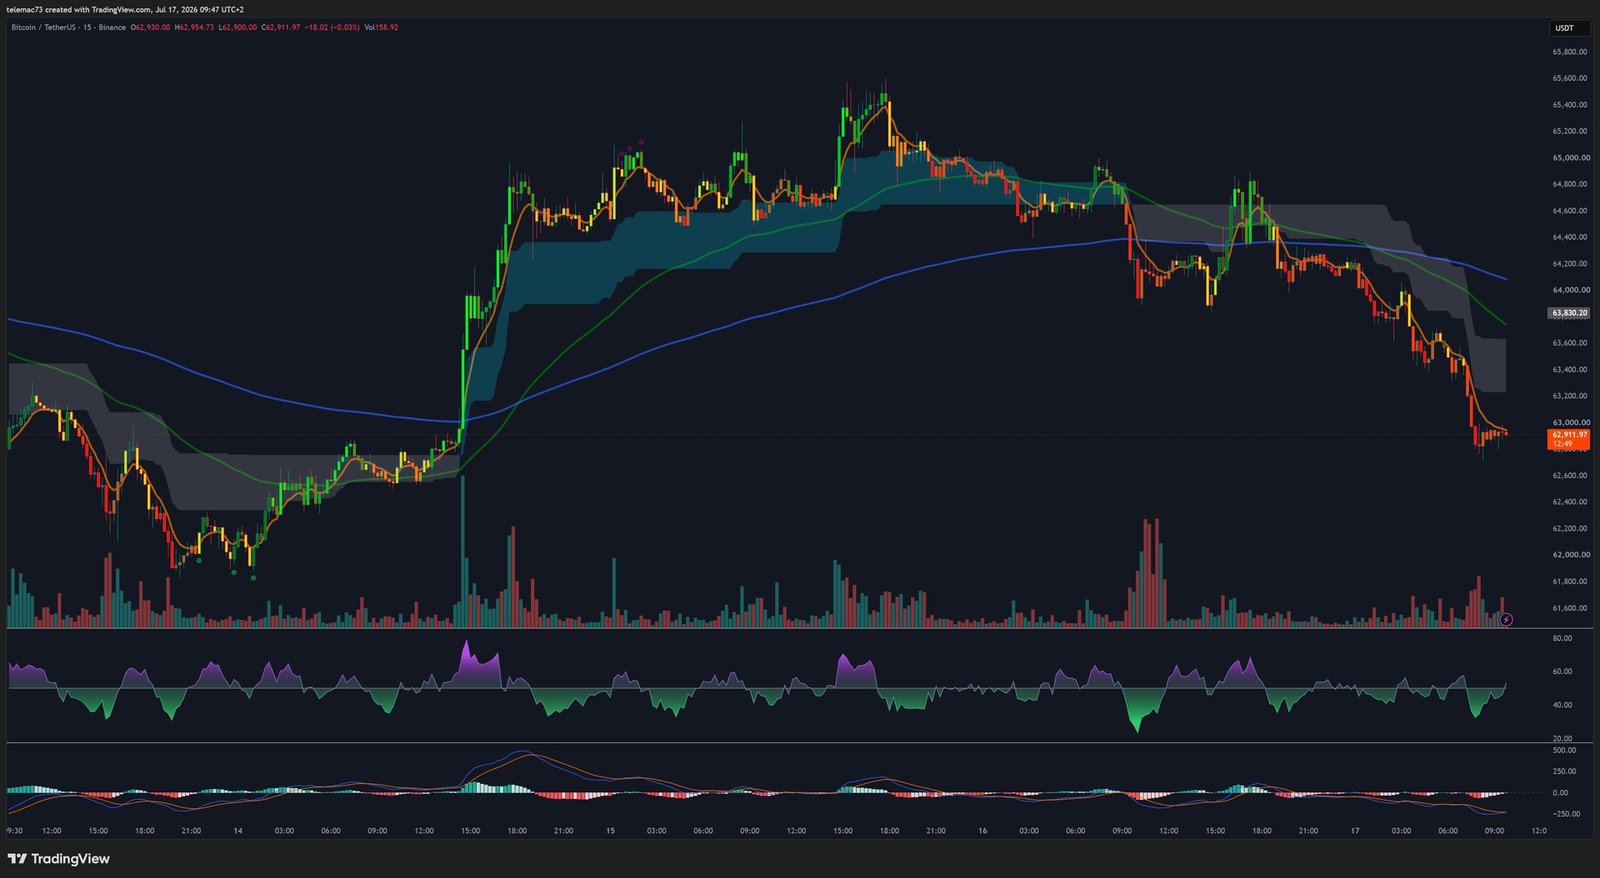
The intraday microstructure confirms the prevailing nervousness: a recent impulsive drop took price from $64,800 down to around $62,900, piercing the short-term moving averages, which now act as dynamic resistance on any bounce. The volatility squeeze that preceded this move resolved to the downside. Both the MACD and RSI have flipped into seller territory, with a slight technical bounce that looks more like short-covering than a genuine return of buyers.
Order book heatmap: mapping the liquidity
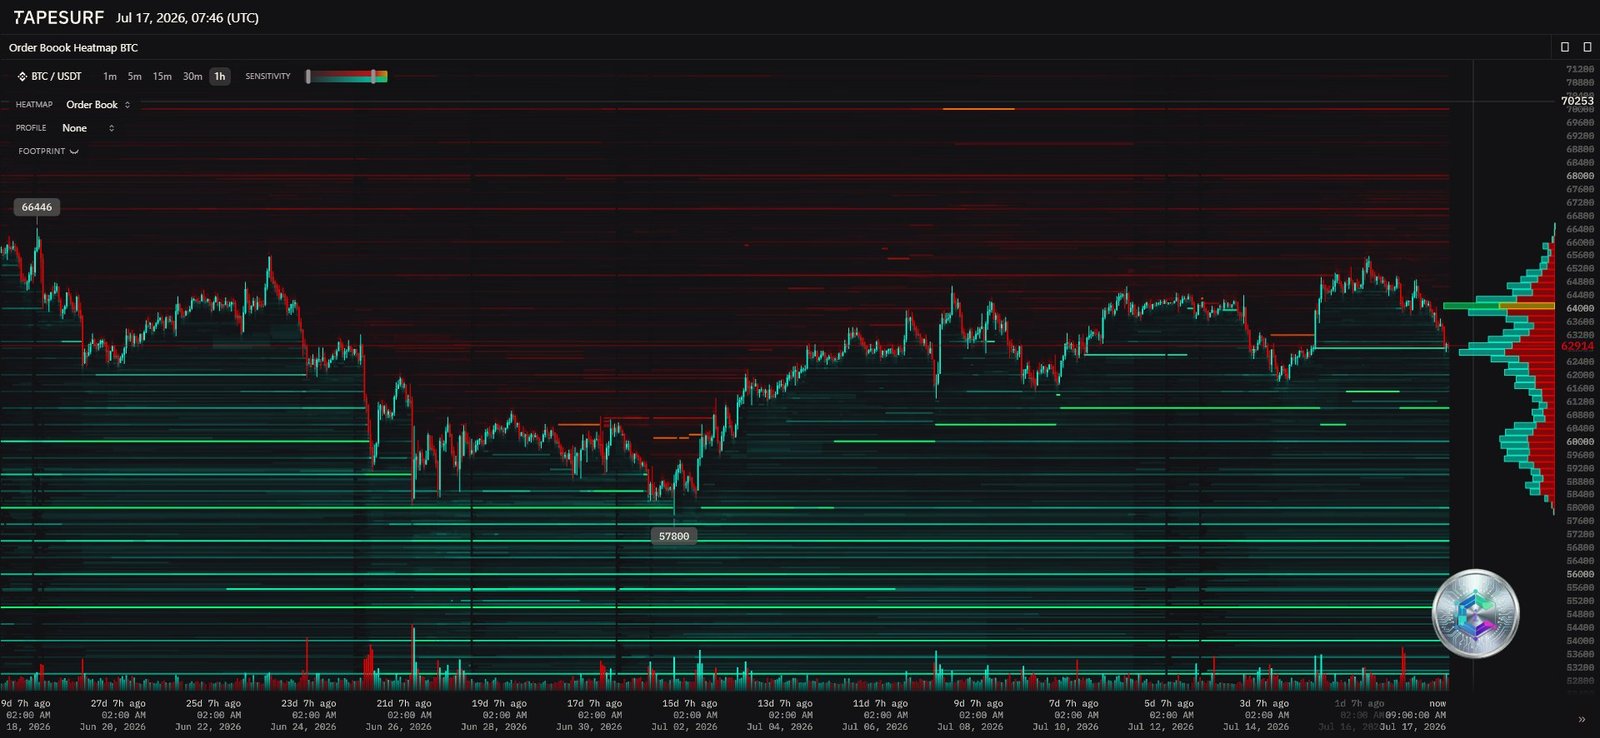
The heatmap reveals a dense supply wall around $64,000, coinciding with the Point of Control (the price level where the greatest historical volume has traded). Breaking through this ceiling would require considerable buying force, but could trigger a short squeeze propelling price toward $70,000. On the downside, a liquidity void below $60,000 precedes a massive accumulation zone around $53,000–$57,800 — exactly the Realized Price zone. This architecture suggests a liquidity hunt (stop hunt) below $60,000 remains a coherent technical scenario ahead of any durable reversal.
Key levels to watch
| Category | Level (USD) | Rationale |
|---|---|---|
| Macro resistance | $66,800 | H4 Sell Power ceiling / heatmap wall |
| Pivot resistance (POC) | $64,200 | Point of Control, repeated rejections |
| Current pivot | ~$62,900 | Battle around the 200-week SMA |
| Short-term support | $61,200 | Current Buy Power floor |
| Macro support | $57,000 | Recent low, dormant liquidity block |
| Fundamental support | $53,000 | Network Realized Price |
Two scenarios for the second half of 2026
Scenario 1 — Capitulation and a Q4 bottom: the market’s inability to break through $65,000 under the weight of ETF outflows eventually exhausts spot demand. The reclaim of the 200-week SMA turns out to be a bull trap. The $60,000 support gives way, triggering a liquidation cascade toward the $53,000–$57,000 zone, where the Realized Price acts as a magnet. This washout purges residual leverage and would lay the foundation for a durable cycle bottom.
Scenario 2 — An anticipatory golden breakout: progress on Japan’s regulatory framework acts as an exogenous demand shock. US institutions, fearing they’ll miss a turn, halt their capital outflows. The H4 compression triangle breaks to the upside, the $64,200 supply wall gets swallowed by a short squeeze, and a confirmed close above $66,800 would technically invalidate the bearish thesis.
Ultimately, Bitcoin is walking a razor’s edge where the current volatility compression cannot last indefinitely. Its resolution — up or down — will set the market’s tone for the coming quarters. Caution remains warranted until a confirmed break of the range boundaries ($57,000–$65,000) materializes.
Disclaimer: this article is provided for purely informational and educational purposes. It does not constitute investment advice, a recommendation to buy or sell, or a solicitation to trade digital assets. Cryptocurrency markets are highly volatile and involve a risk of capital loss. Always do your own research (DYOR) and consult a qualified financial advisor before making any investment decision.

