


As of mid-July 2026, Bitcoin is trading in one of the most technically loaded zones of its year: the 64,000–65,000 $ pivot. On one side, softer US inflation and a wave of Asian legislation are fueling optimism. On the other, a fragile order book and an oddly absent North American bid are a reminder that caution is still warranted. Here is our full read, from the macro backdrop down to the 15-minute chart.
Macro backdrop: cooler inflation, a Fed still on guard
July’s US inflation data surprised on the soft side: June’s CPI fell 0.4% month-over-month, bringing the annual reading to 3.5%, while core CPI held steady at 2.6%. Lower inflation reduces rate-hike expectations, weakens the dollar, and mechanically benefits a fixed-supply asset like Bitcoin, which regained momentum above 64,000 $ in the wake of the release.
It would be premature, though, to read this as an imminent dovish pivot. Testifying before the Senate, Fed Chair Kevin Warsh reminded markets that a single favorable data point won’t shift the central bank’s course. With the inflation target still at 2%, the Fed funds rate remains in a restrictive 3.50%–3.75% range for a fourth consecutive meeting. The next FOMC meeting, on July 28–29, will be watched closely for any dovish shift in tone.
A counterweight risk looms, however: renewed tensions in the Strait of Hormuz have pushed oil prices higher, a move that could feed back into July’s inflation figures. This two-sided uncertainty largely explains the market’s hesitation to break decisively above current technical resistance.
Regulation: Asia accelerates, the US locks down the plumbing
The regulatory center of gravity for crypto keeps shifting toward Asia. In Japan, a landmark bill to reclassify Bitcoin as a full-fledged financial instrument cleared a key upper-house committee vote. The bill would cut the flat capital-gains tax rate to 20% and lay the groundwork for spot Bitcoin ETFs on the Tokyo Stock Exchange as early as 2027. South Korea is also moving forward on formal recognition of digital assets.
In the US, attention is focused less on expansion and more on reining in stablecoins. The July 18 statutory deadline under the « GENIUS Act » requires several federal agencies to finalize capital, reserve, and licensing rules for issuers such as USDC — a clarification that matters, since stablecoins underpin most of the liquidity on crypto exchanges.
In emerging markets, adoption is taking a more utilitarian form: facing a structural dollar shortage, Bolivia is weighing USDT integration into its national payment system, following an explosion in digital-asset transaction volumes since the country’s crypto ban was lifted in 2024. On the flip side, the coercive dimension of crypto remains very much alive: the US Treasury’s OFAC prompted the freezing of 131 million dollars in USDT tied to wallets linked to Iran’s central bank, a reminder that decentralized finance still answers to the geopolitical obligations of centralized issuers.
| Event | Timing | Potential impact |
|---|---|---|
| US CPI (June) | Mid-July 2026 | Drop to 3.5% YoY, initial bullish push toward 65,000 $ |
| Japan ETF bill | July 2026 | Major legitimization, growing Asian institutional demand |
| GENIUS Act (stablecoins) | July 18, 2026 | Structuring of on-chain USDC/USDT liquidity |
| FOMC meeting | July 28–29, 2026 | Rates expected to hold, key volatility catalyst |
Market microstructure: the curious US apathy
The most telling signal this month remains the persistent discount on US exchanges. The « Coinbase Premium, » which tracks the price gap between Coinbase and Binance, has stayed negative for fifty straight days — an exceptional streak that began in mid-May. Such a signal points to a lack of buying conviction among US investors, even as durable bull phases have historically required their active participation.
This is echoed in spot Bitcoin ETF flows: after eight consecutive weeks of net outflows totaling roughly 8.26 billion dollars, a modest weekly inflow of 197.4 million dollars was recorded on July 11. In other words, the rally above 64,000 $ appears to be driven by non-US capital, while domestic buyers stay on the sidelines.
Asia, by contrast, is showing near-feverish activity. Spot volumes on centralized exchanges jumped 15.3% in June to 1.11 trillion dollars, ending five months of decline. In South Korea, volume on Upbit spiked more than 1,300% in a single day. That enthusiasm deserves a caveat, though: local regulators flagged 1.2 million leveraged accounts hit by margin calls, suggesting the volume surge owed as much to forced liquidations as to genuine buying conviction. On the infrastructure side, monthly proof-of-reserves reports remain reassuring, with several platforms showing collateralization ratios well above 100%.
Reading the liquidity heatmap: where the real walls are
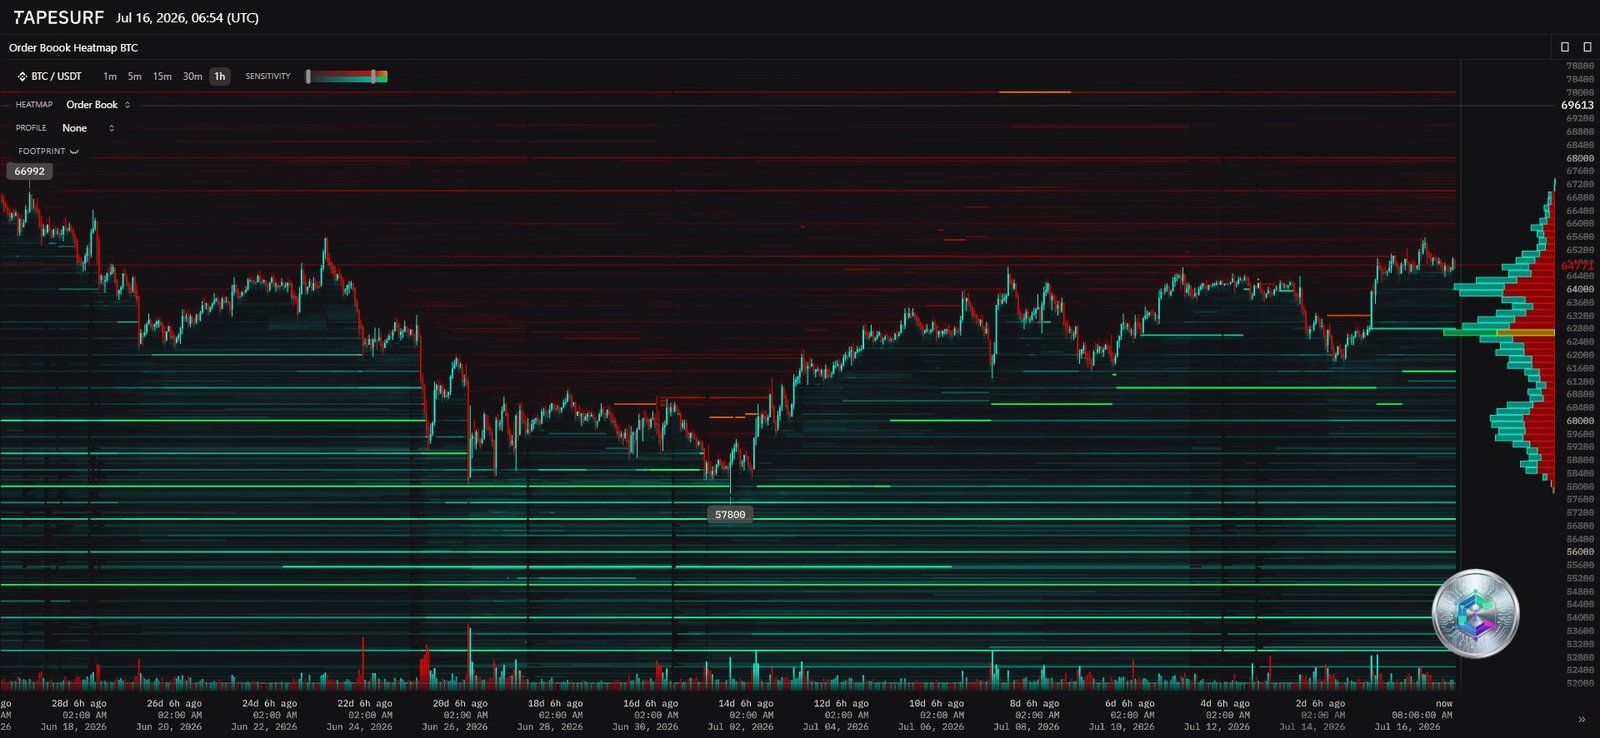
The order-book heatmap offers a view that complements classic charting: it maps out traders’ resting intentions rather than price already executed. The picture here is notably asymmetric. Above the current price, between 65,000 and 66,000 $, a thick band of sell walls points to heavy short positioning and profit-taking, which explains the market’s repeated rejections at this level.
Paradoxically, this buildup of short positioning creates the conditions for a possible short squeeze: if spot demand manages to absorb these resting orders and push price above 65,600 $, forced short covering could trigger a chain reaction toward 67,300 $, potentially 70,000 $. Conversely, the order book thins out noticeably below 61,000 $. This lack of immediate buy-side support exposes the market to air pockets should key supports break, with a risk of a quick slide toward the 57,000–58,000 $ zone.
Daily overview: an inverse head-and-shoulders still being tested
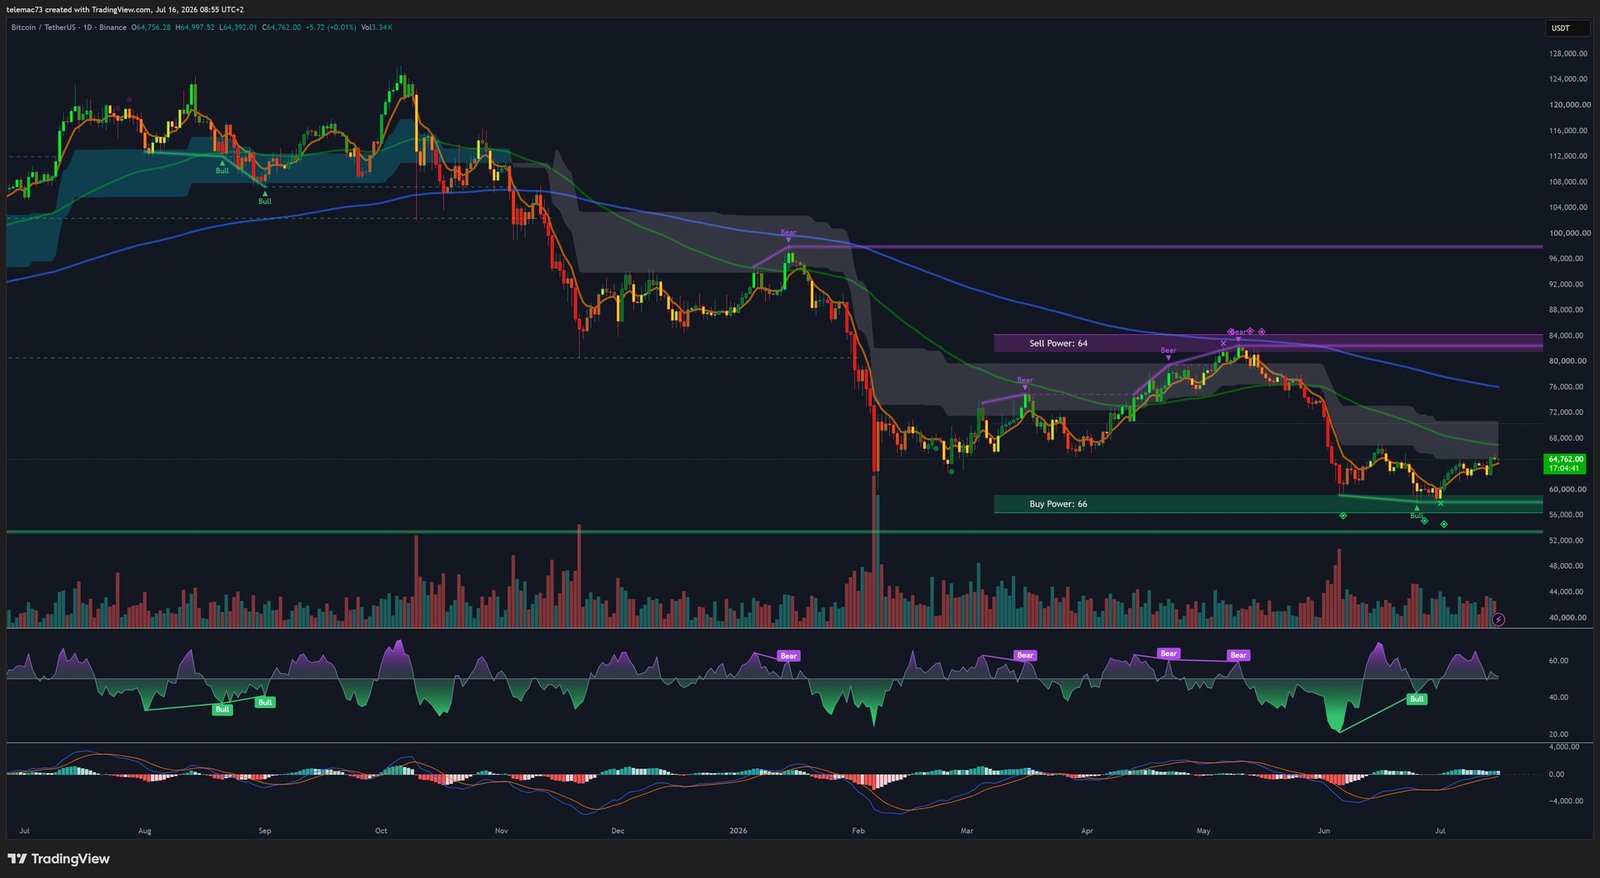
On the daily timeframe, price action off the June low near 58,300 $ has traced out a classic reversal pattern: an inverse head-and-shoulders, with its neckline sitting precisely in the contested 65,000 $ zone. The recent reclaim of the 25-day moving average adds weight to the case that medium-term control has shifted to buyers.
Oscillators tell a similar story: the daily RSI has broken above the neutral 50 threshold, while the PPO (the percentage-based cousin of MACD) has posted a clean bullish crossover. These technical signals still hang on a decisive test, though: the market has produced repeated upper wicks against the 65,000–67,300 $ resistance without a decisive close above it, keeping the broader uptrend on probation until buying volume confirms the breakout.
| Key level (Daily) | Significance |
|---|---|
| 67,300 $ | Upper macro resistance — confirms bullish reversal |
| 65,000 $ | Neckline of the inverse pattern — current lock |
| 61,500 $ | Major structural support |
| 58,300 $ | Capitulation floor — invalidation if broken |
The 4-hour chart: the crack that worries traders
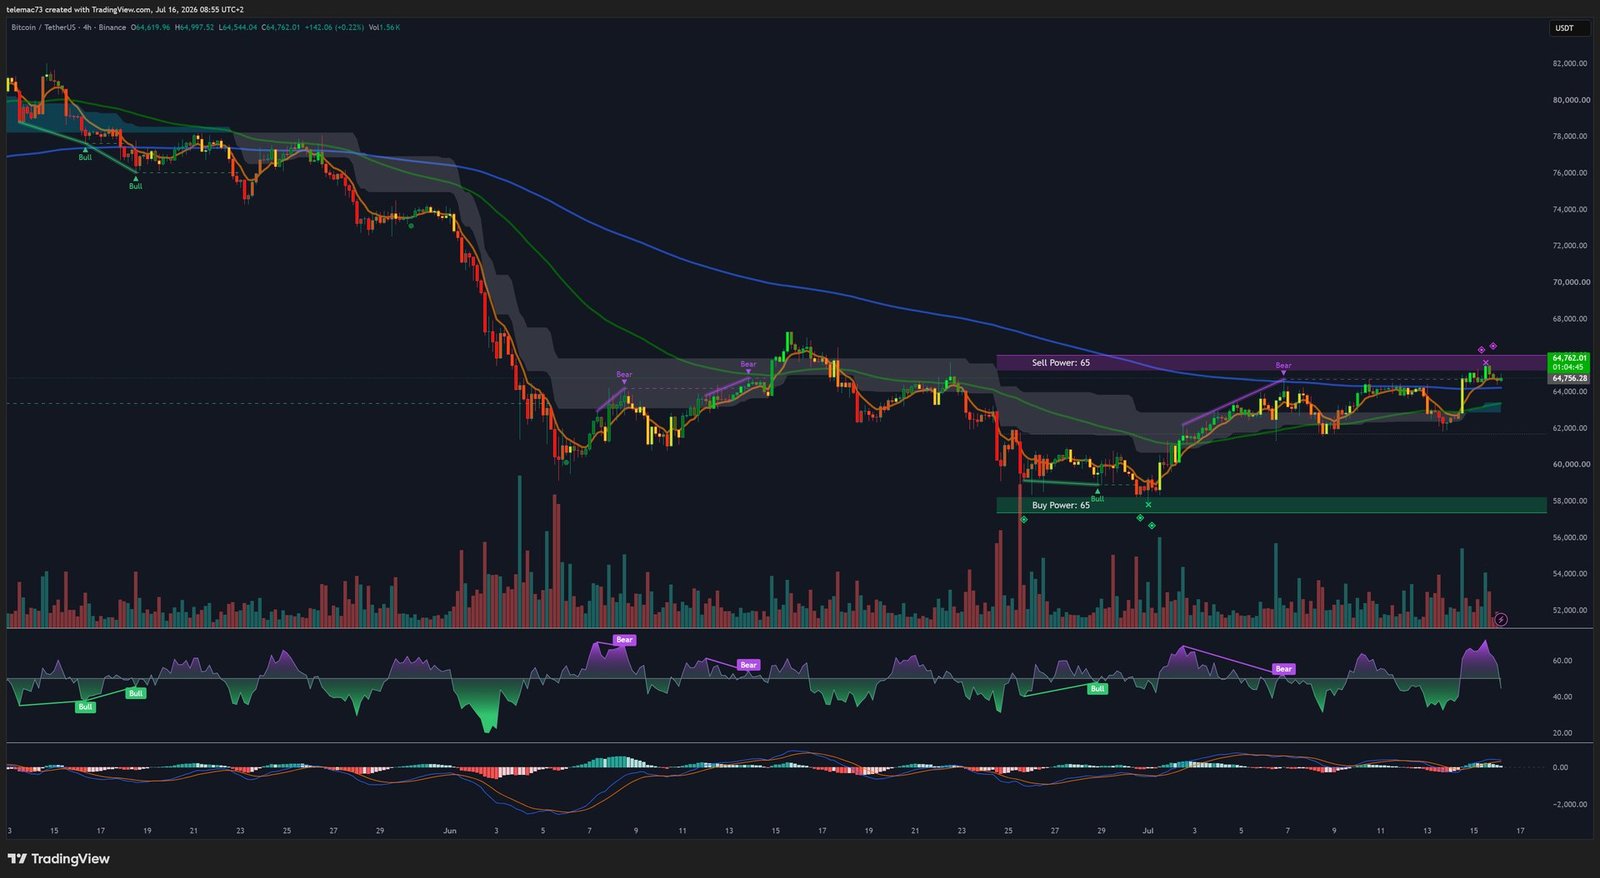
It’s on the intermediate 4-hour scale that the daily optimism starts to crack. Price had been forming a contracting triangle, whose horizontal support at 62,500 $ coincided with the 200-period moving average — a level closely watched by trend-following algorithms. Its recent breakdown, paired with a close below that moving average, invalidates the immediate continuation thesis for now.
Fibonacci retracement levels, drawn from the 57,700 $ swing low to the 64,626 $ local high, offer a useful map: price has already given up the first 23.6% level (around 63,200 $), exposing the 61,150 $ pivot zone (the 50% retracement). This level is a genuine make-or-break zone: a bounce there would revive the push toward 65,000 $, while a clean close below opens the door to 60,350 $ and then the 58,800 $ base. A stretched, negative 4H MACD and an RSI below its average both point to some buyer fatigue at this stage.
The 15-minute chart: algorithmic noise
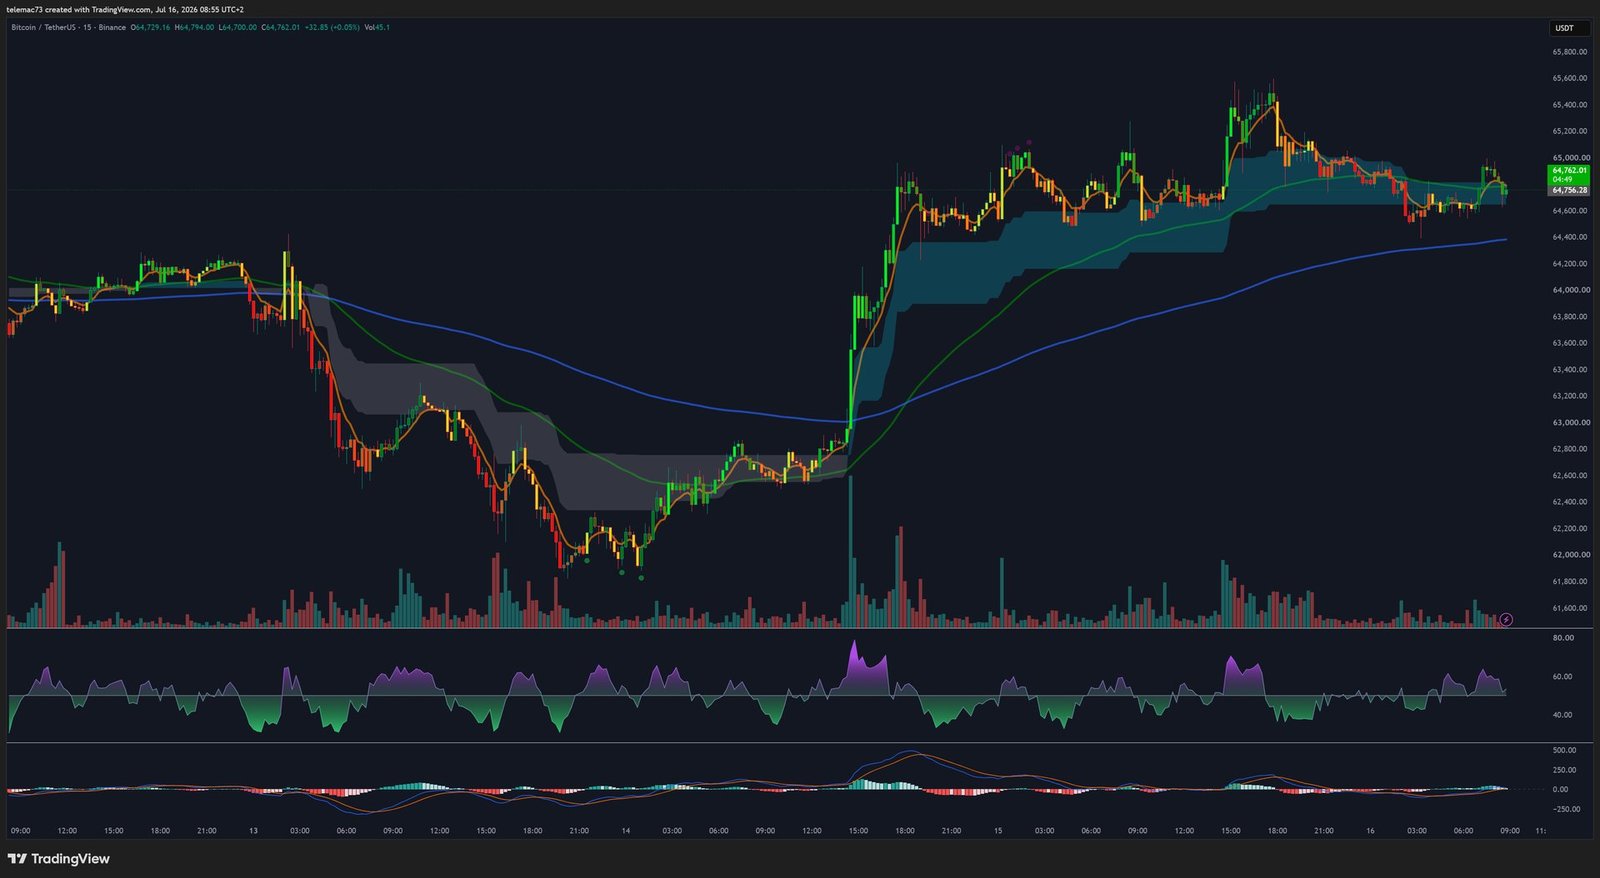
Intraday, the tape is dominated by high-frequency algorithms and leveraged-position management. The recent failed push at 65,000 $ coincided with the 15-minute RSI well above 70, an overbought extreme that quickly triggered mean-reversion selling and a tactical pullback. The market is now trying to rebuild a foothold around the 62,700 $ support zone, with pronounced wicks betraying liquidity sweeps orchestrated by market makers.
This intraday noise is amplified by weekly Deribit options expiries on July 17 and 24, ahead of the monthly expiry. Delta-hedging flows around the 65,000 $ strike are helping keep Bitcoin inside an artificially tight corridor on shorter timeframes, until a macro catalyst breaks the equilibrium.
Two scenarios for the back half of July
Bull case: a flush before the breakout
The current pullback would be nothing more than a healthy leverage flush ahead of a resumption of the broader uptrend. Intermediate support between 61,500 and 62,700 $ absorbs the remaining selling pressure, the RSI regains room to run, and renewed US ETF inflows add to Asian-driven momentum. A decisive break above 65,000 $ on strong volume, then above 65,600 $, would trigger liquidation of the short positioning visible on the heatmap, opening the way to 67,300 $ and potentially 70,000 $.
Bear case: distribution in disguise
The prolonged failure to clear 65,000 $ would reflect institutional distribution, consistent with a still-negative Coinbase Premium and the already-confirmed breakdown below the 4H 200 SMA. A convincing daily close below 61,150 $ would expose the thin liquidity visible on the lower order book, with a risk of a quick slide toward 60,350 $ and then 58,800 $ — especially if inflation data disappoints or the Fed turns more hawkish.
In short, strategic neutrality still seems the wisest stance while the market remains boxed between support at 61,150 $ and resistance at 65,600 $. Close monitoring of the liquidation heatmap and spot volume at these inflection points will be the most reliable way to spot Bitcoin’s next directional impulse.
Disclaimer: this article is for educational and informational purposes only. It does not constitute investment advice, a recommendation to buy or sell, or a solicitation to trade any financial asset. Cryptocurrency markets are highly volatile and involve a risk of capital loss. Do your own research (DYOR) and consult a qualified professional before making any investment decision.

