


After losing more than half its value since its all-time high in October 2025, Bitcoin has spent the past several days trading in a pivotal zone, wedged between $58,000 and $64,000. With short-term holders in the middle of a full capitulation, whales quietly accumulating near $50,000, and a macro backdrop that is loosening up, the market looks poised at a crossroads. Here is our full technical, fundamental and on-chain read of the situation as of July 8, 2026.
A Macro Backdrop in the Middle of a Shift
The first half of 2026 was defined by a restrictive monetary policy under Federal Reserve Chair Kevin Warsh, with the fed funds rate held in a 3.50%–3.75% range. But June’s US jobs report reshuffled the deck: only 57,000 nonfarm payrolls were added, far below expectations. This sharp slowdown immediately pushed bond yields lower — 5-year TIPS yields, which had spiked to 1.98%, eased back — and weakened the dollar index (DXY), lowering the opportunity cost of holding a non-yielding asset like Bitcoin.
On the geopolitical front, the Strait of Hormuz closure crisis had pushed Brent crude above $120 a barrel in the spring, reviving inflation fears. The ceasefire since reached has allowed oil to fall back below $70, easing those pressures and reinforcing expectations of a more accommodative monetary policy in the second half of the year. On the regulatory side, the EU’s MiCA framework took full effect on July 1, forcing significant operational adjustments on exchanges, while the SEC — under Chair Paul Atkins — announced an imminent « safe harbor » proposal via the Regulation Crypto project, a promising framework for DeFi and tokenized investment contracts. On the flow side, after significant net outflows from spot Bitcoin ETFs in June, the trend stabilized in early July, even turning into a net inflow of +$223.5 million on July 2.
| Factor | Key Data Point | Impact on Liquidity |
|---|---|---|
| Jobs report (NFP) | 57,000 (sharply lower) | Rate-cut expectations rise, risk appetite improves |
| Brent crude | Back below $70/barrel | Inflationary pressure eases, more room for the Fed to cut |
| EU regulation | MiCA takes effect (July 1) | Short-term compliance shock, cleanup of spot volumes |
| SEC « Safe Harbor » framework | Regulation Crypto (Paul Atkins) | Relief for DeFi and token constraints |
| Spot Bitcoin ETF flows | +$223.5M on July 2 | Exit from capitulation phase, flows stabilizing |
Multi-Timeframe Technical Read: Three Horizons, One Battle
Daily Chart (1D): A Still-Fragile Structure, but Reversal Signals Are Building
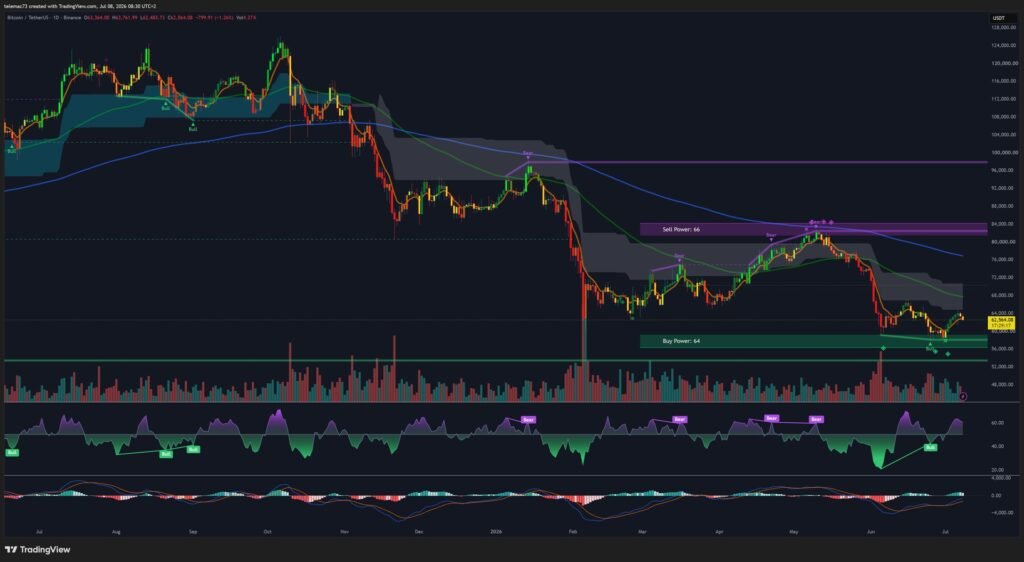
On the daily timeframe, Bitcoin is showing signs of stabilization after a 54% correction from its October 2025 all-time high of $126,000. The underlying trend remains seller-dominated following an earlier death cross, when the 50-day moving average crossed below the 200-day moving average — the latter now sitting at $75,203, a major long-term dynamic resistance, while the 50 DMA ($68,000) continues to weigh on rebound attempts.
Two technical signals nonetheless suggest selling pressure is running out of steam. First, a classic bullish divergence on the daily RSI: while price printed a low of $57,950 on July 1 before retesting the $60,000 zone, the indicator carved out rising lows, signaling waning momentum among sellers. Second, the daily MACD, still in negative territory, is attempting a golden cross, with green histogram bars appearing — a sign of gradually building buy-side momentum beneath the surface. Price remains confined within a wide compression channel, between support in the « Buy Power 64 » zone ($57,000–$59,000) and resistance in the « Sell Power 66 » zone ($83,000–$85,000). The break of the 200-week moving average ($62,444) in late June forced the market to test this critical support, and the bullish reaction that followed confirms the presence of value buyers in this zone.
4-Hour Chart: The Dynamic Resistance Capping the Bounce
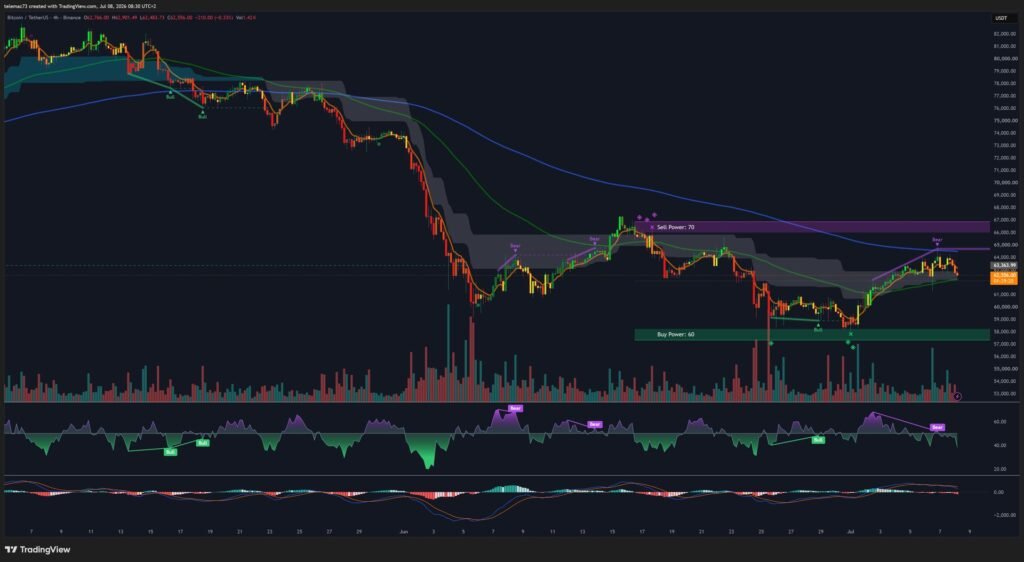
On the 4-hour timeframe, Bitcoin trades around $62,557, running into the 200-period exponential moving average (200 EMA), which is sliding lower toward $64,500. The 50 EMA, at $63,000, acts as immediate support. A bearish divergence formed on the local RSI during the bounce that pushed price to $64,600 around July 6 — with the oscillator printing a lower high — explaining the swift pullback to the current pivot at $62,500. The H4 MACD confirms this corrective move via a recent bearish cross, its signal lines sitting below the zero line with the histogram back in negative territory. Two critical order-flow bands stand out: the « Sell Power 70 » zone between $66,000 and $67,000, the top of the current consolidation structure, and the « Buy Power 60 » zone between $57,000 and $58,000, which locks in the technical floor.
15-Minute Chart: Short-Term Breathing Room Before the Decision
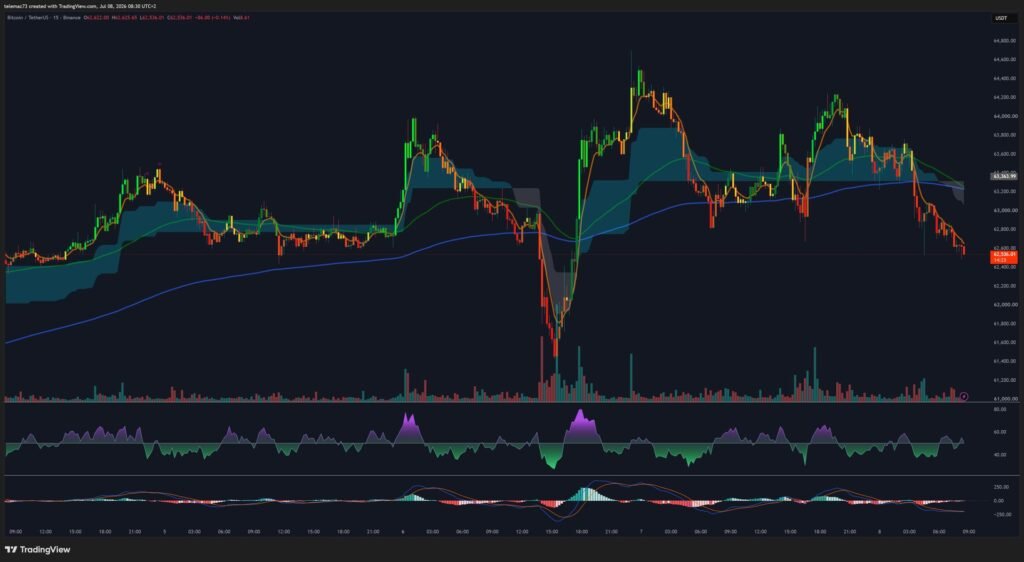
On the 15-minute timeframe, short-term price action shows a gradual slide below dynamic trend markers: at $62,537, price has broken below its 200-period moving average and trades under a bearish-tilted Ichimoku cloud. After the V-shaped rebound off $61,300 following this week’s short squeeze, the market is now consolidating in a descending channel or short-term flag pattern. The 15-minute RSI briefly touched oversold territory below 30, hinting at a slight bullish divergence that suggests an imminent stabilization attempt around the $62,500 support. The intraday MACD, deeply negative, is also starting to flatten out, signaling that immediate selling pressure is easing.
What the Order Book Heatmap Reveals
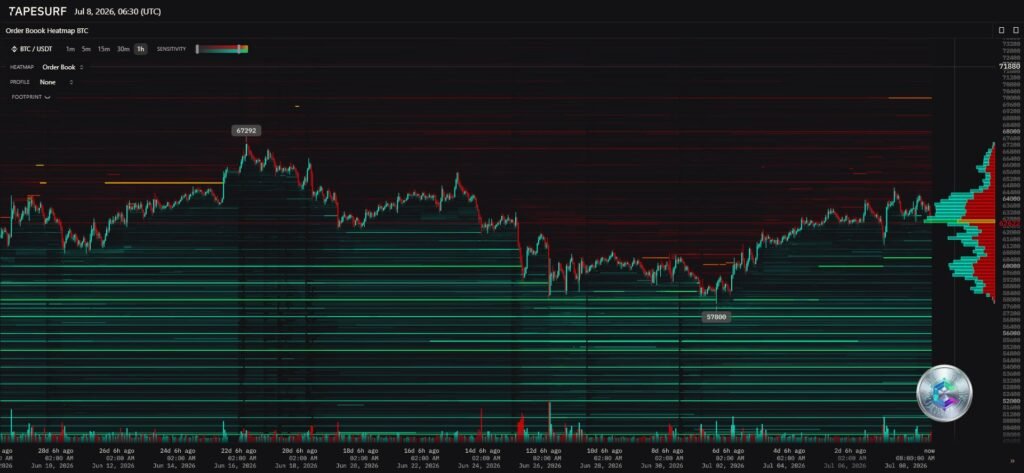
A look at Tapesurf’s order book heatmap as of July 8, 2026, 06:30 UTC, reveals the liquidity architecture on the BTC/USDT pair. The $62,622 level currently acts as a powerful pivot and price magnet, corresponding to the point of control (POC) of recent transaction volume. The thickness of the buy-side bands below price, stretching from $58,000 down to $54,000, confirms the presence of a massive spot buy wall — orders placed mainly by large institutional investors and corporate treasuries, offering a protective floor against any cascading liquidation risk. Conversely, sell-side liquidity bands around $64,000 and beyond $67,000 are capping short-term upside and will require substantial volume to absorb.
| Price Zone | Nature | Impact on Market Structure |
|---|---|---|
| $67,292 | Resistance / liquidations | Previous local top, trigger zone for a major short squeeze |
| $64,000 – $64,500 | Immediate resistance | Confluence with the H4 200 EMA, immediate obstacle to the bounce |
| $62,622 | Point of Control (POC) | Current market center of gravity, short-term equilibrium level |
| $57,800 – $58,000 | Psychological support | 21-month rebound zone, strong whale accumulation |
| $50,000 | Macro support | Cycle psychological support, LTH realized price |
On-Chain Data Confirms a Two-Speed Market
Short-Term Holders: A Textbook Capitulation
Short-term holders (STH) are currently under acute financial stress. Price trades well below their average realized price of $69,007. As a result, the STH-MVRV ratio has slid below the neutral line to roughly 0.82 as of late June, meaning this cohort is sitting on an average unrealized loss of about 18%. This has triggered a classic « weak hands » capitulation, with short-term holders liquidating positions at a loss to long-term buyers with greater financial resilience. Realized losses from large wallets (holding between 100 and 10,000 BTC) peaked at $337 million per day.
Long-Term Holders: The Floor That Is Holding
Long-term holders (LTH), by contrast, remain unfazed. Price remains well above their cost basis, with a realized price of $49,737. This $50,000 threshold represents the true macroeconomic line of defense for the current cycle: as long as the market holds it, the multi-year uptrend is not structurally in question. Additionally, the realized profit-and-loss ratio dropping to its lowest level in 43 months constitutes a historic macro oversold signal, reinforcing the probability of a cyclical bottom forming near current levels.
Key Levels to Watch This Week
| Category | Price Level | Rationale |
|---|---|---|
| Major cycle resistance | $75,203 | 200-day moving average (200 DMA) |
| Medium-term resistance | $69,007 | Short-term holder (STH) realized price |
| Key pivot zone (H4) | $64,000 – $64,300 | H4 200 EMA crossover point |
| Immediate pivot point | $62,622 | Heatmap point of control (POC) |
| Short-term support | $61,300 | Local low, 15-minute support level |
| Psychological support | $58,000 – $60,000 | Major accumulation zone, 21-month low |
| Fibonacci breakdown support | $55,298 | Technical breakdown threshold toward liquidations |
| Macro-structural support | $49,737 | Long-term holder (LTH) realized price |
Two Scenarios for the Weeks Ahead
Scenario 1 — Floor Validation and a Bullish Recovery (estimated probability: 60%)
This scenario rests on the daily RSI’s bullish divergence playing out in full and on the gradual fading of ETF outflows. Macro stabilization, driven by declining energy inflation and the prospect of US rate cuts, would support a gradual return of global liquidity.
- Technical trigger: a confirmed weekly close above the $64,000–$64,300 pivot zone, alongside a validated bullish daily MACD cross.
- Market dynamics: a breakout above the 4-hour 200 EMA would invalidate the local downtrend, forcing short covering and pushing funding rates higher.
- Price targets: a fast move toward resistance at $67,292, followed by a test of the STH realized price at $69,007. Reclaiming $70,000 would reignite bullish momentum on a larger scale.
Scenario 2 — Support Breakdown and Final Capitulation (estimated probability: 40%)
This scenario would rest on continued institutional caution, renewed ETF outflows, and a potential regulatory setback tied to MiCA enforcement or fresh SEC announcements.
- Technical trigger: a daily close below the $58,000 psychological support, triggering an immediate slide under the $57,000 barrier (the H4 « Buy Power 60 » zone).
- Market dynamics: losing $58,000 would invalidate the daily double-bottom structure. A slide below the $55,298 Fibonacci support could trigger a cascade of forced liquidations hitting leveraged positions.
- Price targets: a swift move into the $50,000–$53,000 macro support zone, with an ultimate floor at the LTH realized price of $49,737. This full-purge scenario would flush out the order book ahead of a multi-month accumulation phase.
The Bottom Line
Bitcoin sits at a rarely-so-clear technical and on-chain crossroads: on one side, exhausted short-term holders capitulating into stronger hands; on the other, a long-term holder floor (around $50,000) that has arguably never been more solid. The $58,000–$64,000 range will act as referee over the coming days. A weekly close above $64,300 would open the door toward $69,000 and beyond; a break below $58,000 would shift the conversation back to $50,000, the cycle’s last macro line of defense.
Disclaimer: This article is provided for informational and educational purposes only. It does not constitute investment advice, a recommendation to buy or sell, or an inducement to make any financial decision. Cryptocurrency markets are highly volatile and risky — always do your own research (DYOR) and consult a qualified professional before making any investment decision.

