


In early July 2026, Bitcoin (BTC) is going through a rare restructuring phase, marked by compressed but contradictory volatility signals. After a severe 18% correction in June that briefly pushed prices below the $60,000 threshold, the asset is struggling to rebuild a support base. Between structural selling pressure, record spot ETF outflows, and on-chain oversold signals unseen in years, this report dissects the state of the market through a multi-timeframe technical read, macroeconomic context, and a liquidity map.
Macro Backdrop: Rate-Cut Hopes vs. Institutional Caution
Bitcoin’s trajectory remains tightly linked to global liquidity conditions and monetary policy. Weakening US employment data has revived expectations of Federal Reserve rate cuts, historically a bullish catalyst for risk assets. Meanwhile, the Eurozone services PMI at 49.4 in June suggests a fragile stabilization of the broader economy.
However, Fed Chair Kevin Warsh held rates unchanged at the June meeting while deliberately removing forward guidance. More concerning, nine of eighteen Fed officials now project an additional hike in 2026. This uncertainty confines the market to a sterile $56,000–$62,000 range, at least until the July 29 FOMC meeting.
Capital flows reflect this caution: US spot Bitcoin ETFs suffered $4.5 billion in net outflows in June, their worst month since launch. Citigroup slashed its 12-month price target from $112,000 to $82,000, flagging a bear case at $53,000. In a symbolic shift in institutional sentiment, MicroStrategy sold a portion of its BTC holdings for the first time since 2022.
| Macro Factor | Current State | Modeled Impact |
|---|---|---|
| Fed Policy | Rates held, forward guidance removed | Bearish, short term |
| Spot ETF Flows (US) | Record $4.5B outflows in June | Constant selling pressure |
| US Employment Data | Signs of weakness | Moderately bullish, medium term |
| Corporate Treasuries | MicroStrategy sells for the first time since 2022 | Bearish (psychological shock) |
| Sector Rotation | Capital flight toward AI | Bearish (liquidity drain) |
On-Chain Fundamentals: The Four-Year Cycle Repeats Itself
The current correction fits with striking precision into Bitcoin’s well-established four-year cycle theory, paced by the halving. As in 2014, 2018 and 2022, the market is going through a necessary purge to clear excess leverage and transfer supply from speculative hands to long-term holders. The mining sector illustrates this capitulation: post-halving profitability has collapsed, forcing some miners to liquidate reserves to cover operating costs.
The Realized Profit and Loss Ratio dropped to -0.35 in early July, its lowest level in 43 months — comparable to December 2022, in the aftermath of the FTX collapse. This capitulation asymmetry has historically characterized major market bottoms, suggesting a significant purge has already occurred and that the risk/reward profile is becoming increasingly favorable for long-term accumulation.
Another key level is the Short-Term Holder Realized Price (STH-RP), currently at $69,000. With BTC trading well below this threshold, the majority of recent buyers are sitting on unrealized losses, turning the $68,500–$72,000 zone into a psychological resistance wall, as every rally is sold at breakeven by these underwater holders.
Multi-Timeframe Technical Analysis
Daily Timeframe (1D): A Fractured Structure
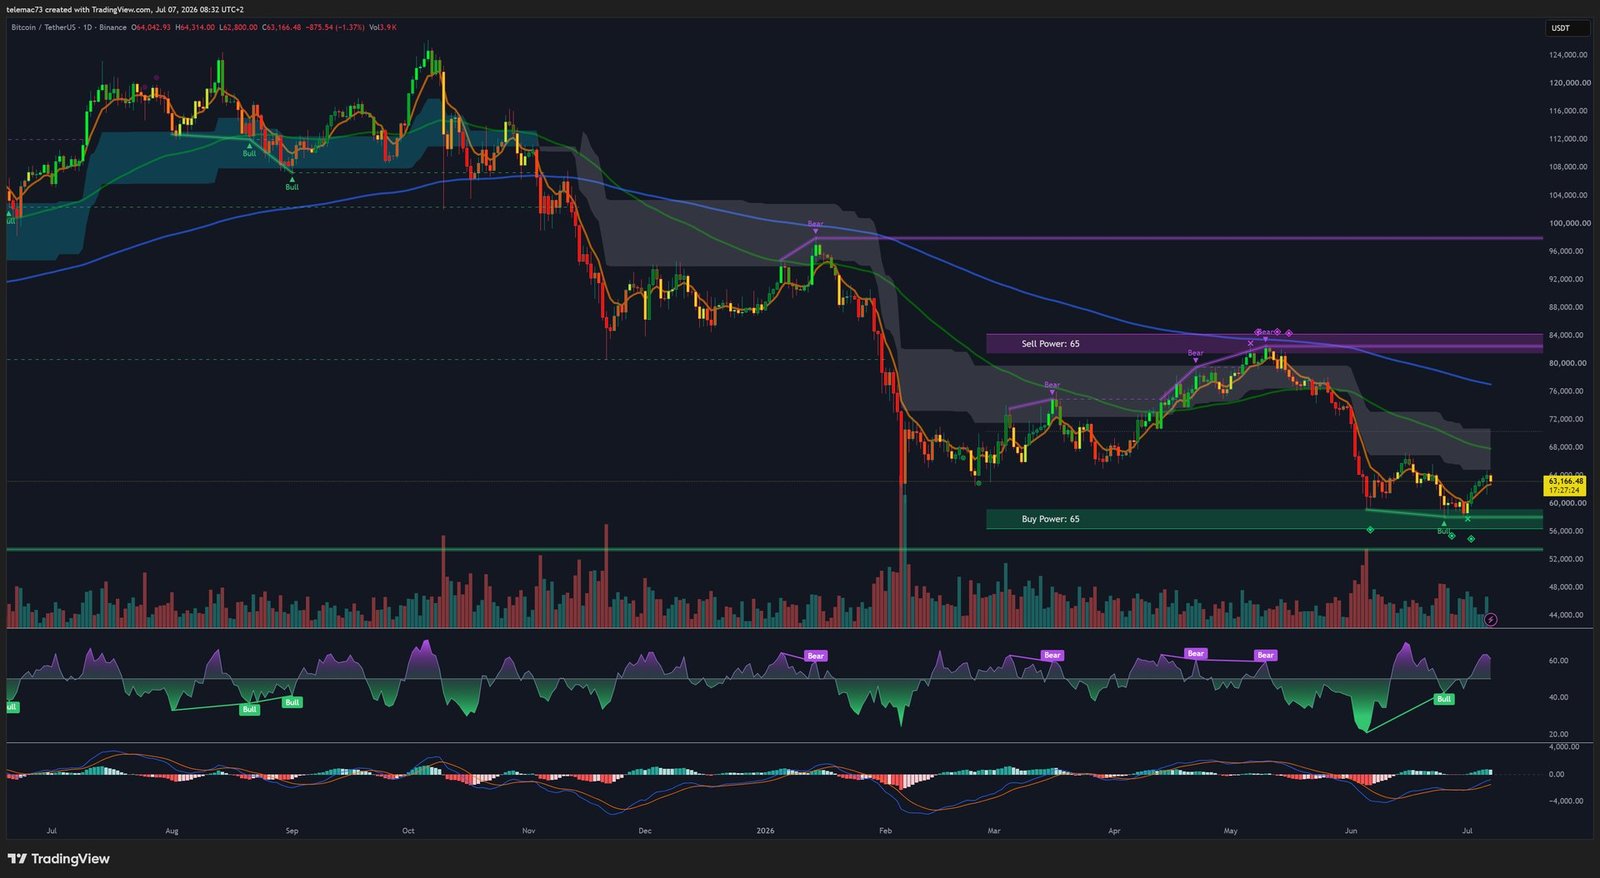
The daily chart shows a broad ascending channel that has been decisively broken, with price closing below its lower trendline for the third time in 2026, finding a temporary floor near $58,190. The stacked exponential moving averages confirm the bearish structure: EMA 20 at $62,382, EMA 50 at $65,672, EMA 100 at $69,399, and EMA 200 at $75,516 — all sitting above current price. The Ichimoku cloud confirms negative momentum. Still, the RSI plunged below 30 during the $58,190 test, forming a latent bullish divergence, while the MACD is attempting a bullish crossover deep in negative territory — a sign of slowing momentum rather than a genuine reversal.
4-Hour Timeframe: Compression and a Short Squeeze
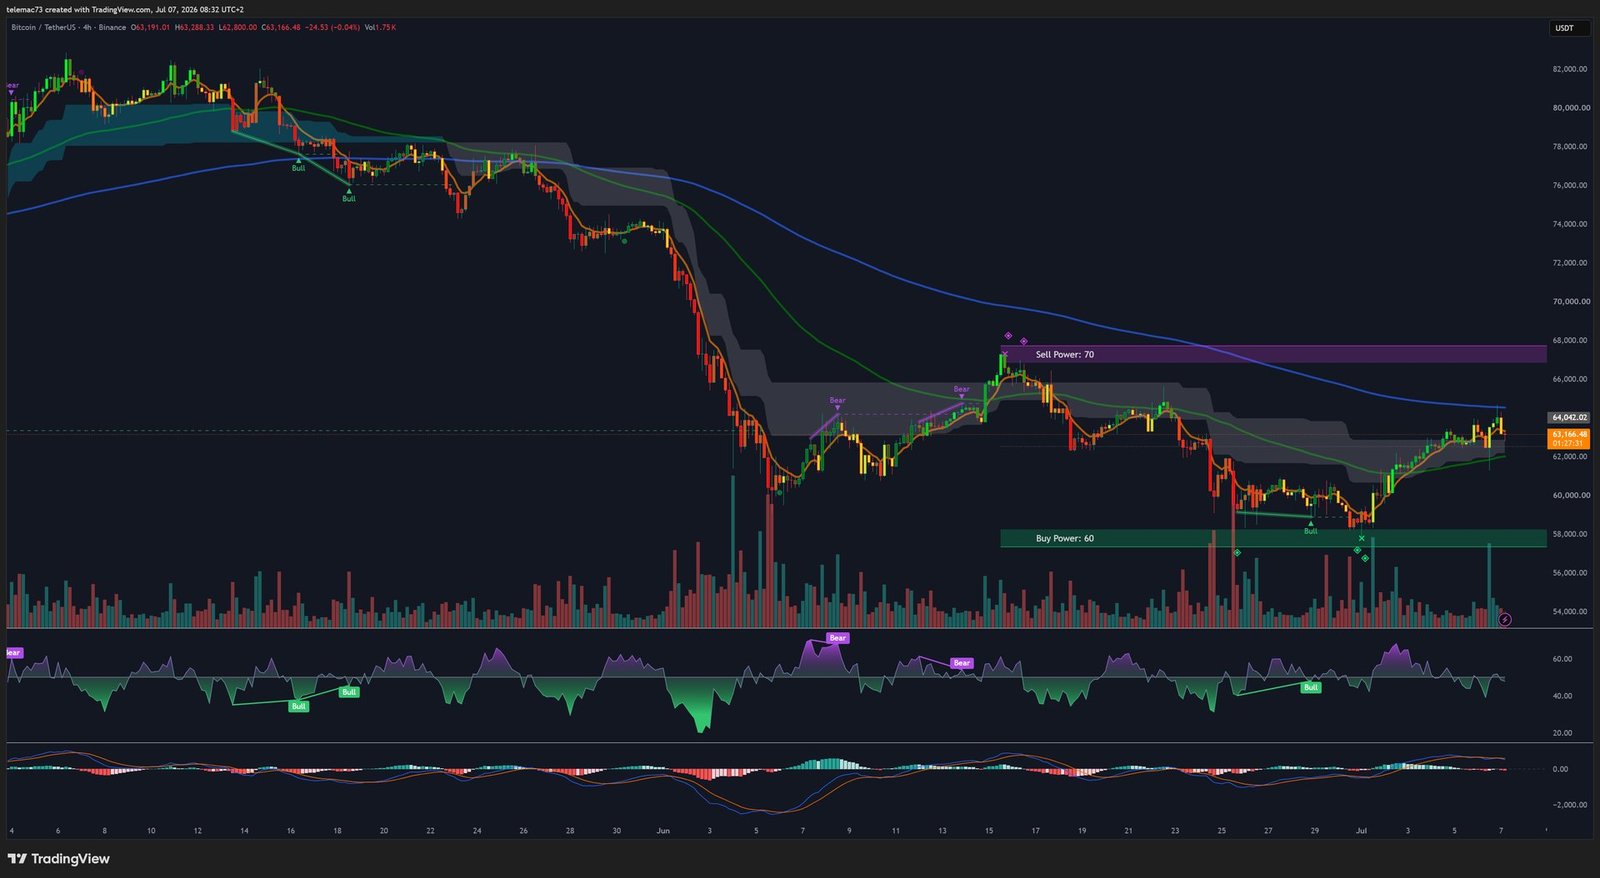
The bounce from $58,190 to the $62,000–$63,196 zone is better explained by a short squeeze than by organic buying: over a 24-hour window, long positions absorbed $47.91 million in liquidations versus just $13.66 million for shorts. Price is carving out a broad symmetric triangle, potentially a bear flag, between a sell zone ($66,000–$68,000) and a buy zone ($58,000–$60,000). The MACD has crossed bullish, but in negative territory, while RSI hovers near 60 without overheating. Price is currently fighting the 50-period moving average, which converges with the daily EMA 20 — a prolonged failure here would open the door to a Death Cross.
15-Minute Timeframe: Choppy Microstructure
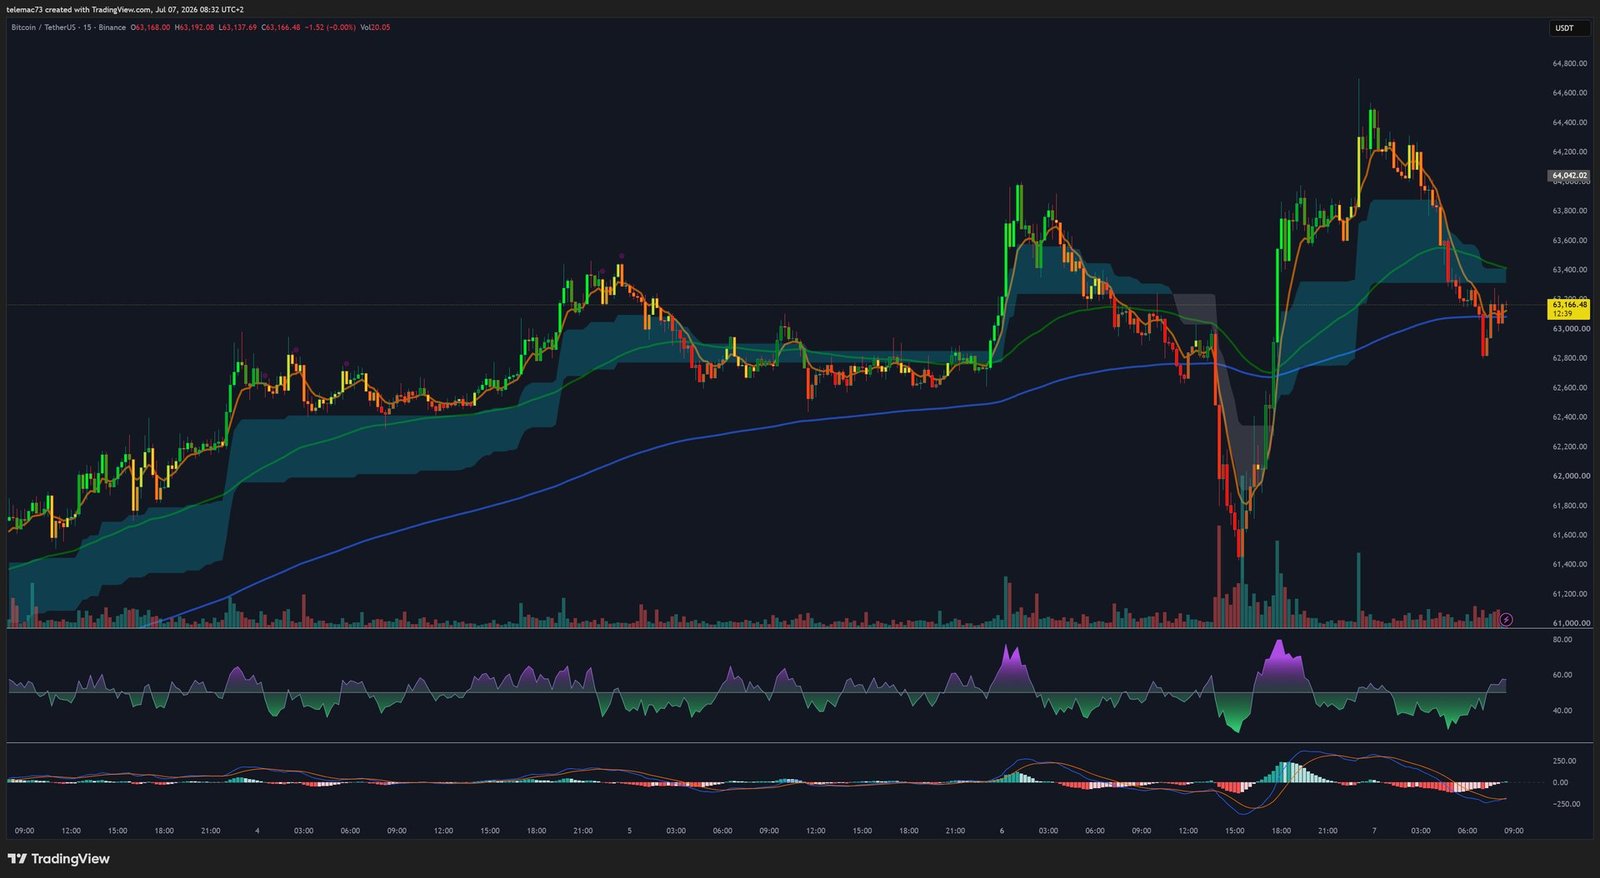
At the very short-term level, the market is moving pivot to pivot with no clear directional conviction. The volume profile’s point of control sits around $61,500–$62,000, while price faces repeated rejection near $63,196. RSI whipsaws erratically between 40 and 60, the 9 and 21 EMAs keep crossing, and long-wick rejection candles consistently mark attempts above $64,000 and below $61,000. The market appears to be waiting for an external catalyst before any structural decision.
Key Technical Levels
| Zone | Level (USD) | Role |
|---|---|---|
| Macro Resistance (EMA 200) | $75,516 | Very strong, out of short-term reach |
| Resistance Wall (STH-RP) | $68,500 – $72,000 | Very strong, near-certain rejection |
| Upper Liquidity Pivot | $67,292 | Magnet for short liquidations |
| Medium-Term Resistance (EMA 50) | $65,000 – $65,672 | Strong |
| Short-Term Resistance (EMA 20) | $62,382 – $63,800 | Moderate |
| Short-Term Support | $60,000 | Moderate (psychological level) |
| Lower Liquidity Pivot | $57,800 – $58,398 | Strong (emergency support) |
| Macro Support | $56,000 – $56,200 | Very strong, last line of defense |
| Capitulation Scenario | $53,000 | Institutional bear case (Citigroup) |
Liquidity Map (Heatmap)
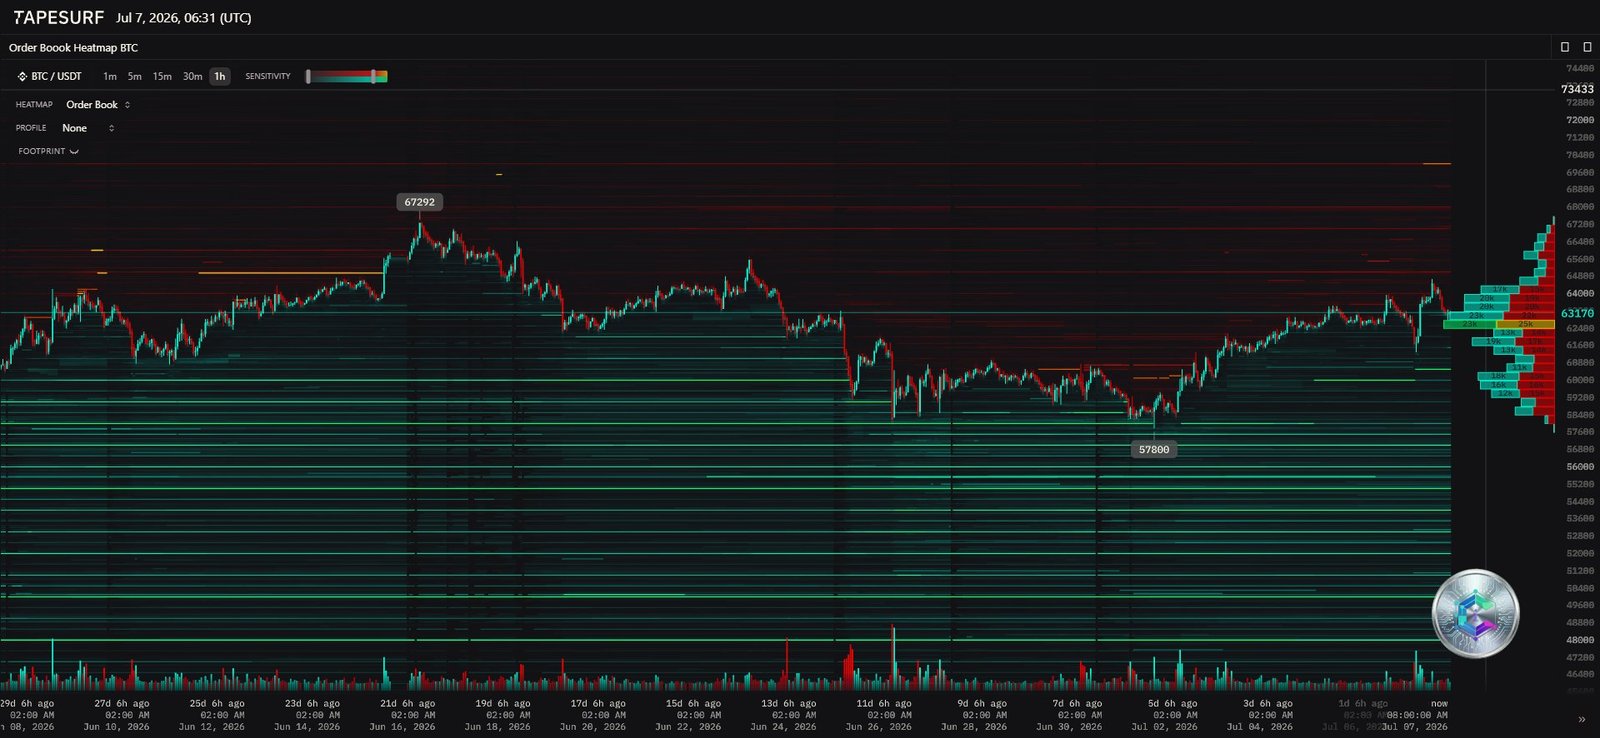
The order book heatmap reveals a polarization around two magnetic poles. On the upside, a massive sell wall spans $65,000 to $69,000, with a pivot identified at $67,292, converging with the daily EMA 50. Polymarket assigns a 71% probability to BTC touching $65,000 in July, but only 24% for reaching $70,000. On the downside, a liquidity pole sits around $57,800, reinforced by the Parabolic SAR at $58,398 as the first line of defense. A break of this level would open the door to a liquidity vacuum leading toward $53,000. Overall, spot ask depth is smothering upside attempts while bid depth remains passive, positioned deeper below.
Cross-Market Correlations and Regulatory Backdrop
On the legislative front, the highly anticipated Digital Asset Market Clarity Act missed its July 4 deadline, stuck in the Senate, leaving only four weeks before the August 7 summer recess. This lack of regulatory clarity is fueling institutional wait-and-see behavior. Coinbase (COIN), the sector’s public-market proxy, trades around $165.48, squeezed between support at $158–$160 and resistance at $173–$180.
On the Ethereum side, the July 1 launch of « Ethereum Institutional, » backed by a consortium representing $250 trillion in combined assets under management, highlights major infrastructure development. Yet ETH has posted three consecutive quarterly declines (-28%, -29%, -25%), proof that institutional capital is positioning on a multi-year horizon rather than chasing short-term volatility. Elsewhere, XRP hovers around $1.11, Solana trades at $79.33, and TRON sits at $0.33.
Two Resolution Scenarios
- Bearish scenario: a prolonged restrictive rate environment would cause the $60,000 support to give way, retesting $58,190 and then $57,800. A confirmed break below $56,200 would trigger a liquidation cascade toward Citigroup’s bear case at $53,000.
- Bullish scenario: a durable halt in ETF outflows, combined with weaker jobs data forcing the Fed toward rate cuts ahead of the July 29 FOMC, could push a close above $62,382–$63,800, triggering a squeeze toward $65,000–$67,292. Validating a genuine cycle reversal, however, would still require reclaiming $69,000 and clearing the $68,500–$72,000 supply zone.
Conclusion
Bitcoin’s market in July 2026 is oscillating in an undecided technical and fundamental zone, torn between generational on-chain oversold signals and a damaged price structure. A cautious, neutral stance appears warranted until a clear directional resolution is confirmed — either a validation of the $53,000–$56,000 support, or a decisive weekly close above $64,000. The volatility compression observed on intermediate timeframes is likely just the prelude to a major expansion move.
Disclaimer: this article is provided for informational and educational purposes only. It does not constitute investment advice, a recommendation to buy or sell, or a solicitation to engage in any financial transaction. Cryptocurrency markets are highly volatile and carry a risk of capital loss. Always do your own research (DYOR) and consult a licensed financial advisor before making any investment decision.

