


Bitcoin enters July 2026 caught between two extremes: a historic collapse in ETF flows on one side, and one of the most violent short squeezes in recent memory on the other. Between weakening macro data, an institutional rotation toward artificial intelligence, and a transatlantic regulatory shake-up, our team breaks down the forces at play and the technical scenarios to watch for the rest of Q3.
1. The macro shock: a jobs report that changed everything
On July 2, 2026, the Bureau of Labor Statistics released a US jobs report that badly missed expectations: just 57,000 non-farm payrolls added in June, far below the 110,000–115,000 consensus. Downward revisions to prior months (-74,000 combined for April and May) and a drop in the labor force participation rate to 61.5%, its lowest level in over five years, reinforced the sense that the economy is cooling faster than anticipated.
| Indicator | Consensus / Prior figure | Actual (June 2026) | Impact on the Dollar (DXY) |
|---|---|---|---|
| Non-Farm Payrolls | 110,000 / 129,000 (revised) | 57,000 | Strongly bearish |
| Unemployment rate | 4.3% | 4.2% | Neutral / bearish |
| Participation rate | N/A | 61.5% | Bearish |
| Fed Funds rate | 3.50% – 3.75% | 3.50% – 3.75% | Neutral |
Under Chair Kevin Warsh, the Fed has adopted a leaner, data-driven communication style. Speaking at Sintra on July 1, Warsh declined to commit to a July rate cut, reaffirming the 2% inflation target. Markets, however, quickly repriced their expectations, with bets on further tightening falling from around 65% to 50%, pushing the Dollar Index (DXY) down toward the 100.50–100.70 zone. Bitcoin, which has historically acted as an inverse barometer of dollar strength, mechanically rebounded from its local lows near $57,750.
2. The ETF paradox: worst month on record, then a sudden turnaround
June 2026 will go down as the worst month ever recorded for US spot Bitcoin ETFs, with $4.5 billion in cumulative net outflows, surpassing the previous record set in February 2025. BlackRock’s IBIT alone absorbed more than $3.3 billion in net redemptions. Total ETF assets under management fell from $94.1 billion to roughly $70.9 billion in a single month.
Much of this bleed-out stems from a broad sector rotation into AI and semiconductor stocks, draining the market depth needed to sustain a durable Bitcoin recovery. As a direct consequence, Citigroup cut its 12-month price target for BTC from $112,000 to $82,000 on July 1, with a bear-case scenario down at $53,000.
July 2 marked a turning point, though: after ten consecutive days of net outflows (a combined $2.73 billion withdrawn), Bitcoin ETFs recorded a daily net inflow of $221.7 million.
| ETF Issuer | Ticker | Net Flow (July 2, 2026) | Comment |
|---|---|---|---|
| Fidelity | FBTC | + $166.0M | Aggressive resumption of institutional buying |
| ARK Invest | ARKB | + $91.8M | Confidence rebound |
| VanEck | HODL | + $4.4M | Marginal stabilization |
| BlackRock | IBIT | – $40.4M | 11th consecutive day of outflows |
3. A two-speed regulatory landscape: MiCA in Europe, a pro-crypto pivot in the US
July 1, 2026 marked the definitive entry into force of MiCA in Europe. Only about 210 of more than 3,000 applicant firms obtained full authorization — a 7% success rate. Lacking approval, Binance had to suspend part of its services (spot orders, deposits, Earn products) for EU clients from July 1 onward, causing a notable fragmentation of liquidity across the continent.
In the US, the dynamic runs in the opposite direction. Donald Trump has positioned himself as a leading pro-crypto figure, pushing for tax exemptions on Bitcoin payments and the creation of a strategic Bitcoin reserve. The SEC, under Brian Daly, has acknowledged past missteps in handling crypto ETF filings and is now adopting a more neutral, unified approach — including toward prediction markets like Polymarket, whose monthly volume grew from $1 billion in 2025 to more than $8 billion by March 2026.
4. Multi-timeframe technical analysis
4.1 Daily chart: the bearish structure still dominates
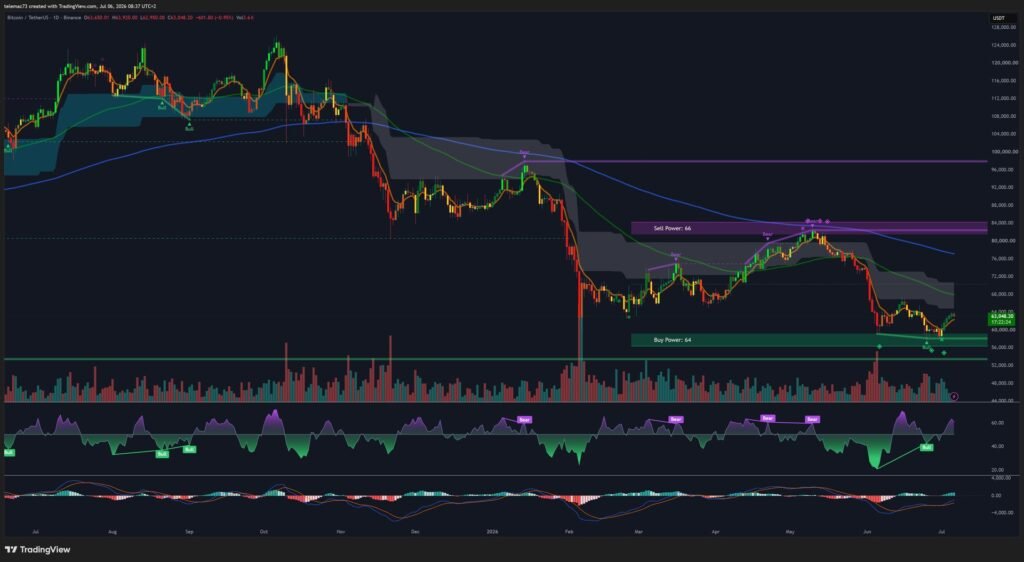
On the daily timeframe, Bitcoin is tracing a bearish Head and Shoulders reversal pattern, with the « head » corresponding to the highs set above $73,000 earlier in the year. The Ichimoku cloud, wide and dark, acts as a massive dynamic resistance above price, confirming the underlying downtrend. Power bands show Sell Power at 66 versus Buy Power at 64, illustrating recent seller dominance. Oscillators, however, are showing signs of seller exhaustion following the recent capitulation wick.
4.2 4-hour chart: the technical repair is underway
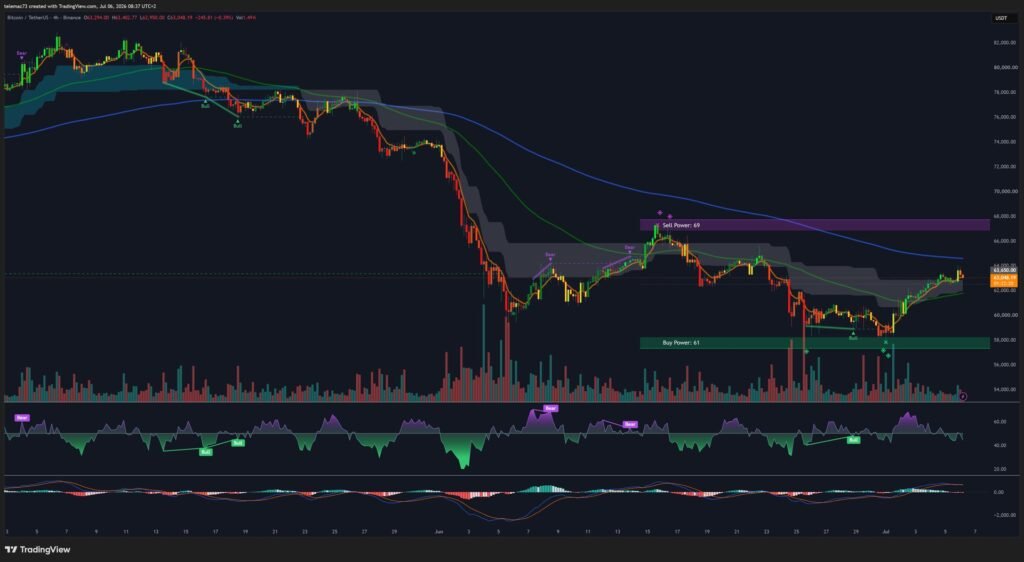
After a local floor near $57,735, BTC entered a stabilization phase on the 4H. Support marked by the green « Buy Power: 61 » band held firm, while the « Sell Power: 69 » resistance is capping the market near $67,000. The most encouraging signal: a clean bullish MACD crossover (Golden Cross), accompanied by an expanding green histogram and an RSI firmly back above the 50 line.
4.3 15-minute chart: the fingerprint of a short squeeze
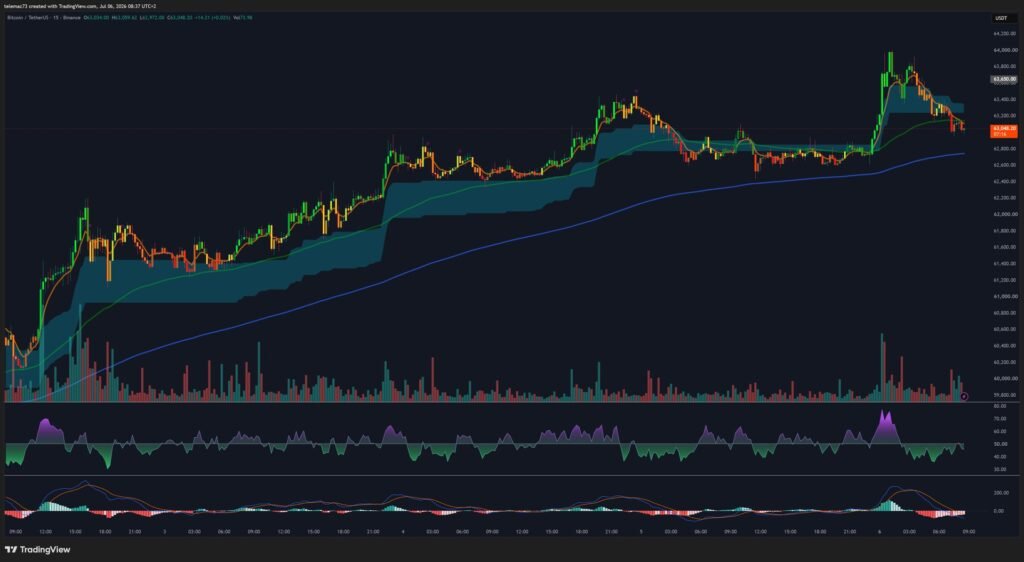
On the 15-minute chart, the move is dramatic: near-vertical green candles propelled price from under $60,000 to above $63,800 — the textbook signature of a short squeeze rather than organic spot accumulation. Since then, the market has been digesting the move within a compression pattern (bull pennant or symmetrical triangle), with RSI cooling off from overbought territory and MACD flashing a short-term bearish divergence.
4.4 Order book heatmap: where the liquidity walls sit
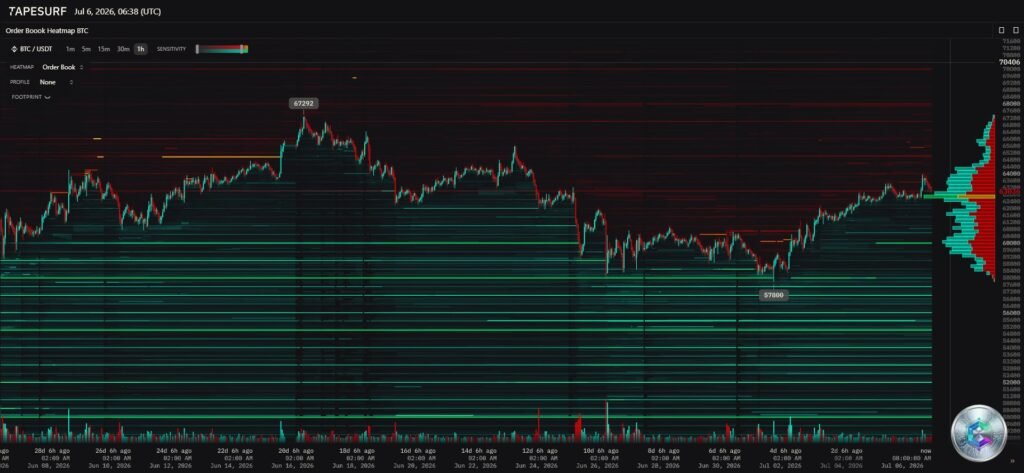
The order book map reveals a massive resistance wall around $67,292, where sell-side liquidity is heavily concentrated. Conversely, a structural support zone sits near $57,860, the level where large holders appear to have positioned their protective buy orders. The Point of Control (POC) of the volume profile sits around $63,036, marking the current equilibrium zone between buyers and sellers.
5. Liquidations and market microstructure
During the drop to $59,700, price sliced through clusters of bullish liquidations, building up overhead supply between $61,500 and $63,000. The NFP surprise then trapped short positions, triggering a forced-liquidation feedback loop: more than $281 million in bearish bets were wiped out across the crypto market within 24 hours, over $100 million of that in BTC alone. Options expiring July 8 show a clear bias toward calls, with a « Max Pain » point sitting precisely at $63,000.
6. Two scenarios for the rest of Q3
Bullish scenario
A confirmed breakout above $63,800 on expanding volume would invalidate the Head and Shoulders pattern and open the path toward $73,000–$77,000, with a first intermediate target at $67,292. This scenario requires a durable halt to ETF outflows, ETH stabilizing above $1,600 and SOL above $70, and continued deterioration in US economic indicators pushing the Fed toward easing.
Bearish scenario
A failure to break free of the $63,000 zone, followed by a downside break of the pennant, would send the daily MACD back into a downtrend. Losing support at $57,860 and then $56,200 would validate the Head and Shoulders pattern and trigger a cascade of liquidations on late longs, with a downside target near $50,000–$53,000 — in line with Citigroup’s bear-case scenario.
Conclusion
Bitcoin is currently balancing on a knife’s edge between two opposing regimes: on one side, the structural weight of record ETF outflows and European regulatory fragmentation; on the other, a violent short squeeze fueled by a sharp cooling of the US labor market. The $63,000–$63,800 zone is the decisive pivot: turning it into support would validate the thesis of a market bottom, while a rejection would confirm a simple bull trap within a broader downtrend. Close monitoring of ETF flows and the key heatmap levels remains, for now, the best navigational guide.
Disclaimer: This article is provided for educational and informational purposes only. It does not constitute investment advice, a recommendation to buy or sell, or a solicitation to trade digital assets. Cryptocurrency markets are highly volatile and carry significant risk of capital loss. Always do your own research (DYOR) and consult a licensed financial advisor before making any investment decision.

