
As June 2026 draws to a close, Bitcoin is navigating one of the most fragile phases of its recent history. After peaking at $126,272 in October 2025 amid spot-ETF euphoria, the asset has shed more than 53% of its value and is now trading between $59,468 and $59,635, squeezed between a restrictive macroeconomic ceiling and an on-chain floor defended by whale accumulation. This multi-timeframe analysis (15-minute, 4-hour, daily) combined with order-book liquidity mapping helps isolate the most likely scenarios for the third quarter.
A macro backdrop turning hostile
Kevin Warsh’s arrival as Federal Reserve Chair marked a major rhetorical pivot. At the mid-June 2026 FOMC meeting, the Fed held rates in the 3.50%-3.75% range but formally dropped its easing bias. Nine of eighteen committee members now expect at least one more rate hike before year-end, ruling out any quick return to cheap money.
This restrictive stance coincides with resurgent inflation: US CPI rose 4.2% year-over-year in May, its highest level in three years, while PPI jumped 6.5%. Simultaneously, the Bank of Japan raised its policy rate to 1%, a level unseen since 1995, triggering a brutal unwind of the global carry trade that had been funding part of the world’s speculative positioning, Bitcoin included.
ETFs and MicroStrategy: the end of the perpetual-accumulation taboo
US spot Bitcoin ETFs, long the primary engine of institutional demand, have become a distribution channel. In June 2026 alone, they recorded over $4.06 billion in cumulative net outflows, a new record. BlackRock’s iShares Bitcoin Trust (IBIT), previously seen as a near-permanent accumulation sink, posted its worst week ever with nearly $980 million in redemptions.
On June 29, 2026, MicroStrategy made a historic strategic U-turn, launching a Bitcoin monetization program of up to $1.25 billion — its first liquidation in four years — to help fund debt servicing and preferred-share dividends. This shift introduces a structural risk of persistent selling pressure on the market.
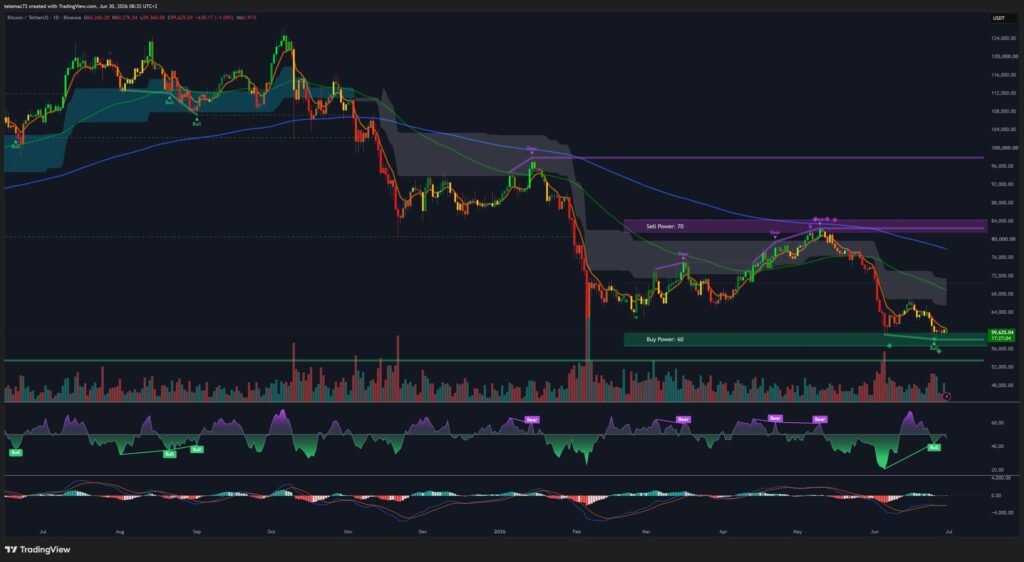
Daily timeframe: a support zone under extreme strain
On the daily chart, price currently sits around $59,635 after breaking the uptrend line that had held since early 2025. A major support zone has formed between $57,885 and $58,725, resulting from the convergence of four technical factors: the 61.8% Fibonacci retracement of the 2022 advance, the lowest weekly close of August 2024, the lower boundary of an Andrews pitchfork drawn since 2023, and proximity to the 200-week moving average.
The daily RSI, while still below the 50 midline, is forming a developing bullish divergence: price prints lower lows while RSI prints higher lows, signaling fading selling pressure. The MACD remains negative but its histogram is flattening, reinforcing the view of a decelerating downside velocity.
| Key level (USD) | Technical significance |
|---|---|
| $67,253 | Bearish invalidation pivot — bull market resumption |
| $62,795 | First major resistance |
| $57,885 – $58,725 | Ultimate support confluence (Fibonacci, Pitchfork) |
| $52,204 | 100% extension of the 2025 decline |
| $49,577 | Historic structural floor (August 2024) |
4-hour: Death Cross and bear flags
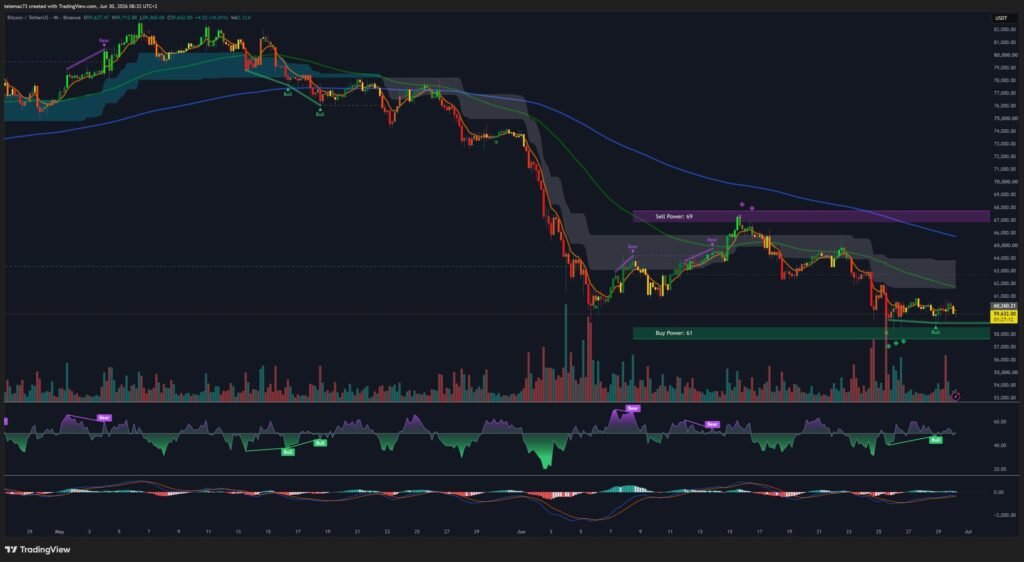
On the 4H chart, price trades around $59,632, beneath a thickened Ichimoku cloud acting as dynamic resistance. A confirmed « Death Cross » between the short and long moving averages has occurred, and the structure documents a succession of bear flags. A support zone spans $58,000 to $59,000, currently being tested. The 4H RSI nonetheless shows an emerging bullish divergence, while the MACD histogram shows shrinking red bars. A sustained close above $60,750-$61,000 would open a genuine technical repair gate.
15-minute: market noise and liquidity hunting
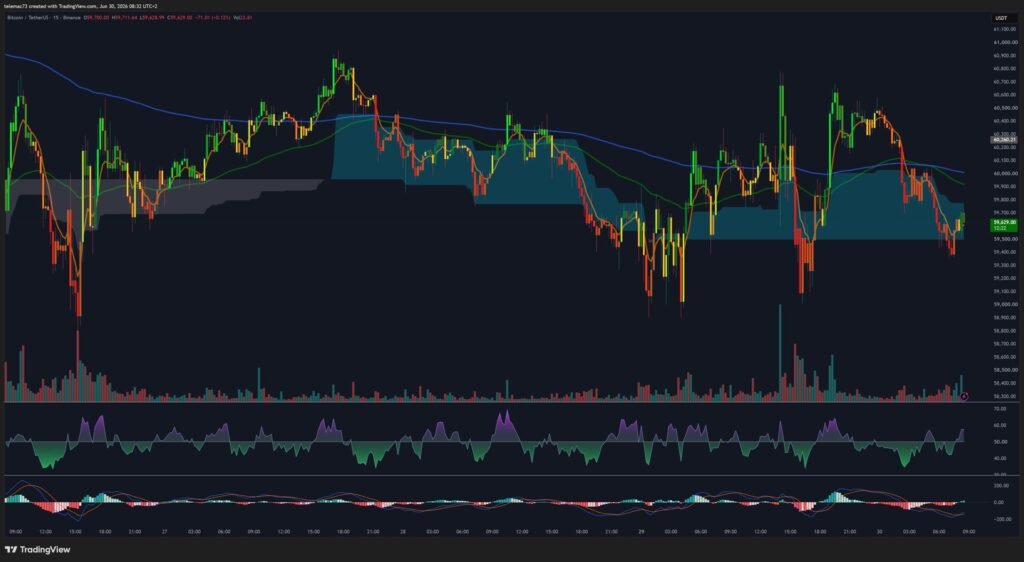
On the intraday scale, around $59,629, the market is moving in wide, directionless horizontal swings. The 15m RSI swings violently between oversold and overbought, a classic signature of high-frequency algorithmic activity. Given its chaotic nature, this timeframe should not be used as the sole basis for a directional decision.
Liquidity mapping: the order-book heatmap
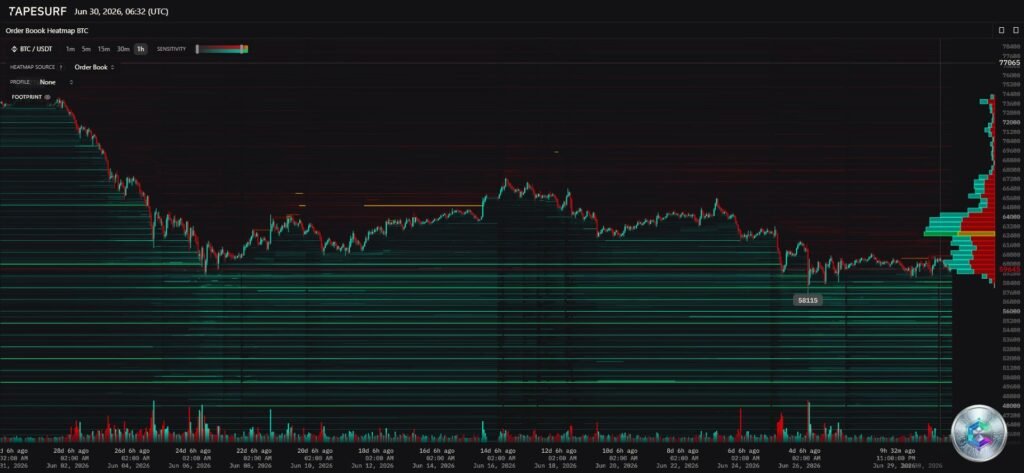
The heatmap reveals a dense sell wall between $64,500 and $65,000, a potential short-liquidation zone in case of a rebound. Conversely, a dangerous « air pocket » sits between $56,000 and $57,000, where nearly $1.6 billion in leveraged long positions are exposed. A loss of the $57,885 support could trigger a cascading liquidation move into that zone. Additionally, over $1.2 billion in put options are concentrated at the $60,000 strike, generating delta-hedging pressure that mechanically caps rebound attempts.
The on-chain divergence: whales buying while Wall Street sells
While ETFs and corporate treasuries distribute, large wallets have accumulated roughly 270,000 BTC over the past thirty days, absorbing retail panic. The MVRV Z-Score, down to around 0.41, signals a structural undervaluation of the asset, while Bitcoin reserves on exchanges have hit a seven-year low, underscoring a tightening of available supply.
Two scenarios for Q3
Capitulation scenario: a weekly close below $57,885 would open the path to the $56,000-$57,000 liquidity void, then toward the $52,204 and potentially $49,577 targets, validating an extended crypto-winter scenario.
Reversal scenario: defense of the $58,000 zone, combined with the RSI’s bullish divergence and continued whale accumulation, could open the way to a progressive reclaim of $60,750-$61,000, then $62,795, with a possible short squeeze toward $65,000. Full invalidation of the bearish structure, however, would only be confirmed above $67,253.
In the meantime, caution remains warranted: the market is still under the grip of exogenous macro variables and major corporate balance-sheet adjustments.
Disclaimer: This article is provided for educational and informational purposes only. It does not constitute investment, financial, or trading advice of any kind. Cryptocurrency markets are highly volatile and all investments carry risk of capital loss. Always do your own research (DYOR) and consult a qualified financial advisor before making any investment decision.