

Bitcoin is navigating a critical phase of structural reset as June 2026 draws to a close. Trading near the psychological threshold of $60,000 after touching a 20-month low of $58,000, BTC is exhibiting multidimensional vulnerability that goes far beyond a typical cyclical correction. A confluence of technical deterioration, institutional capital flight, tightening monetary policy, and imminent regulatory shocks paints a picture that every serious market participant must understand.
🔥 Liquidity Heatmap: Where the Real Battle Is Fought
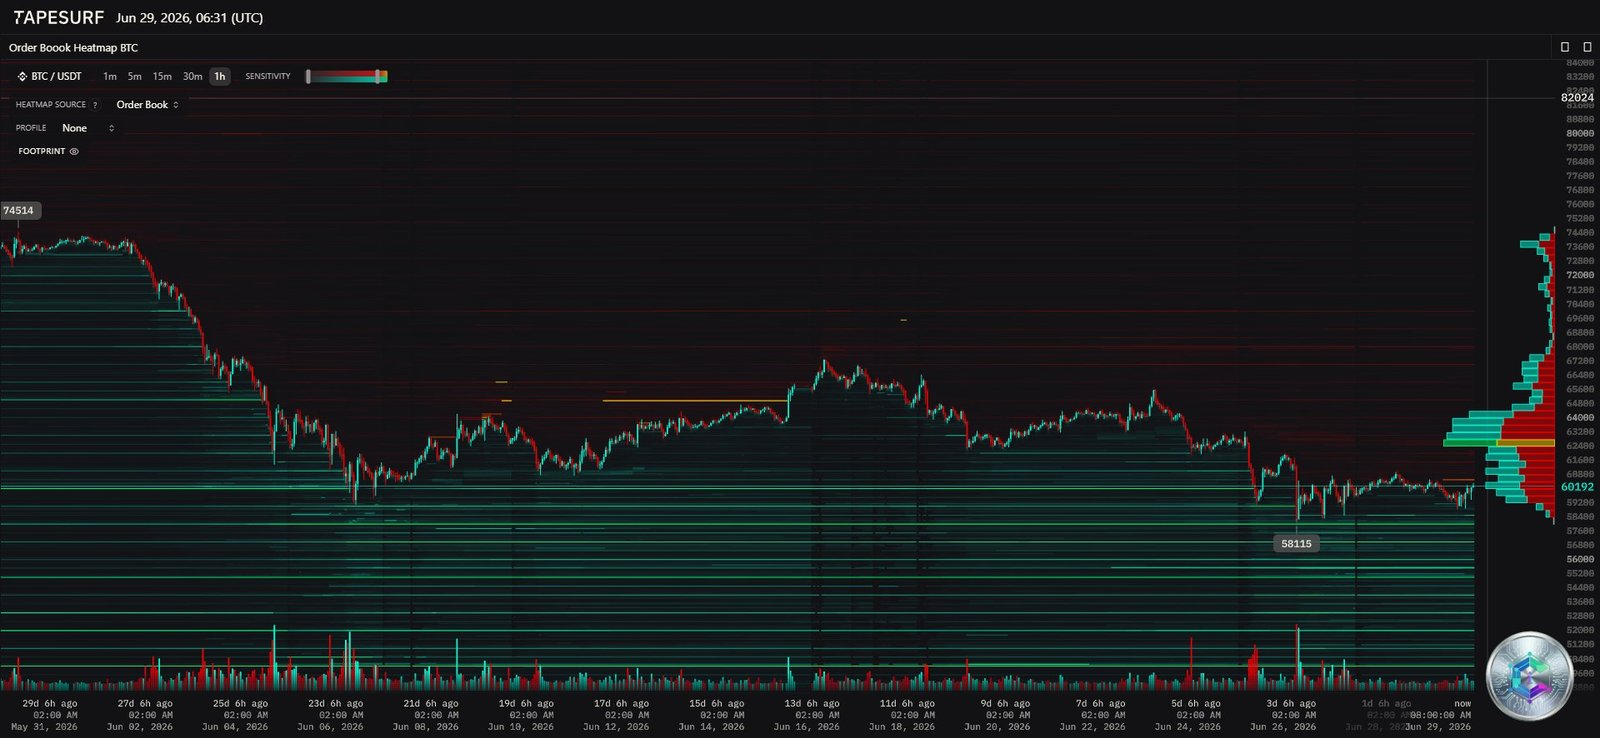
Between June 24 and 25, markets underwent a brutal leverage purge, liquidating nearly $1.8 billion in open interest, borne disproportionately by long positions. Despite this flush, retail trader positioning remains dangerously skewed to the buy side: longs account for 58% of total exposure, reaching 66.8% on certain retail segments.
The heatmap analysis identifies three critical liquidity clusters that will dictate the next impulsive moves:
- $60,200 – $60,400: Immediate compression zone. Intraday ceiling composed of recent short sellers’ stop-loss orders. A breakout here could fuel a minor short squeeze.
- $63,000 – $65,000: Critical upper magnetism. Maximum density between $64,500 and $65,000. If $61,000 breaks upward, HFT algorithms will target this pole.
- Below $58,000: Dangerous lower void. A confirmed break would face minimal algorithmic resistance before hitting the next major wall at $56,000 – $57,000.
📊 Macro Chart Analysis: The Daily Timeframe

The defining technical event of June 2026 is the breakdown below the 200-week Simple Moving Average, currently at $62,445. In Bitcoin’s entire price history, this institutional curve has invariably separated bull market cycles from prolonged crypto winters. Previous breaches in 2015, 2018, and 2022 each preceded 6-to-18-month periods of sustained price depression.
On the daily chart, price action is capped by a bearish EMA stack: BTC trades below the 200-day, 100-day ($71,714), 50-day, and 20-day EMA ($63,800). The daily RSI recently plunged to 31, grazing extreme oversold territory without generating a convincing bounce — a textbook markdown phase signature.
The dominant chart pattern is a bear flag whose downside projection targets the $55,000 region, unless the 200-week SMA is reclaimed on exceptional volume. A mitigating factor: the recent intraday low held just above the 61.8% Fibonacci retracement of the full 2022–2025 bull run, calculated at $57,802.
⏱️ Intermediate Analysis: The 4-Hour Chart
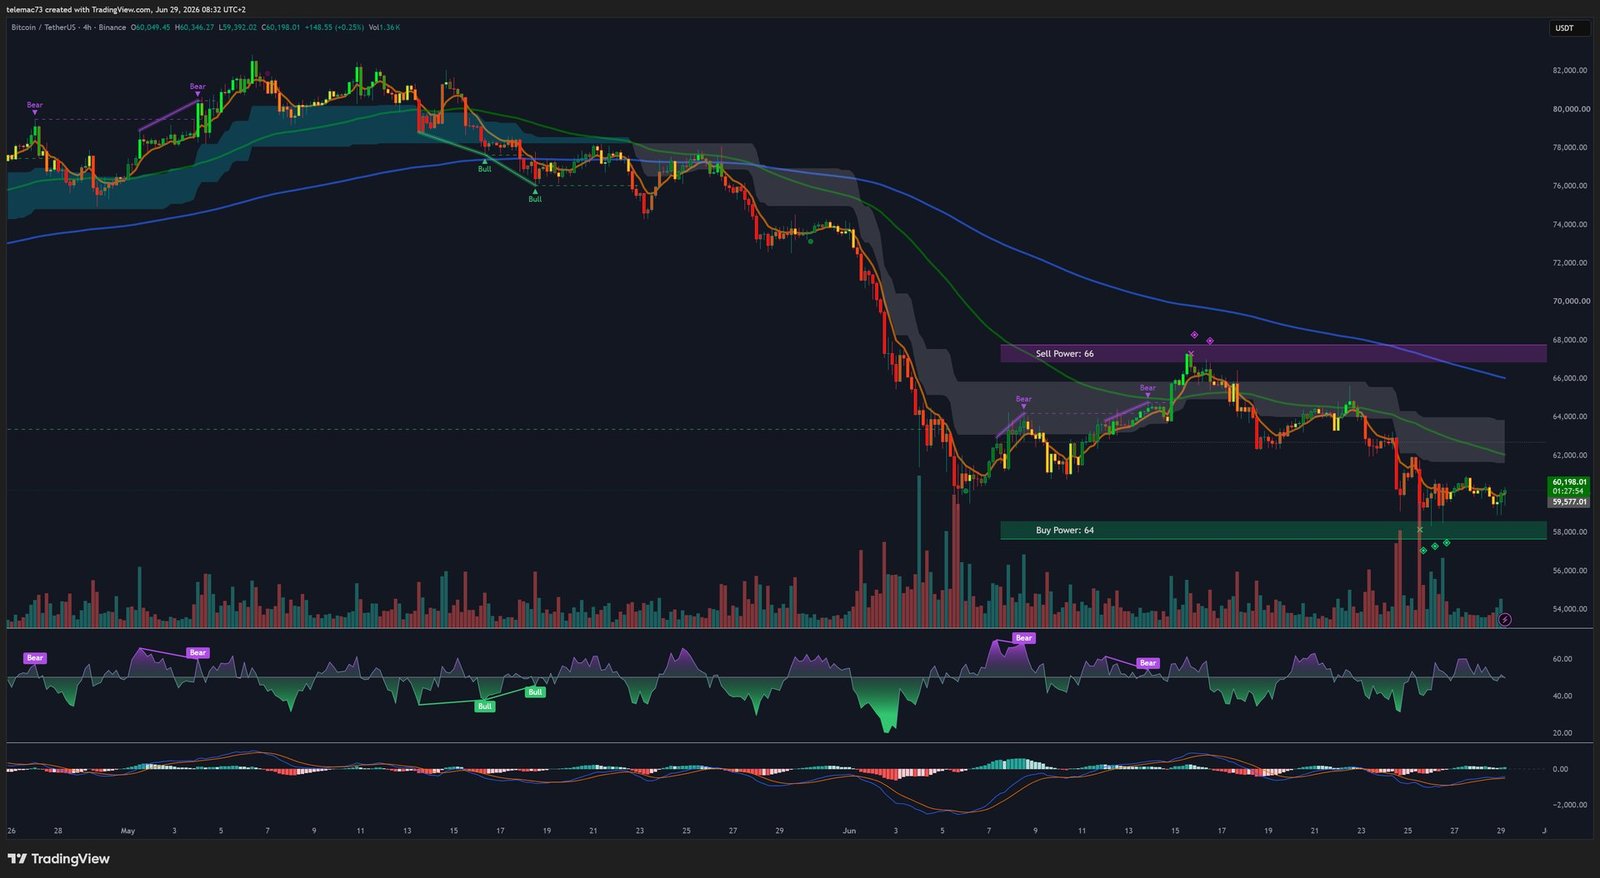
On the 4H timeframe, Bitcoin remains trapped in the lower half of a descending Keltner Channel, with the midline at $61,200 acting as dynamic short-term resistance. The 4H RSI, bouncing to ~37, consistently fails to breach the 50 neutral line — a hallmark of bear market rally dynamics driven by short-covering rather than genuine buy-side demand.
The 4H MACD shows localized bullish crossovers below the zero line, but with insufficient histogram expansion to signal trend reversal. A Death Cross (50-period EMA crossing below 200-period EMA on 4H) has already materialized higher in the structure, reinforcing the dominant bearish inertia.
🔬 Micro-Structure: The 15-Minute Chart
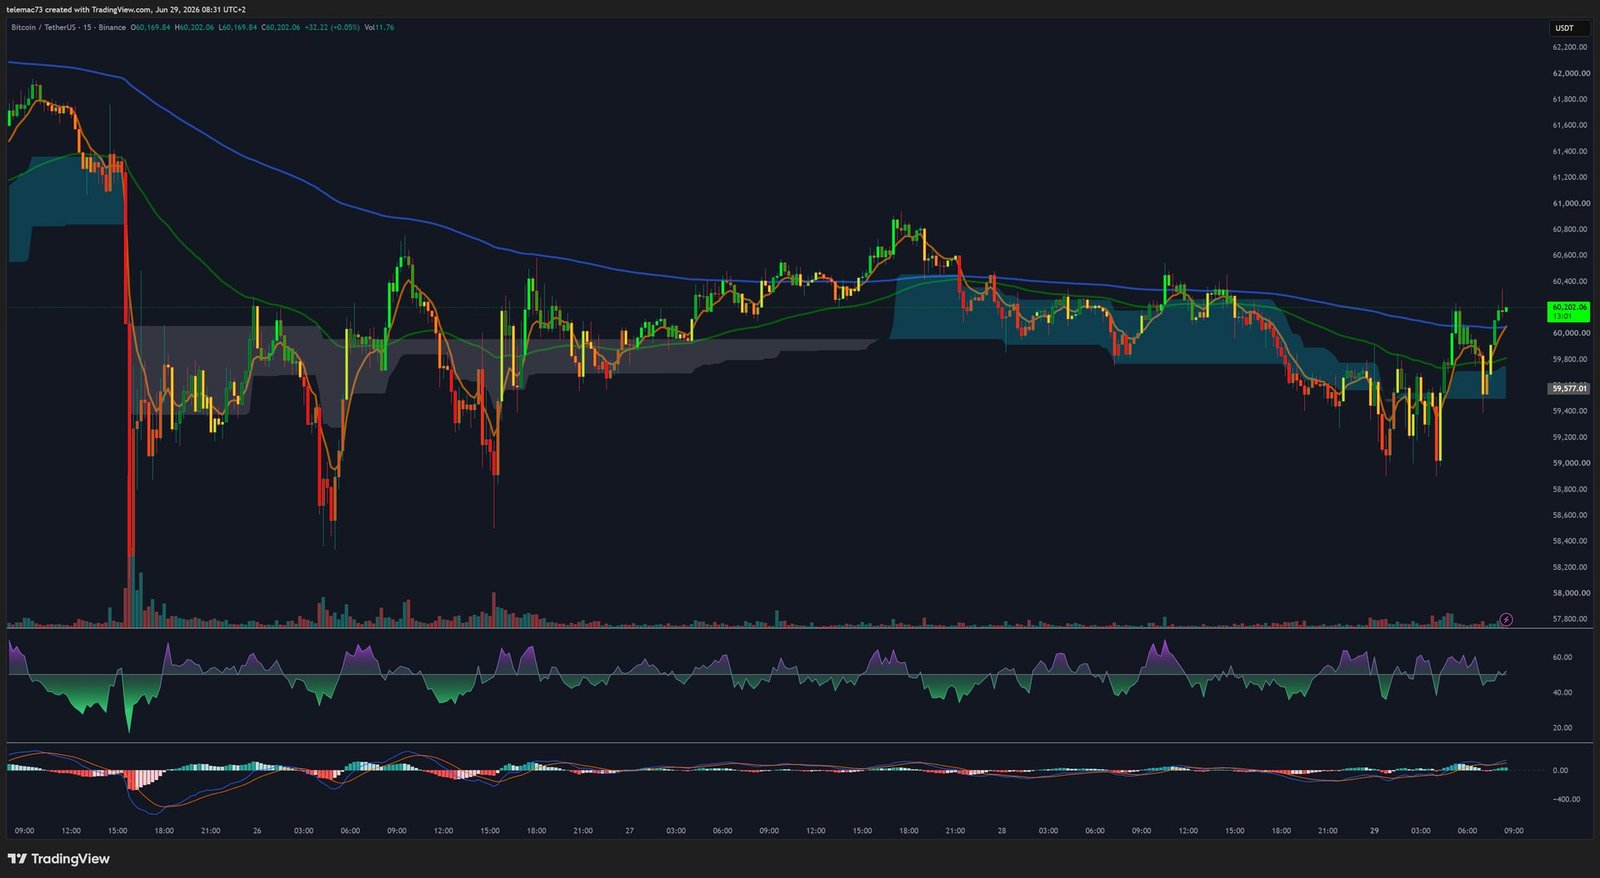
The 15-minute chart reveals descending triangles characterized by a flat support base in the $58,000–$58,400 zone against a series of progressively lower highs. This compression pattern historically resolves to the downside. However, long lower wicks (pin bars) within the $58,000–$59,750 range suggest active TWAP-based institutional accumulation algorithms are defending the lows.
For a genuine micro-structural reversal, Bitcoin needs to generate a sequence of higher lows and higher highs on the 15M, leading to the recapture of the $60,750–$61,000 pivot.
📐 Key Technical Levels at a Glance
| Price Level (USD) | Type | Technical Significance |
|---|---|---|
| $71,714 | Macro Resistance | 100-day SMA (descending) |
| $70,876 | Major Pivot Resistance | 50% retracement of 2022–2025 bull run |
| $64,500 – $65,000 | Short Squeeze Zone | Massive short liquidation cluster on heatmap |
| $63,800 | Dynamic Resistance | 20-day EMA |
| $62,445 – $62,446 | Historical Pivot | 200-week SMA — former support turned resistance |
| $61,750 – $62,250 | Structural Repair Zone | Must be reclaimed to validate bullish reversal |
| $61,200 | Dynamic Resistance 4H | Keltner Channel midline |
| $60,750 – $61,000 | Short-term Pivot | First escape gate from lower value reset |
| $58,000 – $59,750 | Intraday Absorption Zone | Spot buyer defense line |
| $57,802 | Ultimate Macro Support | 61.8% Fibonacci retracement (2022–2025) |
| $56,000 – $57,000 | Deep Liquidity Support | Last major buy-side wall on heatmap |
The Fear & Greed Index has collapsed to 14/100 (« Extreme Fear »), a multi-month low. More critically, over 50% of circulating BTC supply is now underwater on an unrealized basis, creating a powerful negative feedback loop: holders are incentivized to exit at breakeven on any bounce, capping recovery amplitudes.
🏦 The ETF Complex Fracture: BlackRock Leading the Exodus
U.S. spot Bitcoin ETFs — once heralded as the vehicle for institutional adoption — have become the primary channel for capital hemorrhage. June 2026 cumulative net outflows have surpassed $6 billion. In the week of June 22–26 alone, $1.79 billion exited these vehicles.
| Period | Total US ETF Net Flow | IBIT (BlackRock) Net Flow |
|---|---|---|
| June 22–26 | – $1,787.3M | – $1,303.5M (≈ 73%) |
| June 26 (daily) | – $444.5M | – $444.5M (100%) |
| 2026 YTD Cumulative | ≈ – $4,600M | — |
On June 26, 100% of all net ETF outflows originated from BlackRock’s IBIT alone. This structural shift demonstrates that Bitcoin’s liquidity is now inseparable from the macro asset allocation decisions of traditional finance.
🏢 Strategy (ex-MicroStrategy): The Corporate Treasury Model Breaks Down
Strategy (NASDAQ: MSTR), the world’s largest private Bitcoin holder, is seeing its financial engineering model seize up. Its mNAV ratio (market cap / net asset value) has fallen below parity (1.0) as of June 26, 2026 — markets refusing to assign any premium to the company beyond the raw value of its BTC holdings.
The consequences are severe: the company has drastically reduced its BTC purchases (≈ 3,600 BTC in June) and documented initial sales, as operational cash reserves fell from 7 years of runway to just 10 months. The disappearance of this systematic, price-indifferent buyer removes a critical structural safety net.
🏛️ Fed Chair Warsh: « Higher for Longer » and the AI Capital Rotation
Since assuming office on May 22, 2026, new Fed Chair Kevin Warsh has imposed a strategic break: elimination of the quarterly « dot plot, » an overtly hawkish stance, and a commitment to maintaining restrictive rates. This mechanically compresses the valuation of non-yielding assets like Bitcoin.
A compounding phenomenon: speculative flows are rotating out of crypto and into AI and semiconductor stocks (e.g., Micron +16% post-earnings). On the retail side, World Cup 2026 prediction markets absorbed over $13 billion in transactional volume in a single month, starving the crypto market of a vital oxygen supply.
🇪🇺 The MiCA Shock: Binance Suspended in Europe from July 1, 2026
July 1, 2026 marks the end of all MiCA transition periods. ESMA now requires full authorization for any crypto service provider operating in the EU. Yet as the deadline arrived, only 216 of 3,167 registered VASPs (7%) hold a valid license. Binance — the world’s largest exchange — announced the suspension of all services to EU users, having failed to secure its European passport. Penalties can reach 12.5% of annual revenue.
This forced liquidity fragmentation elevates the risk of a violent flash crash if the $58,000 breakdown coincides with the regulatory transition disrupting market-making infrastructure across the continent.
📅 July Seasonality: A Historical Contrarian Signal?
| July Seasonal Scenario | Average Historical Return | Price Projection (base ~$60,000) |
|---|---|---|
| Standard average (all years) | + 7.6% | ≈ $64,500 |
| Post-halving / midterm years | + 10.3% | ≈ $66,100 |
| Bear market fractal 2018/2022 | N/A | $70,000 – $72,500 |
| 2020 rally fractal | N/A | $75,000 |
Historically, July has been a month of repair for Bitcoin (+7.6% average return). However, the unprecedented 2026 macro context — Warsh’s hawkish Fed, massive ETF outflows, and MiCA disruption — demands extreme caution when applying seasonal models. Past performance is not a reliable guide when macro regimes are structurally different.
🎯 Conclusion and Strategic Framework
Bitcoin’s condition at the end of June 2026 represents a deep structural reset under dominant bearish influence. The loss of the 200-week SMA invalidates any near-term bullish recovery thesis, signaling a psychological shift toward capital preservation.
For a bullish repair scenario to gain algorithmic credibility, Bitcoin must decisively reclaim and close above the $61,750–$62,450 confluence zone. Until then, the path of least resistance points down:
- ⚠️ Primary bearish scenario: Break below $58,000 → forced liquidation toward $56,000 → bear flag extension to $55,000
- 📈 Repair scenario: Reclaim of $61,750–$62,450 on strong volume → short squeeze targeting $64,500–$65,000
- 🔄 Seasonal scenario: July bounce ≥ +7.6% → $64,500–$66,100 (contingent on ETF flow stabilization)
The market currently demands a strictly defensive posture: meticulous risk exposure management, preservation of nominal liquidity, and disciplined monitoring of the structural levels identified in this analysis.
⚠️ Disclaimer: This article is published for educational and informational purposes only. It does not constitute investment advice or a recommendation to buy or sell any financial asset. Cryptocurrency markets are highly volatile and carry significant risk of capital loss. Always consult a licensed financial advisor before making any investment decision.