
As June 2026 draws to a close, Bitcoin (BTC/USDT) stands at a critical inflection point. After a correction of more than 20% from its all-time high of $73,777, the asset is navigating a zone of acute technical vulnerability, dangerously oscillating around the psychological threshold of $60,000. This analysis dissects market structure across three timeframes — 15 minutes, 4 hours and daily — integrating order book heatmap reading, global macroeconomic dynamics and the exogenous supply shocks weighing on prices.
🌍 Macroeconomic Context: The Monetary Vice
The macroeconomic environment of 2026 continues to exert powerful gravitational force on all risk assets. The restrictive monetary policy of the US Federal Reserve (Fed) remains the dominant factor: recent PCE (Personal Consumption Expenditures) releases revealed inflation above expectations, pushing back hopes of a swift rate easing cycle.
The FOMC’s Dot Plot now projects only one rate cut for the remainder of the year, with the long-term neutral rate revised upward from 2.75% to 3.00%. This higher for longer stance propels the Dollar Index (DXY) to levels that mechanically reduce the attractiveness of alternative assets like Bitcoin.
In Europe, the ECB raised rates by 25 basis points against a backdrop of pronounced economic contraction. German private sector activity is contracting at its fastest pace since 2024, while the 10-year Bund yield stabilises around 2.86%, maintaining a positive real opportunity cost that penalises yield-free assets like BTC.
| Macroeconomic Indicator | Status — June 2026 | Impact on Bitcoin |
|---|---|---|
| US Inflation (PCE) | Above consensus | 🔴 Bearish |
| Fed Dot Plot | Only 1 cut anticipated | 🔴 Bearish |
| Fed Terminal Rate (LT) | Revised to 3.00% | 🔴 Bearish |
| ECB Rate | +25 basis points | 🟡 Neutral to Bearish |
| German 10Y Bund | ~2.86% | 🟡 Neutral |
📦 Exogenous Supply Shocks: The Double Historical Burden
The German Government Liquidation
Between June and July 2024, German authorities (BKA) liquidated 49,858 BTC seized during the takedown of Movie2k — generating approximately $2.89 billion at an average price of $57,900/BTC. The transparency of the blockchain allowed market participants to track these transfers in real time, triggering lasting sell-side panic. With Bitcoin returning to test $60,000, the gap between the current price and Germany’s average selling price has narrowed to a dangerous 7%.
This episode established a permanent sovereign risk premium: institutional investors now incorporate into their models the risk that other states (US DoJ, UK government) could liquidate seizure-based reserves without notice.
The Ghost of Mt. Gox
The second pillar of excess supply stems from the resolution of the Mt. Gox bankruptcy. Trustee Nobuaki Kobayashi’s announcement of BTC and BCH repayments to approximately 127,000 creditors — involving some 142,000 BTC — crystallised all market anxieties. These creditors, who were wronged when Bitcoin was worth only a few hundred dollars, now hold an asset that has appreciated by thousands of percent — the temptation to take profits is immense.
Combined with post-Halving (April 2024) miner capitulation, this scissors effect has durably capped any attempt at new price discovery.
🗺️ Order Book Heatmap Analysis
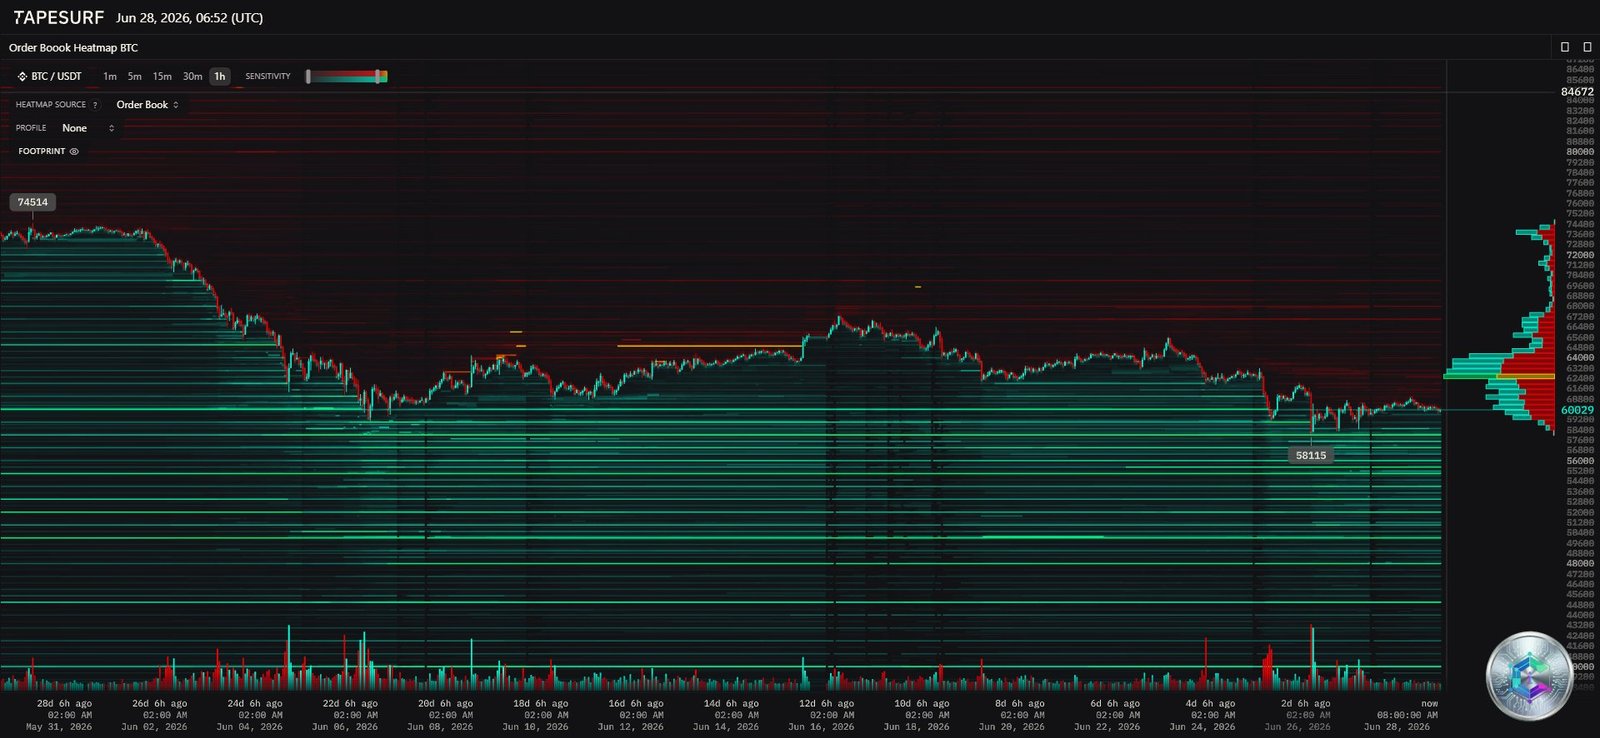
The order book heat map reveals a two-sided liquidity architecture:
- Sell-Side Resistance (Sell Power): Above $60,029, thick strata of limit sell orders (yellow and orange lines) form a glass ceiling. The $74,314 level concentrates massive selling liquidity corresponding to historical highs. Significant resistance bands lie between $63,000 and $67,000.
- Buy-Side Support (Buy Power): Below the current price, a dense mesh of limit buy orders (green lines) extends around $58,115. If market sell pressure exceeds this floor, stop-losses will trigger a liquidation cascade.
- Point of Control (POC): The volume profile shows the POC situated between $60,000 and $62,000 — a precarious equilibrium zone around which price currently gravitates.
📊 Multi-Timeframe Technical Analysis
Daily Chart (1D) — The Macro-Structural View
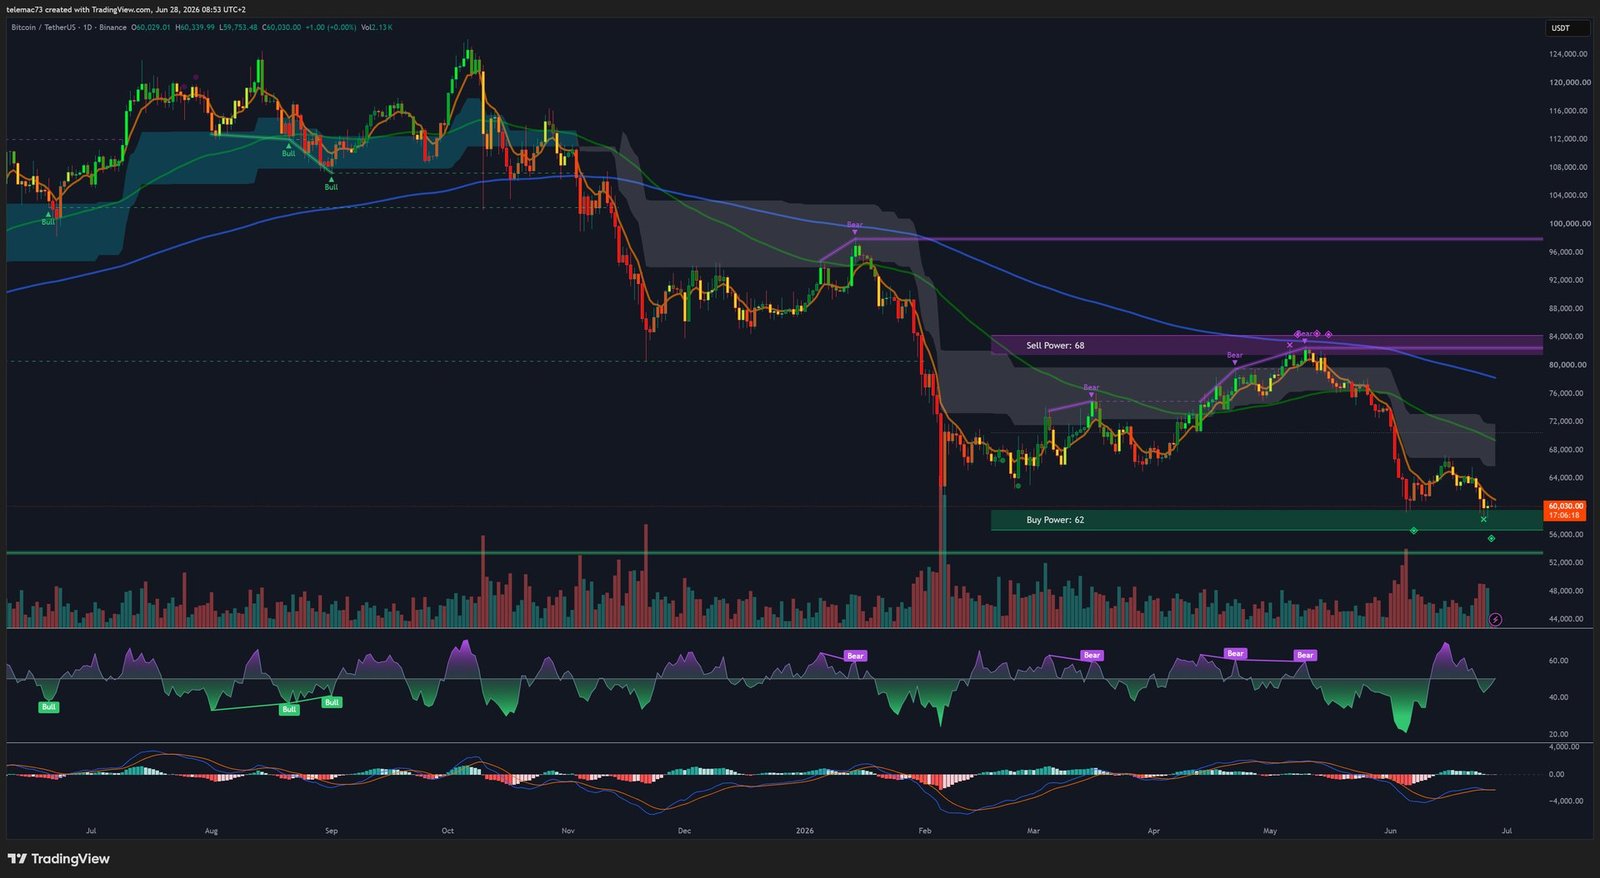
The daily chart reveals a classic institutional distribution structure from the highs, with an uninterrupted sequence of lower highs and lower lows. Key elements:
- Multiple Death Crosses: Faster moving averages have crossed below the slow MA (200), signalling a regime change from bull to bear market.
- Thick Resistance Cloud: The Ichimoku cloud extends broadly above price, confirming extremely strong resistive inertia.
- RSI in Chronic Oversold Territory: The daily RSI flirts with 24–25, indicating extreme exhaustion — but in a structural bear market, it can remain oversold for weeks.
- MACD Below Zero Line: The histogram remains red, confirming sellers’ dominance over the underlying market trend.
| Technical Level | Price (USD) | Significance |
|---|---|---|
| Absolute Resistance (ATH) | $73,777 | Origin point of the current bear market |
| Major Resistance (Pivot) | $67,253 | Bearish trend invalidation level |
| Immediate Resistance | $62,795 | First obstacle to any bounce |
| Critical Pivot (Neckline) | $59,000 | Daily close below = capitulation |
| Major Support | $56,000 | Buy Power Box floor |
| Last Resort Support | $49,577 | Target in a liquidation cascade scenario |
4-Hour Chart (H4) — The Bear Flag Mechanics
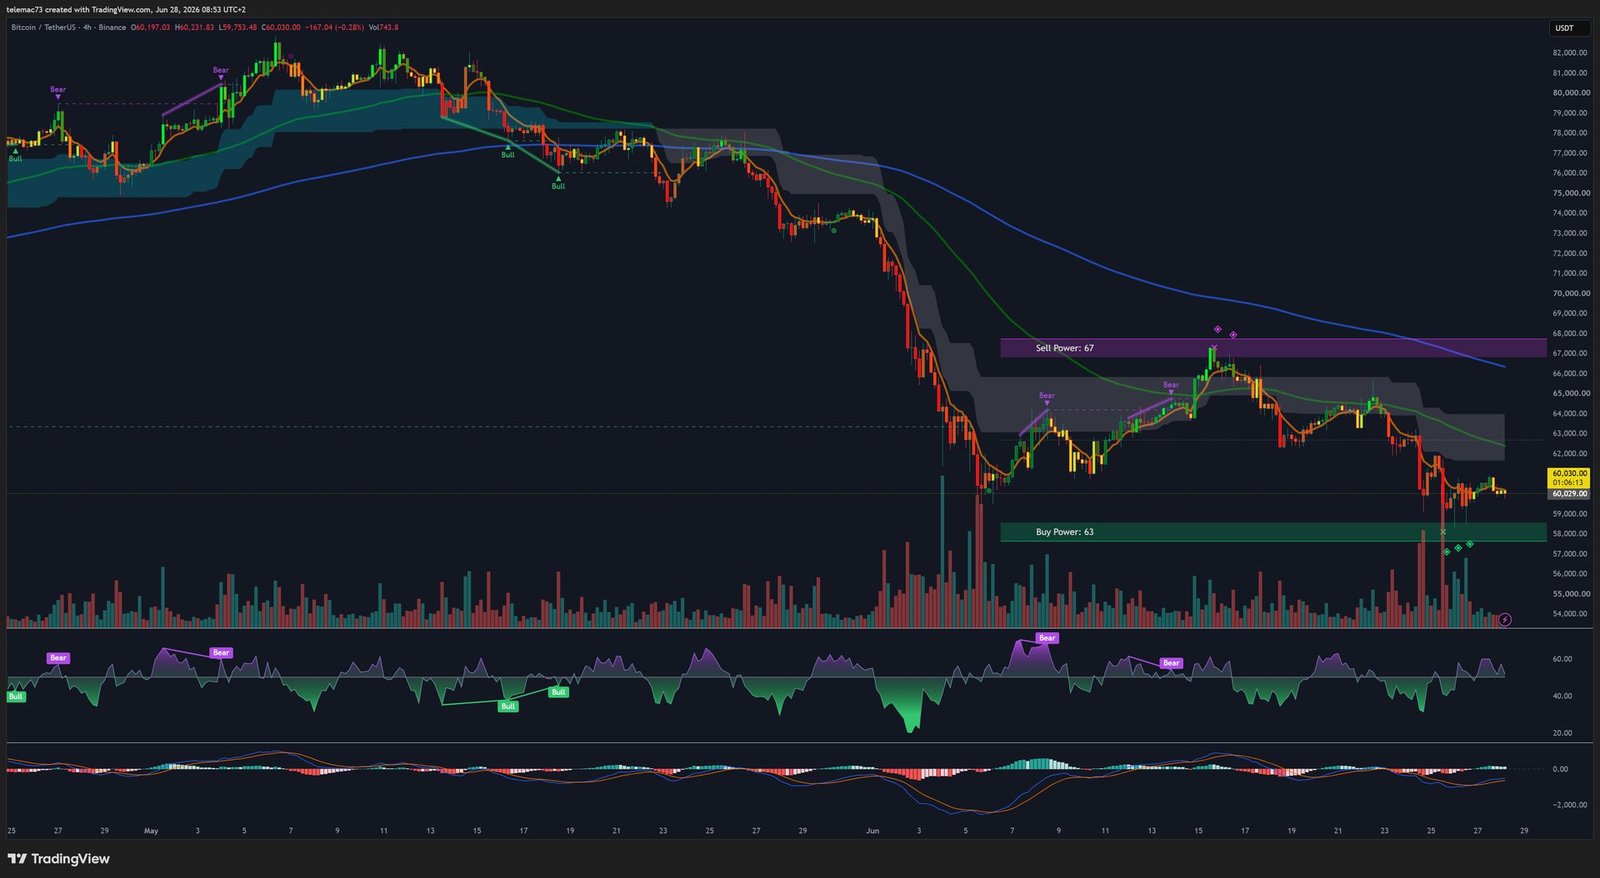
The H4 timeframe perfectly illustrates the descent through successive Bear Flags: a violent bearish impulse (flagpole), a slightly ascending consolidation phase, then a new breakdown. This staircase descent is the hallmark of an institutionally controlled sell-side market.
The H4 RSI displays hidden bearish divergences at local highs (« Bear » markers), proving that bounces lack genuine strength. The MACD oscillates near the zero line without clear directionality — a clean « Golden Cross » with expanding green histogram bars would be required to target a return toward the $66,000–$67,000 range.
15-Minute Chart (M15) — Intraday Volatility
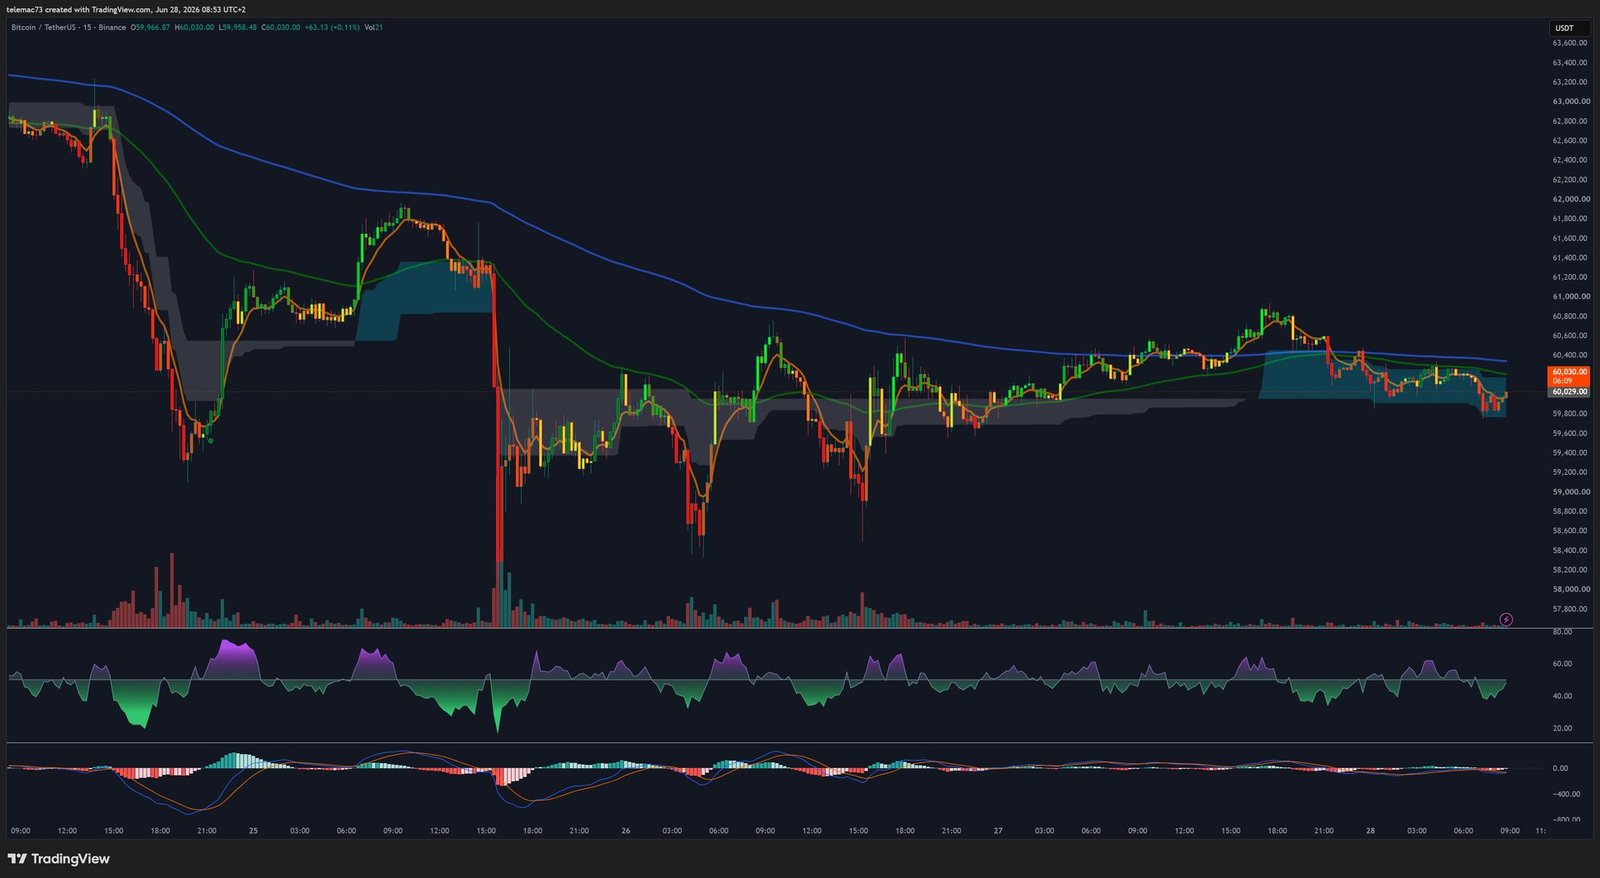
The M15 reveals the impact of a near-vertical flash capitulation candle (Waterfall Drop), triggered by the above-consensus PCE data release, accompanied by an explosion in volume. This single event contributed to the liquidation of $1.48 billion across the broader crypto market.
Price has since entered a lateral convalescence phase around $60,030, forming small asymmetric compression triangles. The absence of a reversal pattern (Double Bottom or V-Shape Recovery) suggests this consolidation is merely a pause before a potential bearish continuation.
🔗 Cross-Asset Correlations & Sentiment Indicators
Stablecoin Dominance: The key sentiment indicator has broken above the technical resistance at 12.506% to exceed the psychological threshold of 13% — a third consecutive breakout. This signal confirms massive sector rotation into « digital dollars », with major operators refusing to catch the falling knife and positioning to buy at structurally lower levels.
Ethereum Contagion Risk: ETH is brushing its critical level of $1,505. A daily close below $1,500 would trigger a long liquidation cascade targeting $1,385. Such an implosion would mechanically dislodge Bitcoin from its $59,000 support, with algorithms simultaneously reducing exposure across the entire crypto complex.
🎯 Probabilistic Scenario Modelling
Scenario 1 — Bearish Cascade & Capitulation 🔴 (Probability: High)
Trigger: A clean daily close below $59,000, or more aggressively below the intraday low of $58,115. Breaking this level would collapse the buy walls visible on the Heatmap, trigger stop-losses in cascade, and activate Trend-Following algorithms in short mode.
Targets: Temporary support at $56,000 → 100% Fibonacci extension at $52,204 → Structural final target at the August low of $49,577 (potential generational accumulation zone).
Scenario 2 — Technical Short Squeeze 🟡 (Probability: Medium)
Trigger: Tenacious defence of the $58,000–$59,000 zone forming a « W » pattern on H4, with validation of a bullish divergence on H4 MACD crossing above the zero line.
Targets: Squeeze through $61,500 → attack on $62,795 → major « Sell Power Box » resistance between $66,000 and $67,253. Without a Fed pivot, this bounce would remain an institutional Dead Cat Bounce, offering an optimal short re-entry point.
Scenario 3 — Bearish Invalidation & Bullish Resumption 🟢 (Probability: Low)
Trigger: An exogenous macroeconomic miracle (emergency QE announcement, PCE collapsing below 2% forcing a dramatic Fed pivot) + weekly close above $67,253.
Targets: Sweeping liquidity at $74,314 → Price Discovery beyond the ATH of $73,777. This scenario requires the simultaneous re-injection of billions in pending stablecoins (dominance > 13%) back into the ecosystem.
📝 Conclusion
Bitcoin in June 2026 is an asset besieged on all fronts: restrictive macro, historic supply shocks, fragile technical structure, and a market in full risk-off mode. The battle unfolding at the $59,000 trench is not mere market noise — it is the tipping point of a major cyclical dynamic. Its outcome will determine whether Bitcoin consolidates healthily ahead of its next expansion phase, or embarks on a prolonged volatility winter.
The savvy investor adopts a resolutely defensive posture in this context, managing scenarios rather than making binary predictions, and rigorously respecting their risk parameters.
⚠️ Disclaimer: This article is written for educational and informational purposes only. It does not constitute investment advice, nor a recommendation to buy or sell digital assets or any other financial instrument. Cryptocurrency markets are extremely volatile and past performance is not indicative of future results. Please consult a licensed financial advisor before making any investment decision. Investing involves risk of capital loss.