
Bitcoin (BTC) is navigating through a period of rare structural complexity in June 2026. After nearly touching $126,287 at the end of 2025, the market has been mired in a critical consolidation zone between $62,000 and $64,000 — a contraction exceeding 36.6% year-over-year. This correction is far from trivial: it is the expression of an unprecedented confluence of macroeconomic headwinds, massive institutional capital reallocation, and contradictory technical signals across multiple timeframes.

1. Macroeconomic Architecture and Geopolitical Rebalancing
The macroeconomic environment of 2026 has undergone a radical transformation. The arrival of Kevin Warsh as Fed Chair in May 2026 shattered expectations of monetary easing. The June 2026 FOMC meeting delivered a genuine shock: while the federal funds rate was held in the 3.50%–3.75% range for the fourth consecutive meeting, the violent revision of the « dot plot » drove the median year-end projection from 3.4% to 3.8%, wiping out any hope of rate cuts in 2026.
Even more alarming: nine of the eighteen FOMC members now anticipate at least one additional rate hike before December 2026, citing stubborn inflation oscillating between 3.8% and 4.2%. This decisively hawkish pivot instantly destroyed approximately $2 trillion in market capitalization across equities, precious metals, and cryptocurrencies. Bitcoin immediately fell 2%–4%, sliding from the $66,000 zone toward $63,850.
On the geopolitical front, the signing of a formal US-Iran peace agreement in Switzerland on June 19, 2026 — halting military operations and reopening the Strait of Hormuz — should theoretically have triggered a major relief rally. Yet Bitcoin’s reaction was singularly apathetic. Capital freed by the easing of geopolitical tensions did not flow into crypto; instead, it was massively absorbed by artificial intelligence stocks, the undisputed new growth vector of the decade.
2. Institutional Dynamics, ETF Flows, and On-Chain Resilience
June 2026 reveals a gaping fracture between the behavior of institutional capital and that of native blockchain participants.
On the institutional side, the diagnosis is unambiguous: spot Bitcoin ETFs — the engines of the late-2025 euphoria — suffered a historic hemorrhage, recording net outflows totaling $8 billion in June alone, with a single-day outflow of $90.66M on June 18th. The stronger dollar and tighter monetary policy are forcing portfolio managers to liquidate positions in the most volatile assets.
However, on-chain data tells a completely different story:
| Key Metric (June 2026) | Observation | Market Implication |
|---|---|---|
| Spot Bitcoin ETF Flows | Net outflows of $8B | Severe institutional selling pressure; capital rotating to AI and money markets. |
| OG Selling Activity (> 5 years) | Lowest level since 2024 | Strong conviction among long-term holders; silent absorption of supply. |
| BTC Balances on Exchanges | Lowest level since 2019 | Migration to cold storage; latent supply shock reducing available sell-side liquidity. |
| Google Search Volume (retail) | Rebound from May 2026 lows | Gradual return of retail interest; potential stabilization signal. |
Long-Term Holders (LTH) are aggressively hoarding — withdrawing BTC to cold wallets and driving exchange reserves to levels last seen during the 2019 bear market. This structural supply shock means that any sudden resurgence in institutional demand would collide with a structurally drained order book, creating conditions for a potentially parabolic price appreciation.
3. Market Microstructure: Liquidity Mapping (Order Book Heatmap)
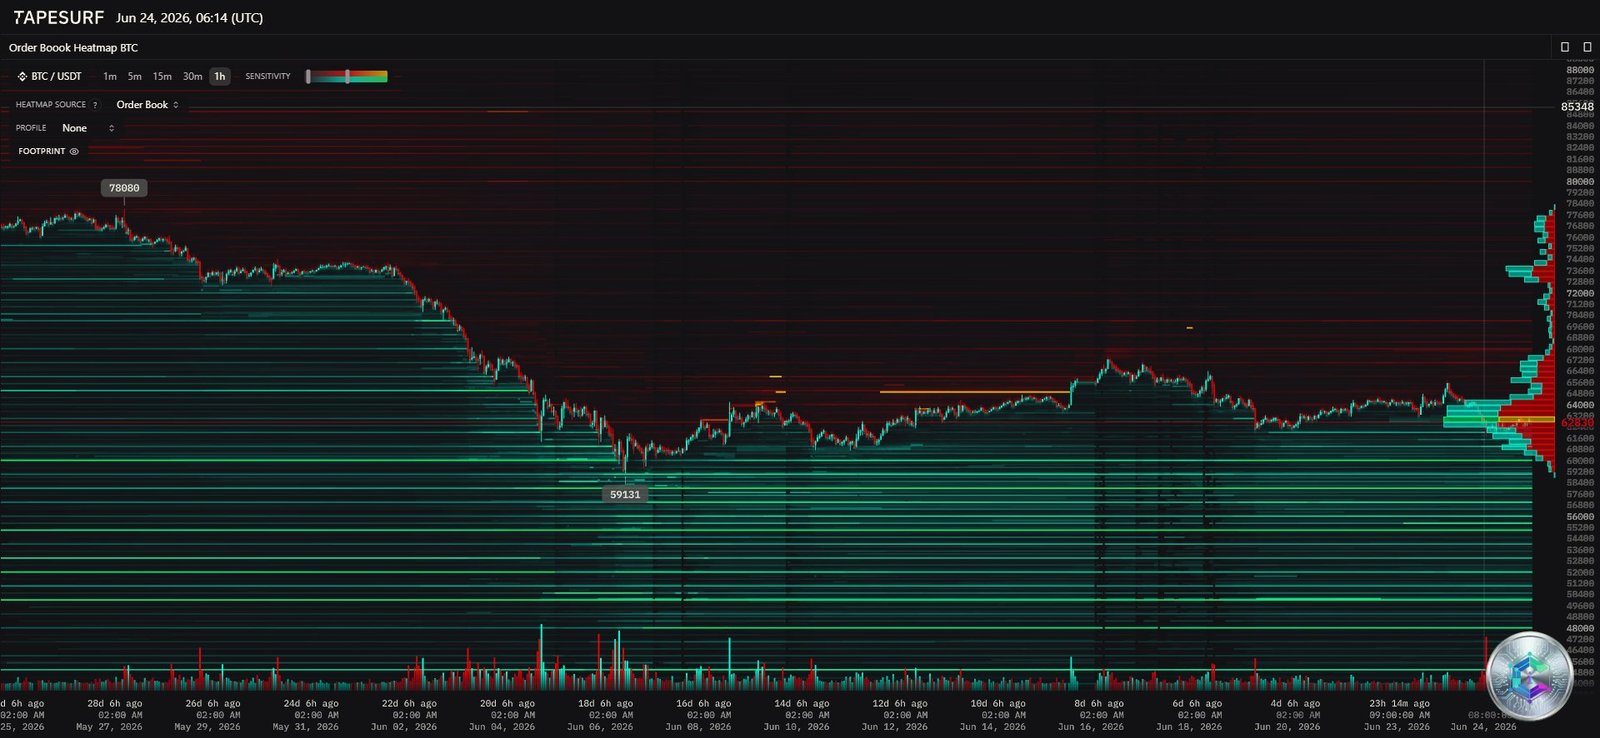
The order book heatmap provides a three-dimensional view (price, time, depth) of supply and demand in real time. The microstructural landscape is highly polarized:
Supply side (resistance): Dense horizontal red bands signal deep sell walls starting at $64,000, intensifying significantly toward $68,000–$70,000. The « 78,000 » label visible in the historical heatmap marks a former local peak where massive supply was executed — a resistance level whose algorithmic memory persists.
Demand side (support): An extremely bright and dense green band stretches across the $60,000–$62,000 zone, constituting a major defensive buy wall. This concentration of passive limit orders indicates that significant institutional players — likely quantitative funds or large accumulators — are building positions aggressively at these levels. The extreme wick at $59,131 marks the battle-test of this fortress.
Worth noting: a new derivatives asymmetry has formed, with the opening of aggressive short positions ($6.68M in USDC at 20x leverage by a single entity). Their liquidation levels sit just above $65,000–$66,000. A bounce from the $60k zone would trigger a potentially violent short squeeze.
4. Macro Charting: Daily (1D) Timeframe Analysis
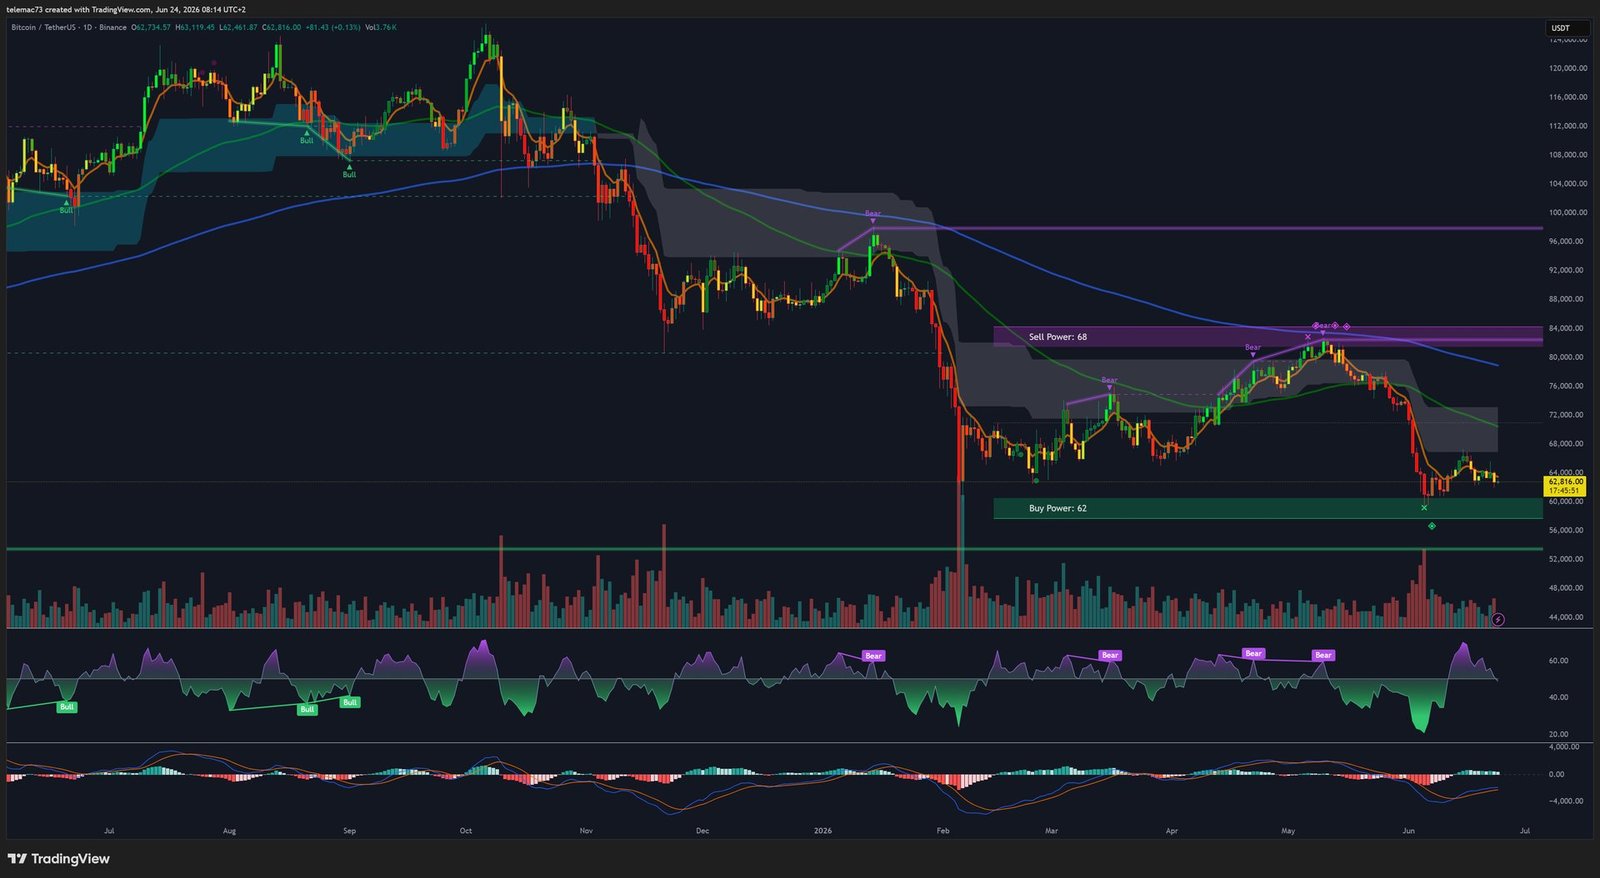
The daily timeframe is the ultimate arbiter of the underlying trend. The verdict is unambiguous: Bitcoin has been locked inside a broad descending channel governing the market since February 2026, characterized by systematically lower highs and lower lows. The primary directional bias is unequivocally bearish.
The long-term moving average picture worsens the outlook: the 50-day SMA sits at approximately $72,450–$72,872, while the 200-day SMA looms above at $76,911–$84,744. With price hovering around $62,816, the market is crushed beneath these levels. The convergence of the 50-day toward the 200-day raises the specter of the dreaded « Death Cross » — an algorithmic signal that forces most trend-following quant funds to liquidate remaining long exposure.
| Technical Level (Daily) | Value | Strategic Role |
|---|---|---|
| Resistance — 200-day SMA | ~$76,911–$84,744 | Absolute bull/bear market boundary. Slope now descending. |
| Resistance — Fibonacci 0.618 | ~$74,470 | Historical rejection in May 2026. Impenetrable wall near-term. |
| Pivot Zone — No-Man’s-Land | $68,100–$74,470 | Total indecision; frequent liquidity traps. |
| Major Defensive Support | $60,000–$62,000 | Buy wall fortress (heatmap). Critical level to monitor. |
| Last-Resort Support | $51,000–$54,300 | Cyclical floor. A break here invalidates all bullish cycle scenarios. |
A glimmer of hope: the oscillator (14-day RSI at 27.42) is displaying historically deep oversold readings and is beginning to diverge positively from price. The daily MACD, while deep in negative territory, shows a contracting histogram (shorter red bars). A bullish MACD crossover from extreme oversold territory is often the precursor to a significant technical bounce.
5. Intermediate Analysis: 4-Hour (4H) Chart
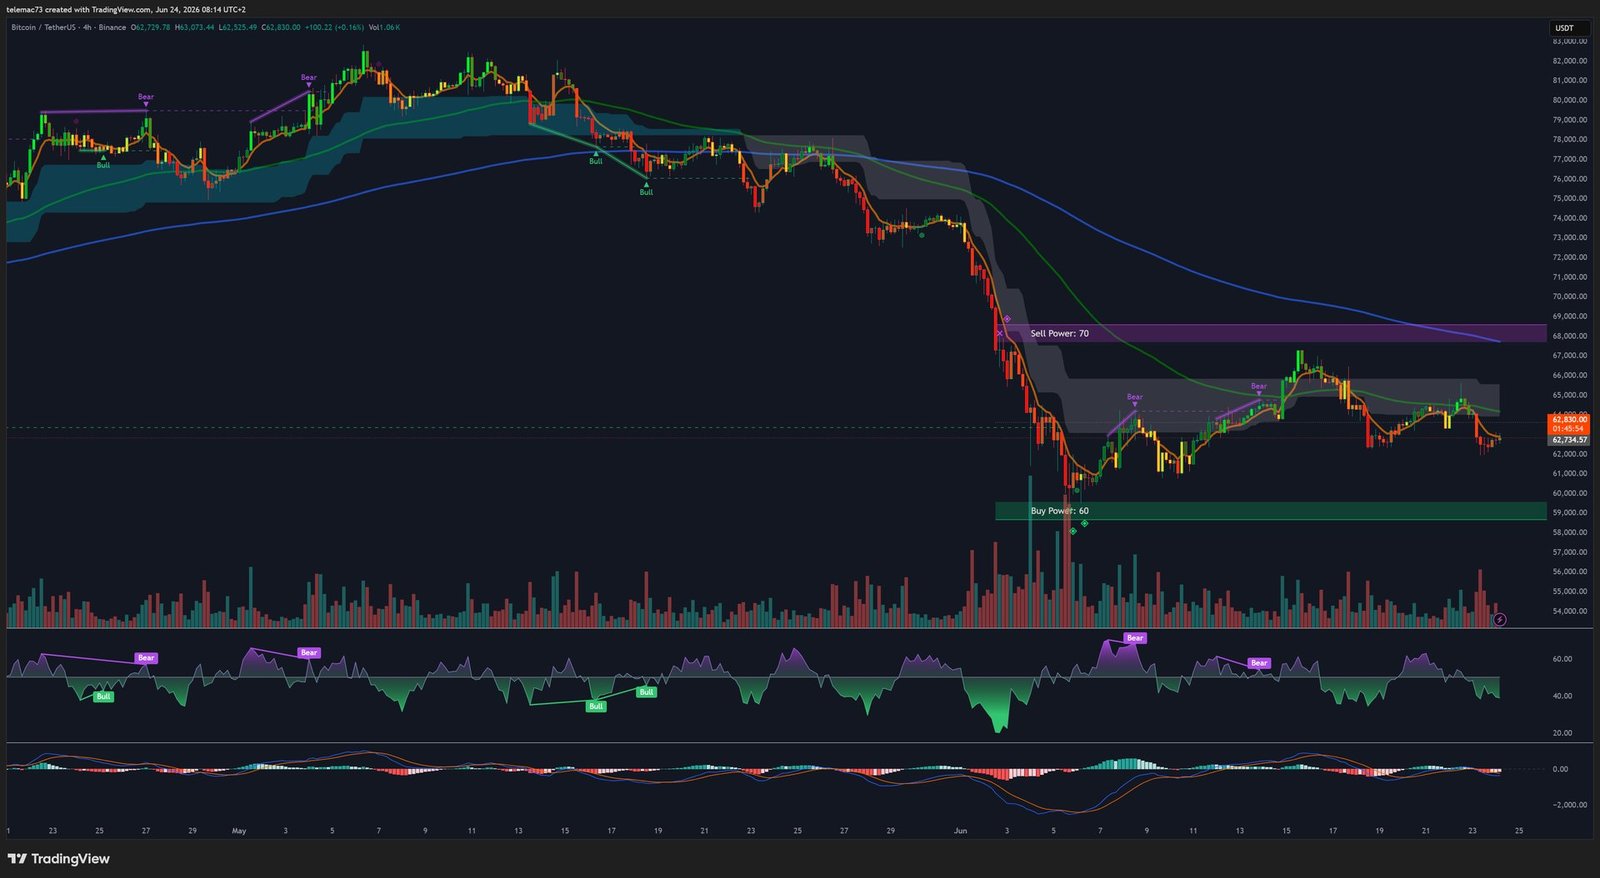
On the 4H timeframe, Bitcoin (at $62,734) is fighting an attritional battle between two magnetic poles. Following the cascade of massive red candles that materialized the Fed’s hawkish impact, price entered a state of lethargy characterized by compressed volatility and very narrow-bodied candles.
Two opposing chart interpretations are at play:
- Bear Flag (bearish): The slightly ascending consolidation following the vertical plunge forms the « body » of the flag. If the lower support breaks, the theoretical measured move projects BTC toward $58,000 — aligned with Kalshi prediction market estimates.
- Symmetrical Triangle (explosive): Bollinger Bands are dramatically squeezing. This extreme volatility compression invariably precedes a major directional expansion. The direction of the breakout will dictate the trend for the coming weeks.
Indicators confirm the standoff: the « Sell Power: 70 » zone guards $67,000–$68,000, while the « Buy Power: 60 » tag anchors support at $59,000–$60,000. The 4H MACD is generating constant false signals in both directions (whipsaw). The sole mildly positive signal: the 50-day SMA on this timeframe is beginning to gently slope upward, suggesting a test of $65,000 remains a near-term technical possibility.
6. Intraday Microstructure: 15-Minute (15M) Chart
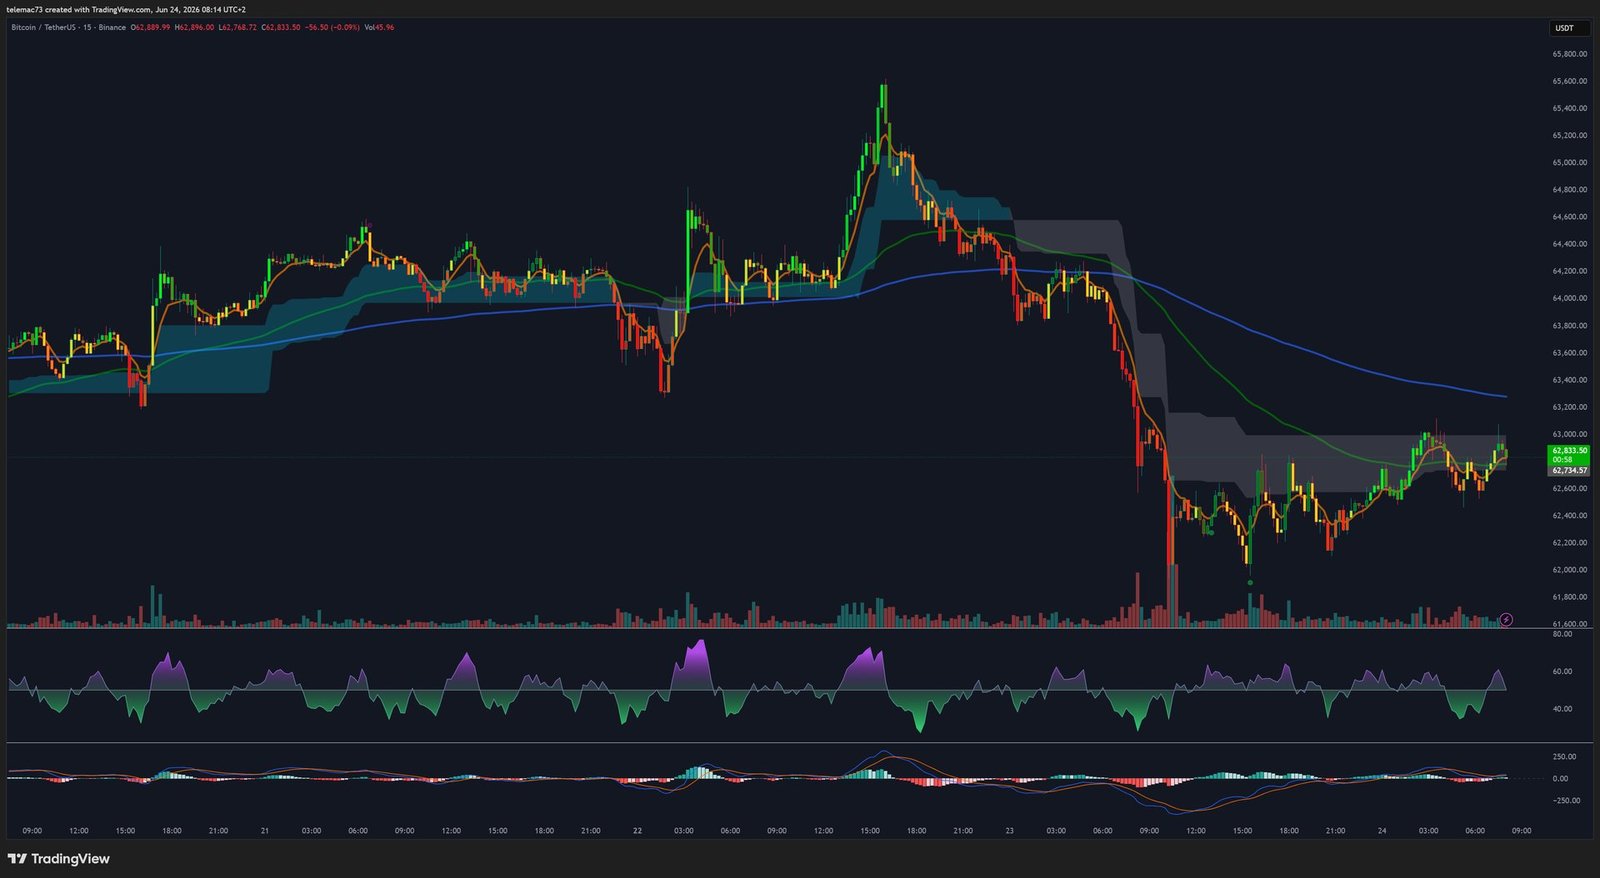
At the 15-minute level, macroeconomic considerations give way to high-frequency algorithmic warfare. The chart reveals a classic liquidity grab sequence: a sudden parabolic upward impulse (a stop-run above local highs) immediately followed by a cataclysmic inverted-V collapse. This pattern is the signature of smart money using retail stop-loss orders as execution liquidity for large sell orders, without creating slippage.
Following this maneuver, price enters a tight bearish consolidation channel dominated by mean-reversion algorithms that systematically buy rapid dips and short every aggressive upward extension, keeping price trapped in its box. On this timeframe, only the static liquidity zones from the heatmap provide a reliable compass for execution decisions.
7. Predictive Models and Probability Markets
Prediction markets express deep structural pessimism. On Kalshi, participants assign a 57% probability that BTC will break below $50,000 before the end of 2026. The probability of reaching $100,000 before January 2027 has collapsed from 94% at the start of the year to just 34% in June.
| Model / Platform | Analysis Type | Projected Target | Timeframe |
|---|---|---|---|
| Kalshi | Crowd probability | $58,000 (minor support) | June 2026 |
| Kalshi | Directional prob. (57%) | < $50,000 (capitulation) | End 2026 |
| Binance (algo) | Internal smoothed model | ~$62,751 (consolidation) | July 2026 |
| CoinCodex (AI) | Multi-factor + halving | $64,963–$92,500 | H2 2026 |
In contrast, CoinCodex’s quantitative model maintains a projection within a corridor of $64,963–$92,500 for H2 2026, positing that a Fed pivot — forced by economic slowdown — would reactivate demand for scarce assets.
Strategic Conclusion
The meticulous examination of the Bitcoin market in late June 2026 reveals a complex equation where macroeconomic forces of destruction collide with underlying structural resilience. On one side, the Fed’s 3.8% rate trajectory and the cataclysmic $8B ETF outflows have irremediably broken the backbone of the macro uptrend. The daily descending channel, the Fibonacci walls, and the looming Death Cross leave no room for complacency.
On the other side, the heatmap reveals a massive defensive fortress between $60,000 and $62,000, underpinned by the silent accumulation of OG holders and a historically low exchange supply. Bitcoin is currently trapped in a seismic compression triangle — squeezed between a concrete wall below and an electrified glass ceiling above.
Momentum oscillators, at historically oversold levels on the daily chart, are screaming for an imminent elastic relief rally. Yet any further deterioration in sentiment could trigger a liquidation cascade toward $58,000 or even $50,000. Conversely, if the $60,000 fortress proves its structural robustness, the current compression will transform into the ideal foundation for a laborious structural recovery — first targeting the no-man’s-land of $68,000, before any possibility of a macroscopic redemption. The next exogenous catalyst will be decisive.
⚠️ Disclaimer: This article is written for purely educational and informational purposes. It does not constitute investment advice or a recommendation to buy or sell any digital assets. Cryptocurrency markets are extremely volatile and carry significant risk of capital loss. Always conduct your own research (DYOR) and consult a qualified financial advisor before making any investment decisions.