
Bitcoin is navigating a zone of exceptional structural turbulence in June 2026. At the crossroads of an unprecedented U.S. monetary policy tightening, a historic hemorrhage of institutional ETF flows, and a technically strained microstructure, the leading digital asset is seeking equilibrium within a tight consolidation corridor between $62,300 and $64,750. This multi-timeframe analysis deciphers the competing forces at play and models execution scenarios for the weeks ahead.
1. Macroeconomic Paradigm: The Global Liquidity Contraction
The behavior of risk assets is intrinsically tied to the cost of capital. In June 2026, the macroeconomic environment is dominated by a resurgence of inflationary fears and a significant tightening of U.S. monetary policy — two structurally negative forces for Bitcoin in the short term.
1.1. The Warsh Era at the Fed: A Decisive Hawkish Pivot
The June 16–17 FOMC meeting marked a decisive turning point. Under the impetus of the Fed’s new chairman, Mr. Warsh, institutional communication underwent an extremely restrictive rhetorical pivot. The Warsh doctrine is almost exclusively focused on eradicating inflation: during the post-FOMC press conference, the word « inflation » was spoken 19 times, compared to only 4 mentions of the labor market.
This stance sends a clear signal to financial markets: the Fed will tolerate demand destruction and economic slowdown if necessary to bring inflation back to its 2% target. Interest rates are held between 3.50% and 3.75%, imposing a punitive opportunity cost on holding non-yield-generating assets like Bitcoin.
1.2. Revised Economic Projections (SEP)
The Summary of Economic Projections published alongside the rate decision illustrate a deteriorating inflation outlook. Core PCE inflation underwent a drastic upward revision: the median projection for 2026 jumped from 2.7% (March) to 3.3% (June). Meanwhile, real GDP growth in Q1 2026 collapsed to 1.6%, well below the 2.0% long-term trend.
This combination of sluggish growth and persistent inflation — a mild stagflation — is putting immediate upward pressure on U.S. Treasury yields, mechanically strengthening the dollar (DXY) and draining liquidity from crypto assets.
2. Institutional Flow Dynamics: The Historic ETF Bloodbath
Bitcoin’s market structure has been irrevocably altered by spot ETFs. In June 2026, these vehicles are the primary driver of price action — and they are dictating an unprecedented distribution phase.
2.1. -$6.35 Billion: The Worst ETF Outflow Cycle in History
According to Galaxy Research data, U.S. spot Bitcoin ETFs recorded their largest net outflow over 30 consecutive days since their launch: $6.35 billion exited these products, marking the worst withdrawal cycle across all 582 rolling 30-day observation windows analyzed. This flight extended over six consecutive weeks, peaking with $1.72 billion in net redemptions in a single week (June 6th).
However, a granular analysis reveals an important asymmetry: the majority of this hemorrhage stems from the Grayscale Bitcoin Trust (GBTC) and its prohibitive fees (1.5%), while BlackRock’s IBIT (0.25% fees) maintains cumulative inflows of over $62.1 billion since launch. By late June, the pace of outflows had dropped by 87%, falling from $1.72B to $226M weekly — signaling that the most aggressive de-risking phase is likely complete.
2.2. Franklin Templeton’s DRIP Innovation: A Permanent Passive Buyer
Amid this bearish dynamic, a major structural innovation is taking shape. On June 19, 2026, Franklin Templeton filed with the SEC for two groundbreaking ETFs based on a Dividend Reinvestment Plan (DRIP) mechanism: instead of reinvesting U.S. equity dividends back into stocks, these funds will mechanically redirect those cash flows toward Bitcoin purchases.
With an initial Bitcoin weighting of 5% (capped at 20%) and quarterly rebalancing, this mechanism creates a passive, permanent, and price-agnostic buyer. A potential effective date as early as September 1, 2026, makes it a structural Q4 catalyst.
3. Daily Technical Analysis (1D): Death Cross and Critical Battle Zone
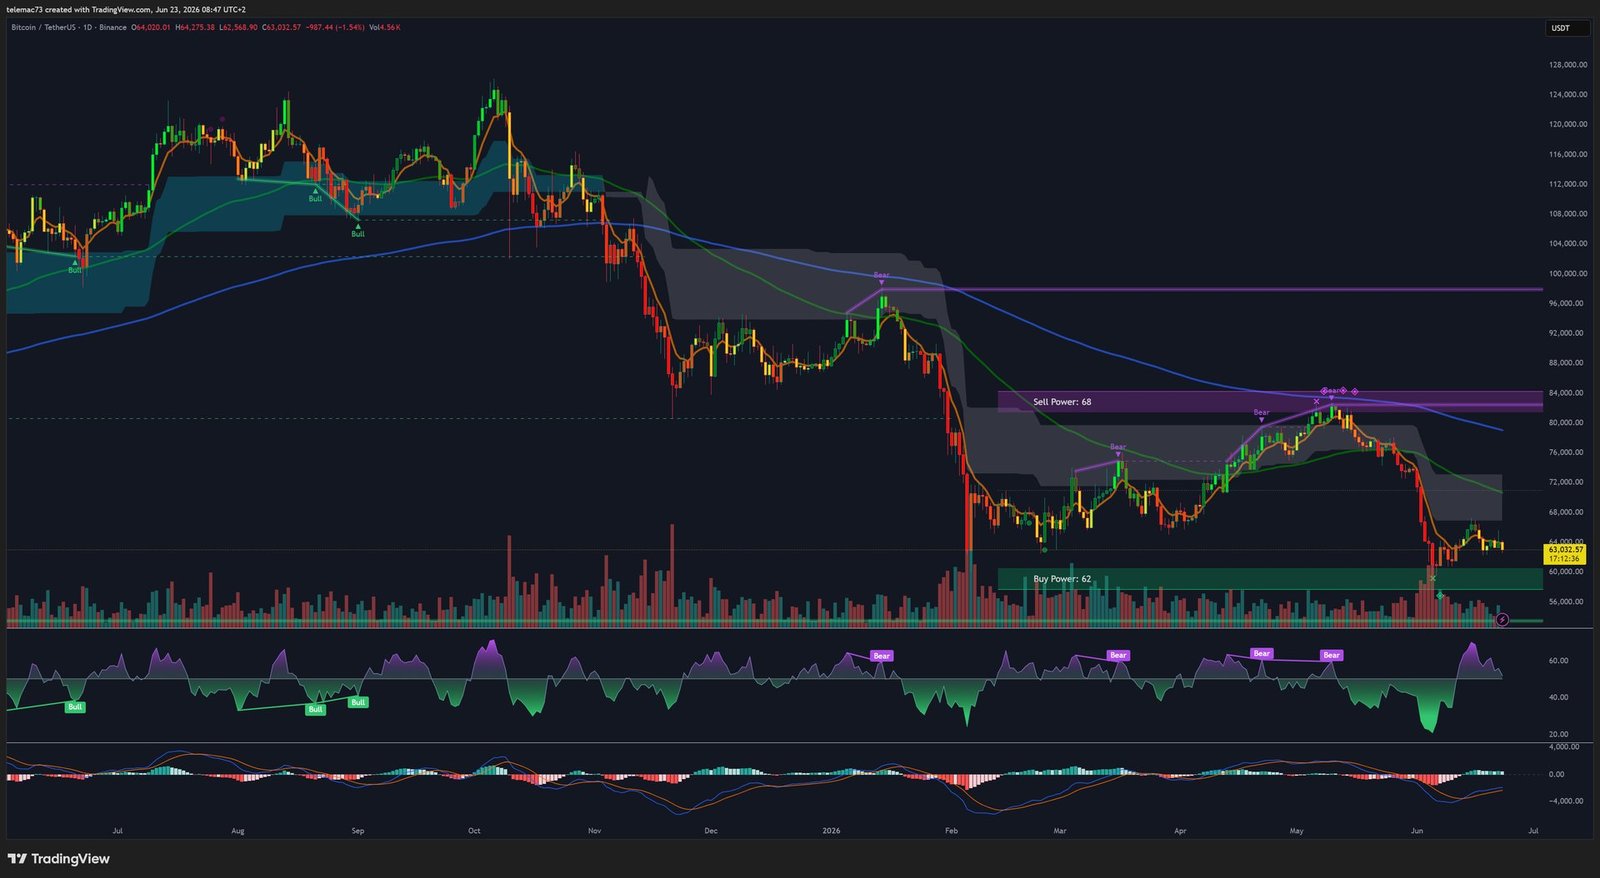
3.1. Post-ATH Distribution and Structural Support Breakdown
The daily chart reveals a broad distribution phase that followed the all-time highs above $73,000. The breakdown of the critical neckline around $72,000–$74,000 validated a Change of Character (ChoCh), transforming the macro-bullish trend into a corrective market. Price action then collapsed, finding provisional support in the « Buy Power » zone around $61,000–$62,000.
3.2. The Death Cross: Formal Confirmation of Seller Control
Examination of daily moving averages reveals severe warning signals. Bitcoin is trading below its 50-SMA and 100-SMA. More alarmingly, since June 17, 2026, the 200-SMA has been turning downward — and the 50-SMA has just crossed below the 200-SMA, formalizing a Death Cross. This feared technical signal validates seller dominance for multiple months ahead.
The volume profile confirms this reading: red candles print on heavy volume while bullish rebounds display anemic volume — characteristic of dead cat bounces rather than institutional accumulation. The annotated « Sell Power: 68 » and « Buy Power: 62 » zones frame this battlefield. A loss of $61,000 on a daily close would expose the market to a collapse toward $58,000, or even $50,000.
4. 4-Hour Technical Analysis (4H): The Compressed Spring
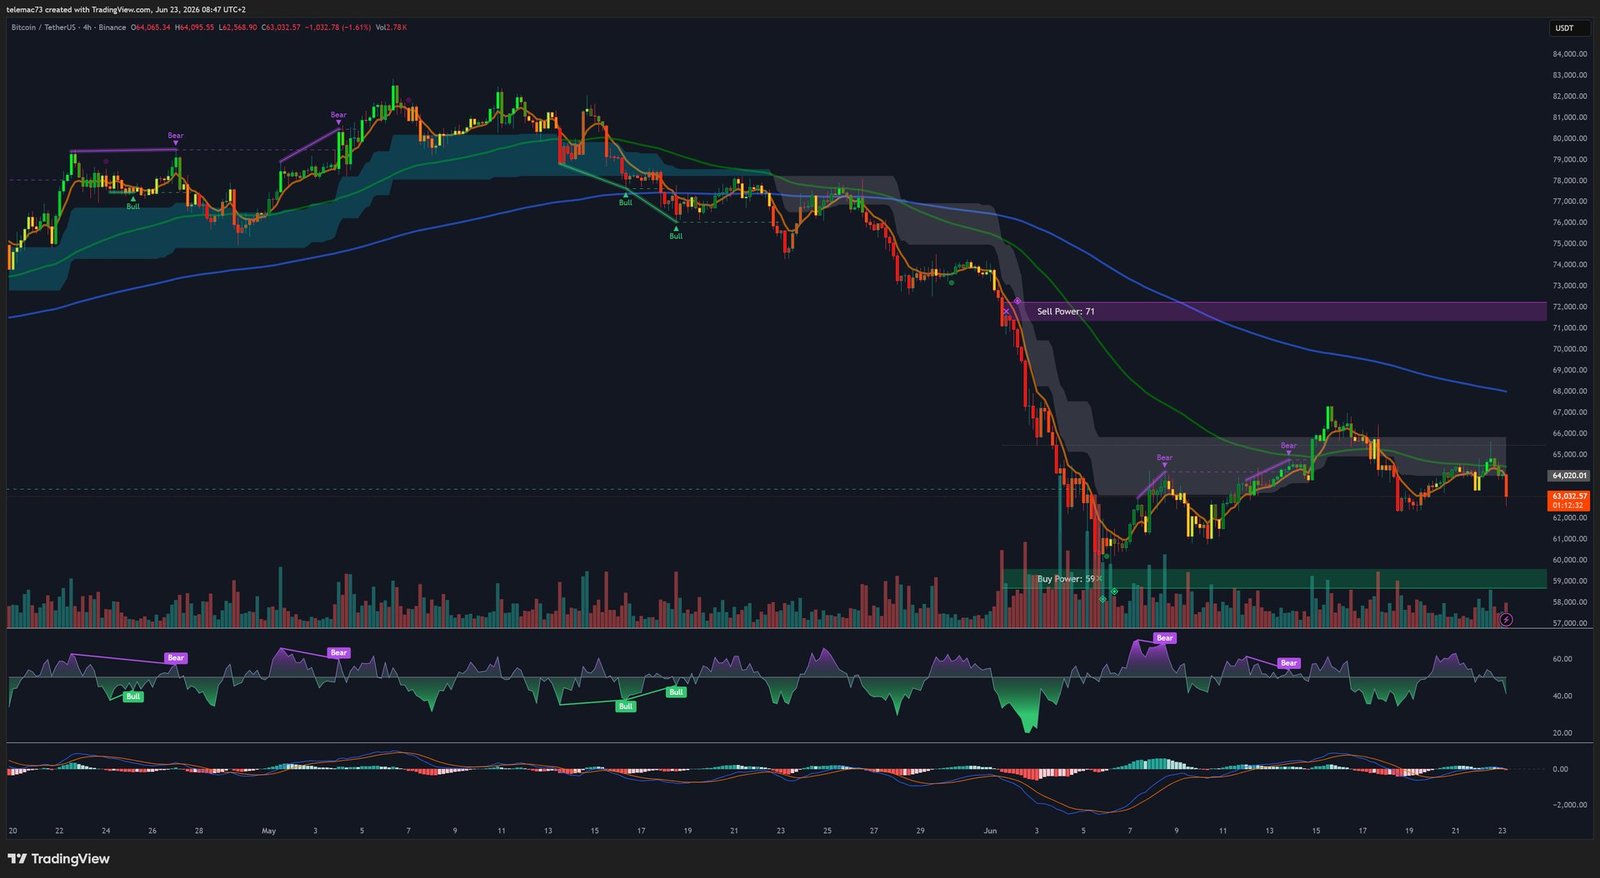
4.1. Cascading Bear Flags: A Repetitive Distribution Mechanic
The 4H chart analysis is unequivocal. The descent from $71,000 has been structured around repeated Bear Flags: each post-impulse lateral consolidation has been violently broken to the downside. This mechanic — bearish impulse → lateral correction → new impulse — demonstrates that every bounce serves as an opportunity for massive liquidity to offload at better prices.
4.2. The Consolidation Rectangle: Compressed ATR, Imminent Explosion
Currently, price is evolving in a very tight consolidation rectangle: support floor at $62,300 / resistance ceiling at $64,750. The ATR has been compressed to approximately $700, indicating extreme volatility compression — the prelude to a violent expansion. The $62,800–$64,700 zone is a « No-Trade Zone » for directional traders.
The resistance is reinforced by the convergence of the SuperTrend and the Ichimoku Cloud (Kumo) around $65,000–$65,400, forming an impassable block under current liquidity conditions. The 4H RSI sits at 50.74 — absolute neutrality — while the MACD remains deeply below zero despite beginning to compress its histogram.
5. 15-Minute Technical Analysis (15m): Panic and Mechanical Bounce
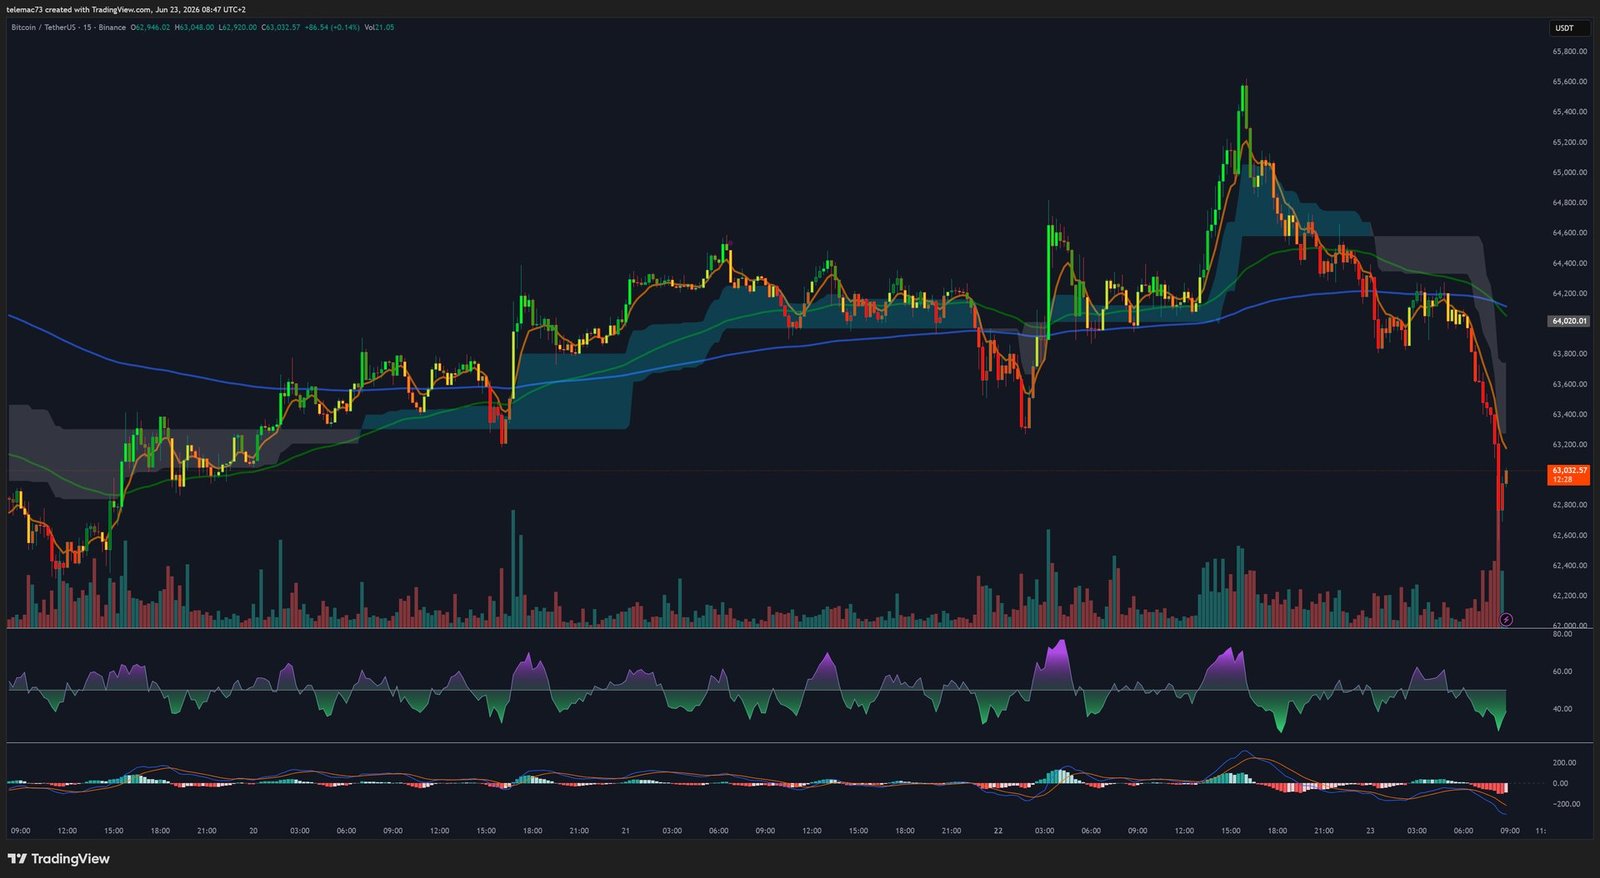
The 15-minute chart captures the violence of the recent rejection. A bullish advance above the moving averages was brutally annihilated by a series of bearish marubozu candles, driving price back to $63,032. The RSI plunged vertically into extreme oversold territory — a panic selling signal that typically leads to a technical bounce via mean reversion. The MACD displays a bright-red histogram, reflecting a phenomenal acceleration of bearish momentum in the short term.
6. Liquidation Heatmap: Mapping the Minefield
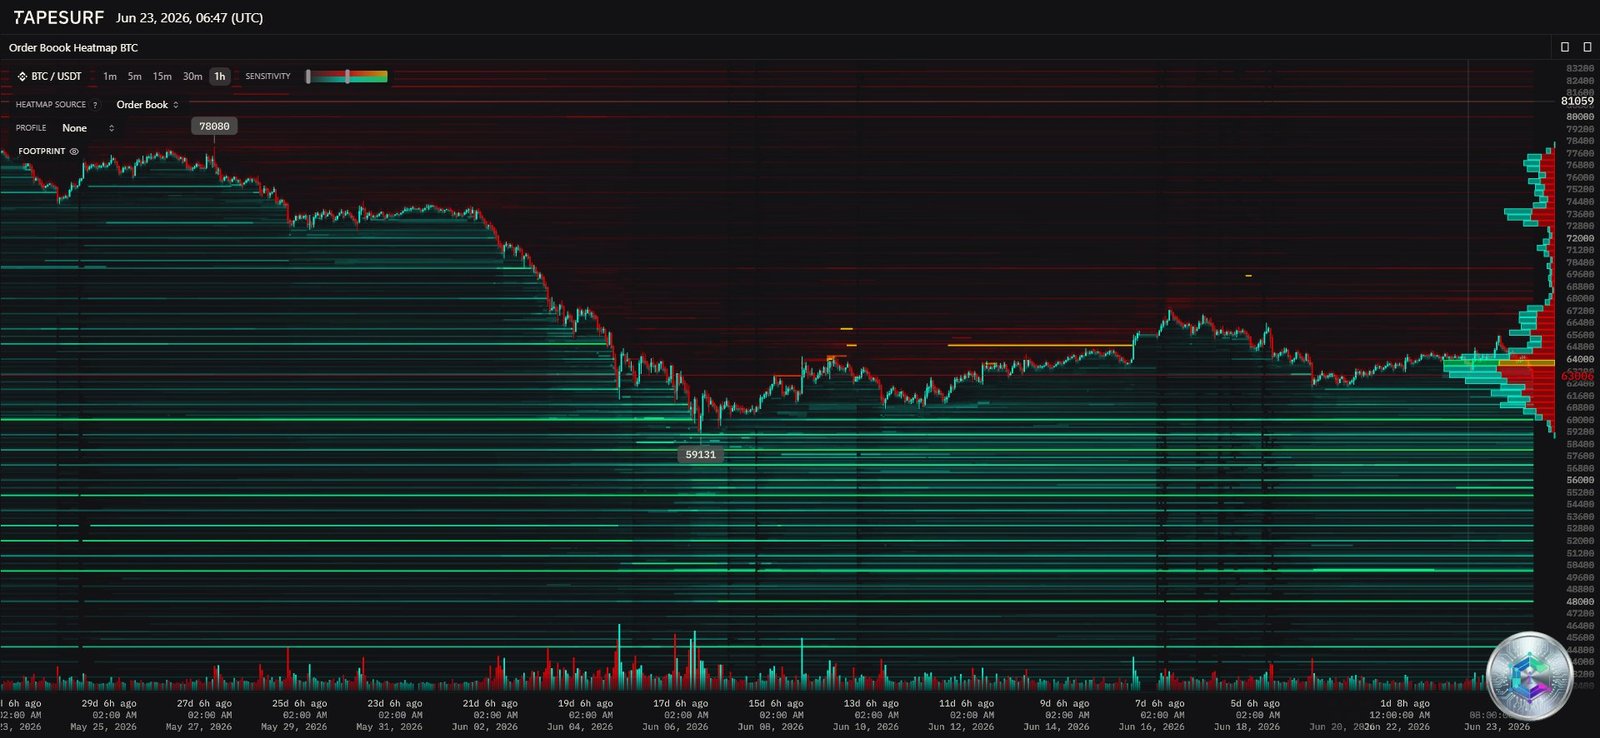
The order book heatmap reveals an extremely asymmetric market structure. On June 4, 2026, Bitcoin plunged toward $61,300, triggering $1.73 billion in liquidations across 291,000 traders (85% long positions).
- Sell Wall (Asks): Massive concentration of limit sell orders between $64,000 and $65,000, acting as an oppressive ceiling systematically repelling every bullish attempt.
- Liquidity Support (Bids): Stratified layers of buy orders extending down to $59,131, constituting an algorithmic last-resort cushion.
- Upper Short Clusters: Dense luminescent pockets of potential liquidations are concentrated at $68,300, $69,000, $70,000, and $72,000. A breach of the $65,000 sell wall would trigger a violent Short Squeeze toward these magnetic levels.
7. On-Chain Fundamentals and Derivatives Microstructure
7.1. The Illusion of Network Activity
Bitcoin’s transaction volume has surpassed 800,000 daily transfers — a level comparable to late 2024. However, a qualitative analysis (CryptoQuant) reveals that cohorts transferring less than 0.01 BTC represent nearly 80% of activity, up from 44% in 2023. This explosion is almost exclusively driven by ancillary protocols (Ordinals, Runes, BRC-20), not institutional accumulation. On-chain activity is thriving, but its economic content is thin.
7.2. Derivatives Microstructure: Leverage Rebuilt on Fragile Foundations
Open Interest on perpetuals is rising in a context of declining real volumes — a sign that the « recovery » is fueled by leverage rather than genuine spot conviction. Funding rates are firmly positive (speculative bullish bias), but the Short-Term Holder SOPR has turned negative (capitulation at a loss). This combination is the ideal breeding ground for cascading liquidations.
8. Predictive Modeling: AI Consensus Points to an Explosive Q4
Beyond empirical analysis, institutional AI models project long-term perspectives diametrically opposed to the current short-term context. The Meta AI model targets $150,000 by year-end 2026, anchored on the historical cyclicity of the Halving (12–18 months of price impact). OpenAI’s ChatGPT model identifies November 2026 as the starting point of a « macroeconomic explosive resurgence. » This consensus is shared by Galaxy Digital (target: $200,000), JPMorgan ($170,000), and Bernstein ($150,000).
This consensus explains the absence of capitulation from historical institutional portfolios: knowing that monetary policy is programmed to ease at medium term, and that the Halving supply shock has yet to fully materialize, Long-Term Holders are passively absorbing retail selling pressure.
9. Strategic Synthesis: Three Execution Scenarios
The convergence of these data vectors demands an asymmetric approach based on strict invalidation levels. Here are the three modeled scenarios:
🔴 Primary Scenario — Short from Resistance
| Parameter | Level |
|---|---|
| Entry (Short) | $64,700 |
| Stop Loss | $65,500 (above Kumo + SuperTrend) |
| Take Profit 1 | $63,100 (R:R = 2.0) |
| Take Profit 2 | $62,350 (R:R = 2.94) |
🔴 Secondary Scenario — Short on Breakdown
| Parameter | Level |
|---|---|
| Entry (Conservative Short) | $62,300 (failed retest) |
| Stop Loss | $63,000 |
| Take Profit 1 | $60,800 (June 4th liquidity cluster) |
| Take Profit 2 | $59,500 (R:R = 4.00) |
🟢 Alternative Scenario — Long on Breakout (Short Squeeze)
| Parameter | Level |
|---|---|
| Entry (Long) | $65,600 (confirmed 4H close + volume) |
| Stop Loss | $64,900 |
| Take Profit 1 | $67,250 (R:R = 2.36) |
| Take Profit 2 | $68,300 (R:R = 3.86 — short liquidation cluster) |
Conclusion
Bitcoin’s profile in June 2026 is that of a head-on collision between restrictive short-term macroeconomic forces — elevated rates, massive ETF outflows, geopolitical fears around the Strait of Hormuz — and resolute long-term inelastic fundamentals: the Halving, institutional adoption via DRIP models and converging AI projections. The daily Death Cross, the 4H compression rectangle, and the extreme 15M oversold conditions demand surgical execution discipline. Institutional capital is waiting for a clear resolution of the $65,000 sell wall, or a final purge below $61,000, before deploying the liquidity needed to ignite the final phase of this market cycle.
⚠️ Disclaimer: This article is written for educational and informational purposes only. It does not constitute investment advice, nor a recommendation to buy or sell any financial or digital assets. Trading cryptocurrencies involves significant risks and may result in the total loss of invested capital. Please consult a qualified financial advisor before making any investment decision.