
In June 2026, Ethereum (ETH) is living through one of the sharpest dichotomies of its recent history: a 60% price collapse from its all-time high of $4,946, even as the network posts absolute records in adoption, scalability and institutional usage. The asset is trading in a tight range between $1,700 and $1,745, with the ETH/BTC ratio falling to a 10-month low near 0.027. Between a confirmed technical Death Cross, an ongoing spot ETF outflow crisis, and a major upcoming technological catalyst, here is a full breakdown of the situation.
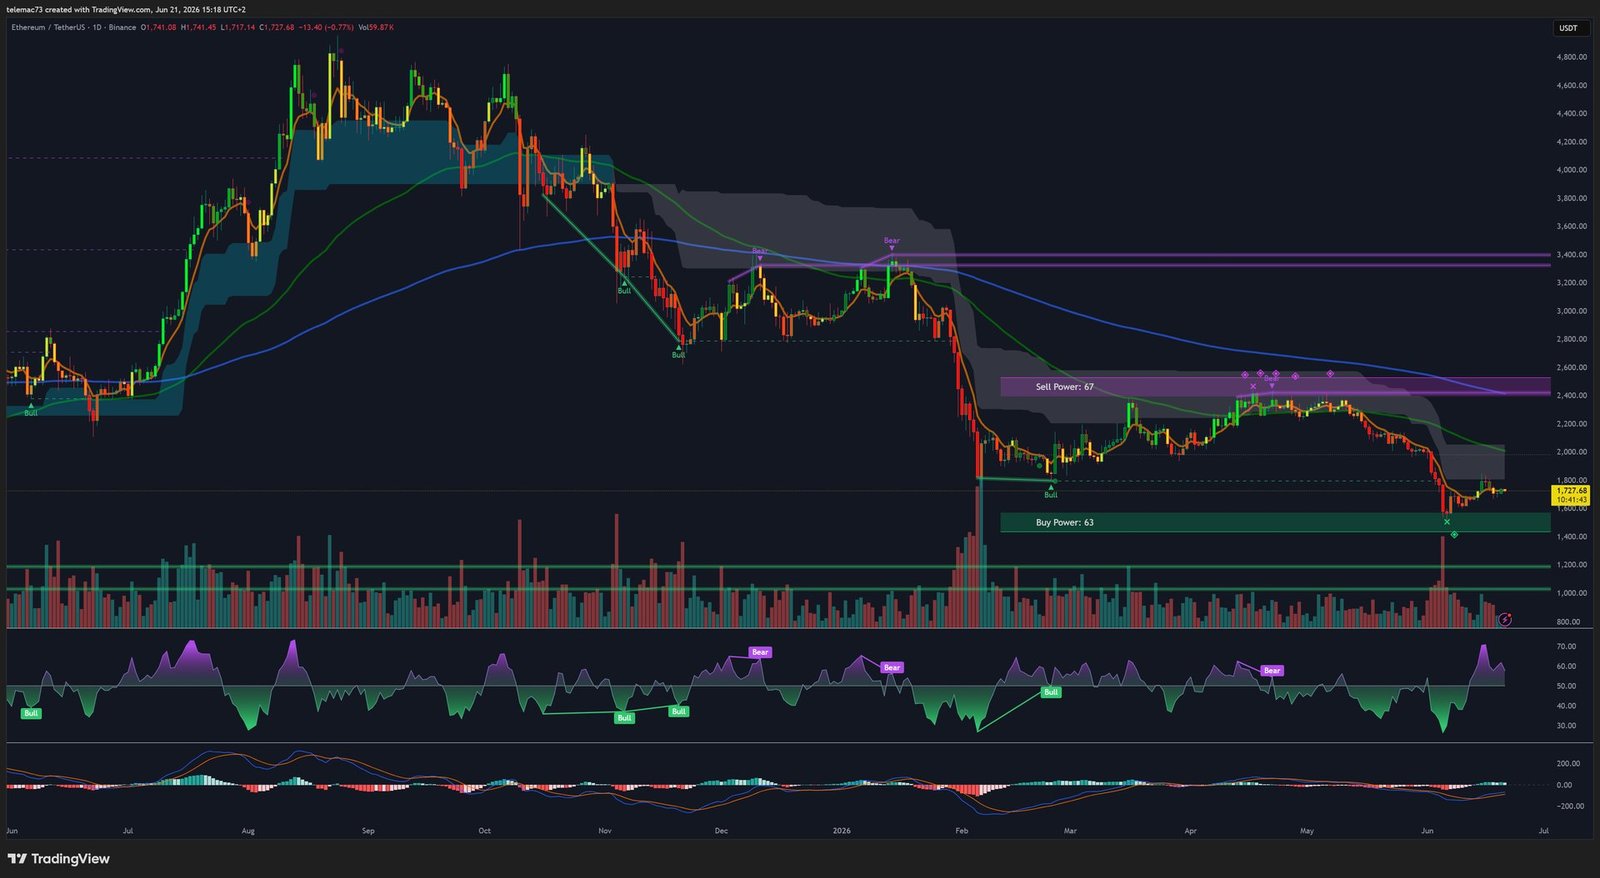
Daily chart: the Death Cross takes hold
On June 1, 2026, as ETH slid toward $1,963.50 and broke the critical psychological support of $2,000, the 50-day simple moving average crossed below the 200-day simple moving average, confirming a Death Cross — a signal historically tied to the prolonged bear cycles of 2018 and 2022. This was foreshadowed by a similar crossover on the ETH/BTC pair as early as January 19, an early warning of Ethereum’s underperformance against Bitcoin. The break of $2,000 triggered a cascade of algorithmic liquidations, dragging price down to a swing low of $1,666 by mid-June.
The daily RSI spent much of the month in oversold territory, touching 31.68 without forming a clear bullish divergence — a sign sellers retain directional control. The MACD reads a transitional neutral 43.841, with the histogram flattening near the zero line, hinting at a prolonged sideways consolidation, while Williams %R (44.319) flashes a theoretical buy signal that still needs confirmation from rising spot volume — currently absent.
4-hour chart: descending channel and bear flags
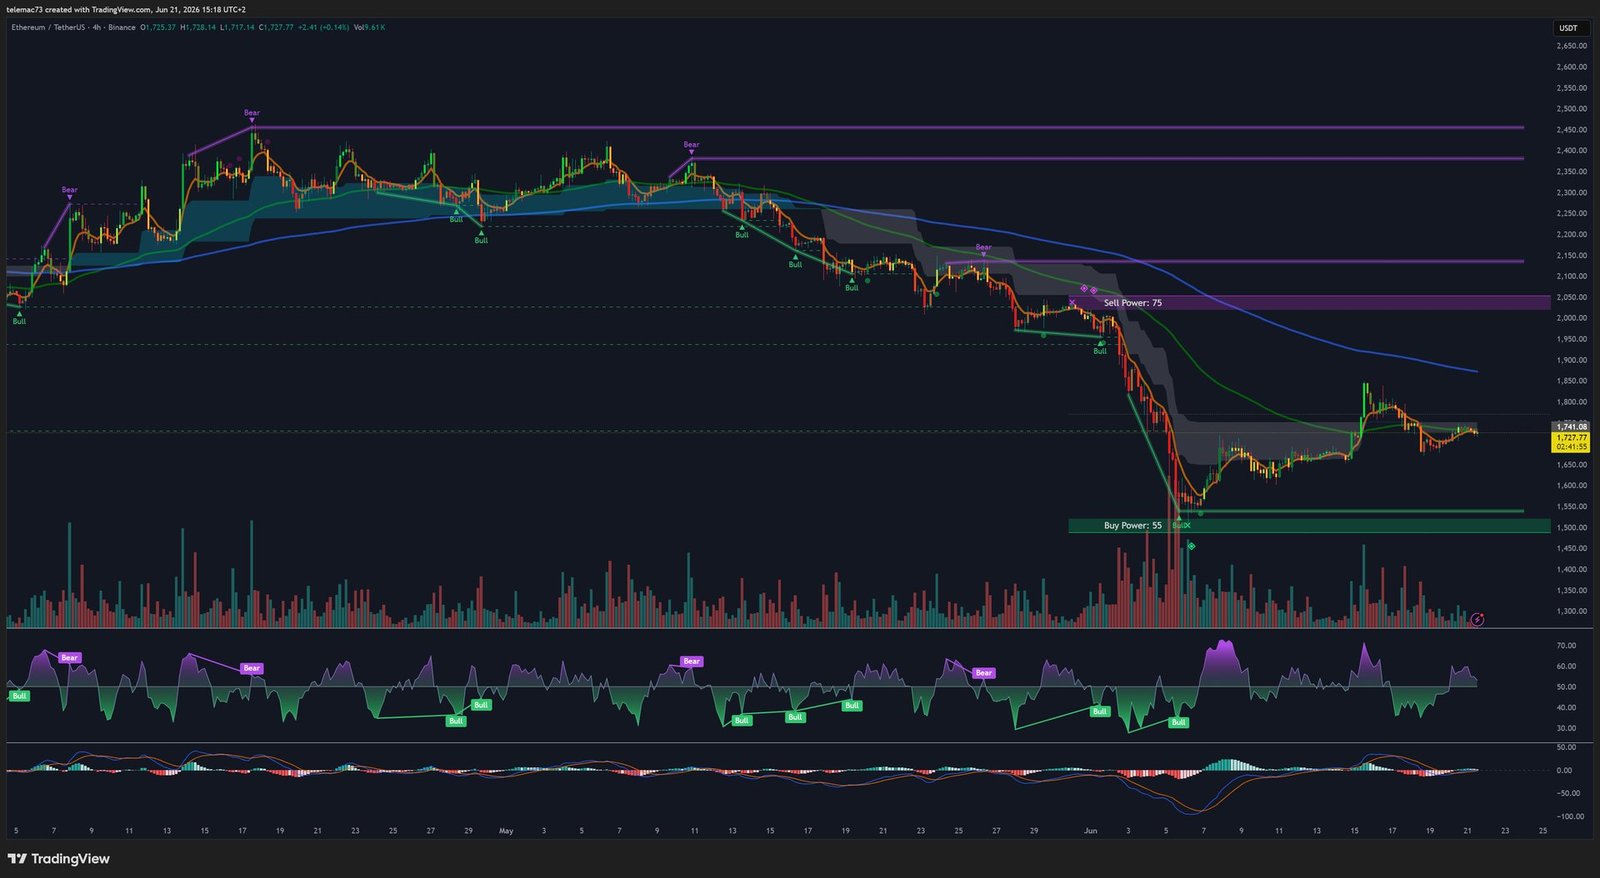
On the 4-hour timeframe, price is locked in a strict descending parallel channel, its upper boundary acting as relentless dynamic resistance. Multiple bear flags have formed throughout the decline since $3,400, each resolving to the downside. Moving averages loom oppressively above price: an immediate resistance at $1,741, followed by the EMA-20 near $1,784, a psychological ceiling at $1,806, and major rejection zones at $1,909 and $1,944 (EMA-50). As long as the asset stays below $2,088, the macro-structure remains vulnerable to further bearish impulses; a confirmed H4 close above this pivot would be the first viable signal of a regime change.
15-minute chart: compression triangles and liquidity sweeps
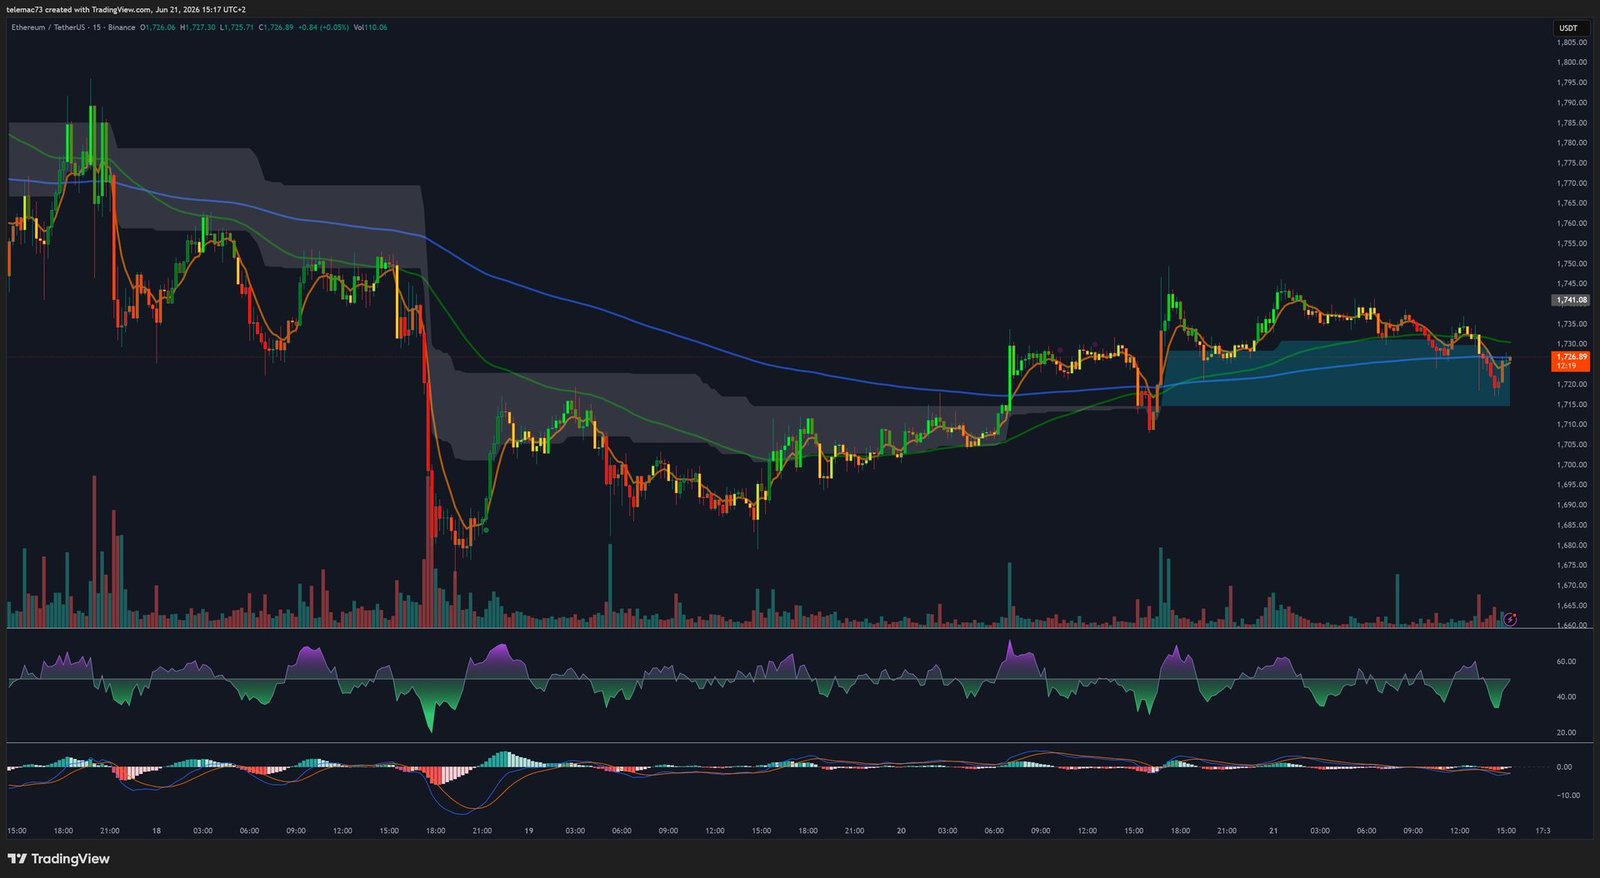
On this microstructural timeframe, the market forms multiple compression triangles, reflecting an extreme contraction of volatility between buyers defending the $1,720 support and sellers pressing below $1,730. Bullish crossovers of short-term moving averages routinely turn into bull traps. The 0.236 Fibonacci retracement at $1,726.8 acts as a short-term pivot; a close below $1,696 would confirm a breakdown of the triangle toward $1,600. RSI oscillates nervously between overbought and oversold, a typical signature of a range-bound, trendless market.
Order book heatmap: buy and sell walls
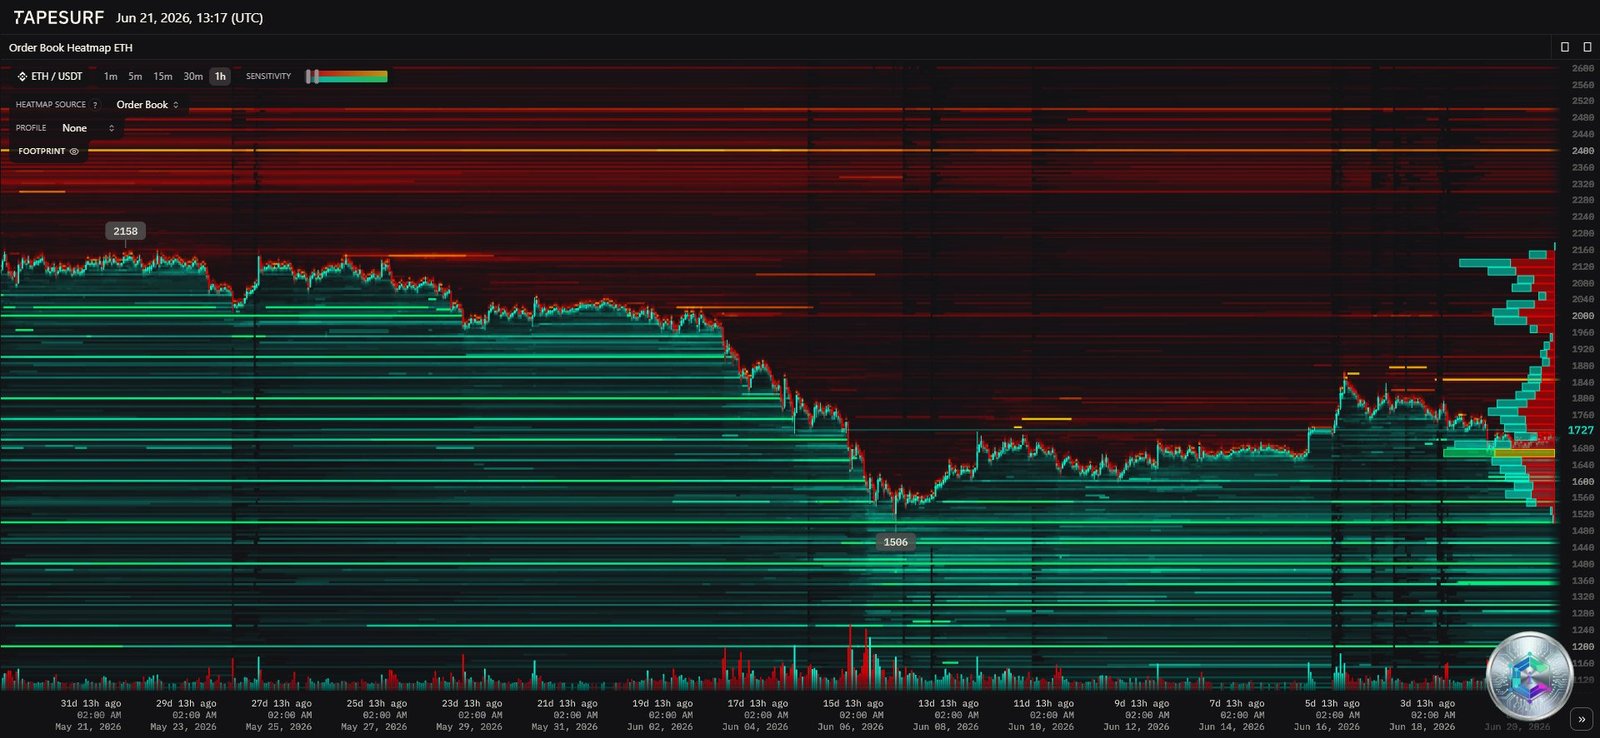
The heatmap reveals a heavy concentration of buy-side liquidity (buy wall) between $1,600 and $1,650, treated by whales and quant funds as a value area for accumulating ETH. Conversely, a dense resistance wall spans $1,900 to $2,000, drastically limiting the odds of a V-shaped recovery. A recent wave of high-leverage liquidations ($298 million across BTC and ETH) cleared out some shallow order-book liquidity, reinforcing the weight of the identified liquidity walls.
Key technical levels
| Level | Price range | Significance |
|---|---|---|
| Major resistance (invalidation) | $2,088 – $2,108 | Theoretical invalidation of the H4/Daily bearish structure |
| Institutional resistance | $1,909 – $1,944 | Historical congestion zone, sell wall on the heatmap |
| Immediate resistance | $1,741 – $1,784 | Upper boundary of the H4 descending channel |
| Intraday pivot (M15) | $1,720 – $1,726 | Compression zone, 0.236 Fibonacci retracement |
| Immediate support | $1,690 – $1,700 | Critical psychological support |
| Major support / accumulation | $1,600 – $1,650 | Massive buy wall on the heatmap |
| Ultimate support (capitulation) | $1,524 | Theoretical bearish extension in case of capitulation |
The macro divergence: Ethereum, hostage to institutional rotation
Ethereum is down 60% from its peak, versus only 48% for Bitcoin — a 12-point gap that reflects a deep divergence in institutional conviction. Bitcoin has cemented its « digital gold » narrative thanks to its capped supply, while Ethereum, priced as a high-beta tech infrastructure play, has been aggressively sold during de-risking phases.
The most direct driver of this selling pressure is the ongoing US spot Ethereum ETF outflow crisis: May 2026 saw $401.62 million in net outflows, including a streak of 17 consecutive days of withdrawals. On June 11, while Ethereum ETFs lost another $15.89 million, Bitcoin ETFs absorbed $85.85 million in net inflows. The largest Ethereum ETF (BlackRock’s ETHA) manages only $6.5-7 billion in assets, a marginal fraction compared to the $54 billion held by Bitcoin’s IBIT.
Sentiment has also been weighed down by high-profile whale selling: Arthur Hayes, co-founder of BitMEX, liquidated 6,000 ETH at a loss around $1,690, while transfers from Vitalik Buterin to exchanges have also been flagged, prompting some traders to brand Ethereum a « cursed asset. »
The fundamental paradox: a network at the peak of its game
Paradoxically, the Ethereum network has never performed better. In Q1 2026, monthly active users reached 13.2 million (+85.9% YoY), with 200.4 million transactions processed (+81.5%). At the same time, Layer 1 transaction fees collapsed 47.9% quarter-over-quarter — a sign of successful scalability rather than network desertion, though also of a slowing EIP-1559 burn mechanism, which weighs on the deflationary narrative.
The most structurally important trend remains real-world asset (RWA) tokenization: the market cap of tokenized assets on Ethereum reached $203.4 billion (+42.9% YoY), with near-total institutional dominance in stablecoins (61.8% market share), tokenized funds (73%) and tokenized commodities (84%). Giants like BlackRock, JPMorgan Chase and Fidelity International have launched or expanded liquidity solutions directly on Ethereum.
Governance: the funding controversy and the institutional response
In mid-June, Trent VanEpps, former core development coordinator at the Ethereum Foundation, warned of a possible « slow-burning funding crisis » threatening core development teams within three to nine months, as historical sources like the Client Incentive Program expire and the Foundation voluntarily reduces its role (the « Subtraction » strategy, cutting burn rate from 15% to roughly 5% by 2030). At least eight senior researchers and contributors have left the ecosystem since January, including co-executive director Hsiao-Wei Wang.
Tom Lee, chairman of BitMine, flatly rejected these fears, putting the odds of a real crisis at « zero » and stating that private capital was ready to backstop any Foundation pullback. On the operational front, the Ethereum Foundation also rolled out « Clear Signing » standards to protect users from phishing attacks.
Glamsterdam: the major technological catalyst for H2 2026
Ethereum’s next major upgrade, Glamsterdam, is targeted for late August 2026. It bundles several systemically important EIPs: ePBS (EIP-7732), separating block building from block proposing to cut predatory MEV by up to 70%; parallel execution (EIP-7928, BALs), targeting a theoretical throughput of 10,000 TPS; a new gas repricing package (EIP-7904) promising a 78.6% reduction in fees; and EIP-8037, which caps state growth and enabled a fourfold increase in the network’s gas limit, from 60 to 200 million.
If testing on Sepolia and Hoodi continues to go well, Glamsterdam could propel Ethereum into a new era of competitiveness against next-generation monolithic blockchains, while preserving its decisive edge in security and decentralization.
Scenarios for the second half of 2026
| Scenario | Projected range | Assumptions |
|---|---|---|
| Bearish | $1,200 – $2,000 | Continued ETF outflows, persistent macro tension, break of $1,600 |
| Neutral | $2,000 – $3,800 | Rate stabilization, ETF outflows stop, successful Glamsterdam rollout |
| Bullish | $5,000 – $7,500+ | Massive ETF inflows, widespread RWA adoption, return of risk appetite |
| Extreme growth | Above $8,000 | Total dominance as global finance infrastructure |
Conclusion
Ethereum in June 2026 embodies a rare dichotomy: a heavily damaged chart structure (Death Cross, descending channels, institutional sell walls) set against a network at the peak of its operational performance (record adoption, overwhelming dominance in real-world asset tokenization). The asset is leaning on a vital liquidity zone between $1,600 and $1,700; losing it would open the door to further liquidation cascades. But the convergence between the technological maturation driven by Glamsterdam and a potential macroeconomic easing could offer meaningful bullish asymmetry over the medium term.
Disclaimer: This article is provided for informational and educational purposes only. It does not constitute investment advice, nor a recommendation to buy or sell. Cryptocurrency markets are highly volatile and carry significant risk of capital loss. Always do your own research (DYOR) before making any investment decision.