
June 20, 2026 — The Bitcoin (BTC/USDT) market is going through a rare phase of systemic recalibration. After reaching a historic all-time high near $126,080 in October 2025, the asset has wiped out nearly half its market cap and is now frozen in a precarious compression zone, oscillating around the $63,667 pivot.
This fractal deceleration, visible across every timeframe, stems from a rare convergence of forces: a brutally restrictive US monetary policy, chronic geopolitical instability in the Middle East, a massive institutional capital flight via spot ETFs, and a critical deterioration in mining profitability. The collapse of the highly anticipated US-Iran peace summit at Bürgenstock instantly wiped out a major geopolitical risk premium, while the FOMC, under new chair Kevin Warsh, delivered a decidedly hawkish message that crushed hopes for risk-asset liquidity.

1. Liquidity mapping: what the order book heatmap reveals
The BTC/USDT order book heatmap, generated by Tapesurf on June 20, 2026 at 06:16 UTC, exposes the three-dimensional topology of passive liquidity. Unlike a standard chart, it identifies where limit orders cluster — true magnets for market-making algorithms.
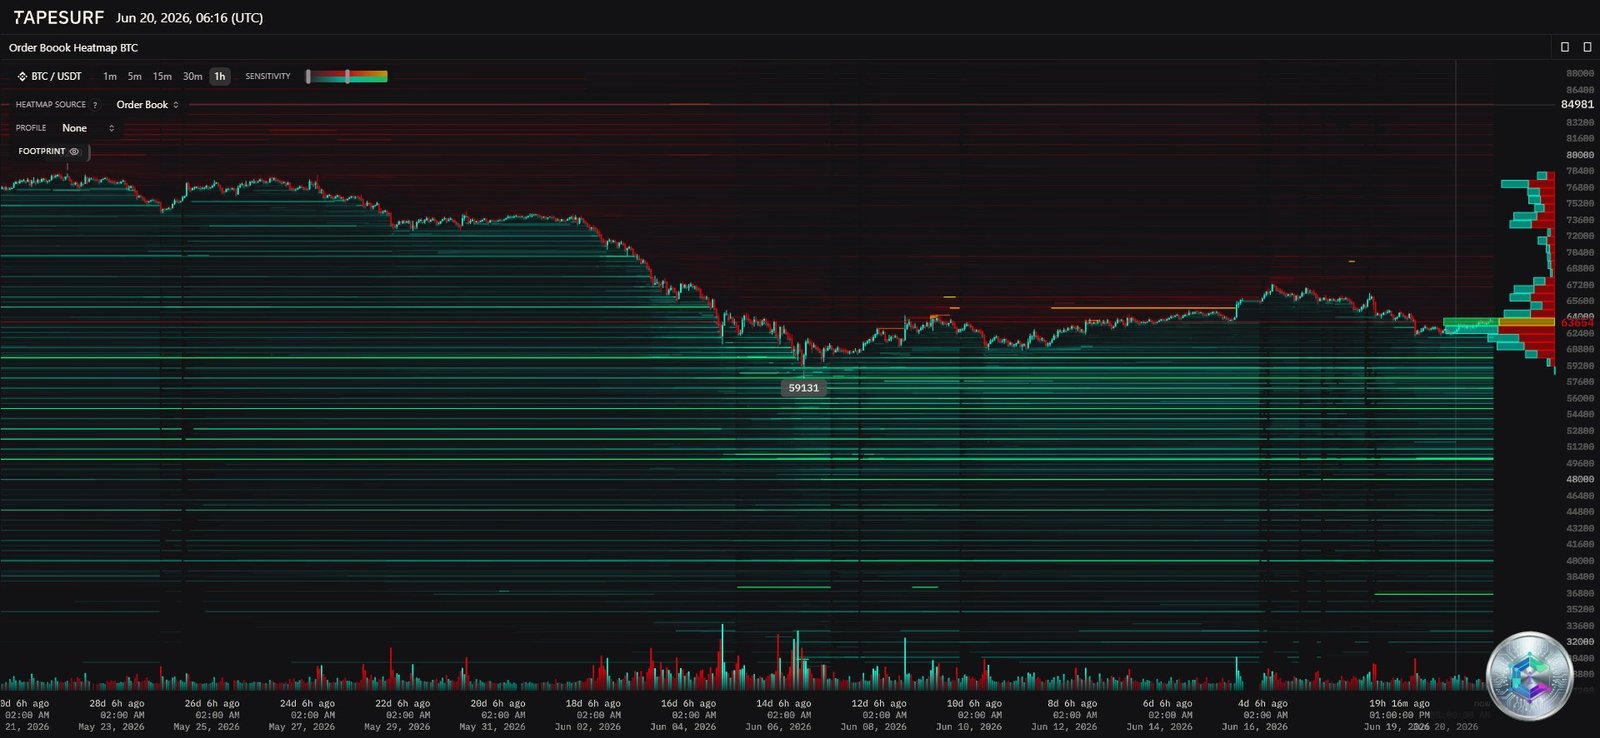
The anatomy of the drop and the demand wall
The heatmap highlights a precise mark at $59,131, the exact bottom of the capitulation wick, corresponding to massive absorption by passive buyers. Below that level, a dense stack of buy walls spans between $50,000 and $58,000: large players have clearly positioned massive bids to defend this structural floor.
Selling pressure and order book asymmetry
Above the current price, the landscape is dominated by a spectrum of sell walls, particularly dense between $64,500 and $67,000, with liquidity pockets extending up to $74,000. Every bullish bounce attempt will need to consume an enormous amount of capital to advance. This asymmetry is corroborated by CoinGlass data: dense pockets of highly leveraged short positions sit around $63,500, $65,000, and $68,300, opening the door to a short squeeze on a rebound — but also the risk of a liquidity trap on a breakdown below $60,000.
2. The daily timeframe (1D): a macro-structural fracture
The daily chart confirms an extended distribution cycle. At $63,667.97, the structure reflects a market under continuous pressure.
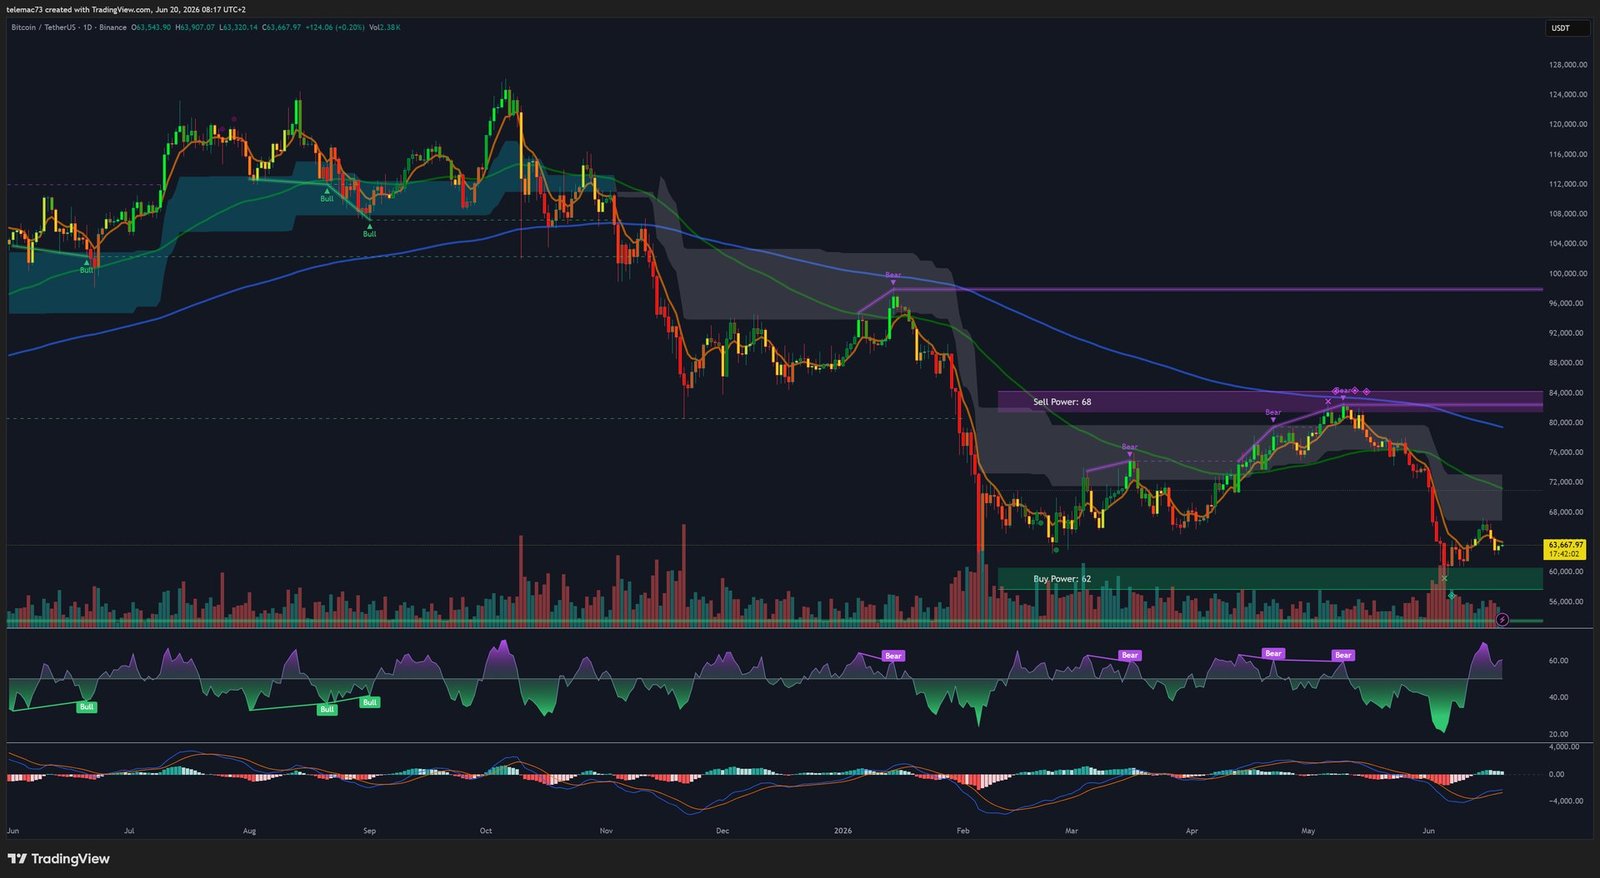
The Death Cross threat
The 200-day Simple Moving Average, currently at $65,192, has historically separated bull and bear markets. Price has not only broken below it but has retested it repeatedly without reclaiming it, turning it into dynamic resistance. The 50-day moving average is plunging rapidly toward the 200 SMA, signaling an imminent « Death Cross, » a potential catalyst for automated selling by trend-following algorithms.
Key technical levels
| Technical level | Estimated value | Significance |
|---|---|---|
| Macro Resistance 2 | ~$80,000 – $84,000 | Historic distribution zone, major « Sell Power » |
| Macro Resistance 1 | $69,650 | Ceiling of the consolidation preceding the FOMC |
| Dynamic Pivot (200 SMA) | $65,192 | Bull/Bear demarcation line |
| Current Spot Price | $63,667 | Indecision zone, bearish channel compression |
| Major Support 1 | $61,200 – $62,100 | Recent bounce zone, strong passive liquidity |
| Floor Support (Buy Power) | $58,310 – $60,000 | Lower Bollinger Band, capitulation risk toward $50,000 |
RSI and MACD: reading market psychology
The MACD shows deep red bars, reflecting powerful selling momentum, though a slight deceleration of the histogram is emerging. The RSI hovers between 40 and 49.74, having exited extreme oversold territory but still below the 50 midline — confirming sellers still control the directional flow, in a textbook « attrition phase. »
3. The 4-hour timeframe: compression and hope for a Golden Cross
The 4H chart dissects the mechanics of the recent decline from $71,000 down toward $61,000.
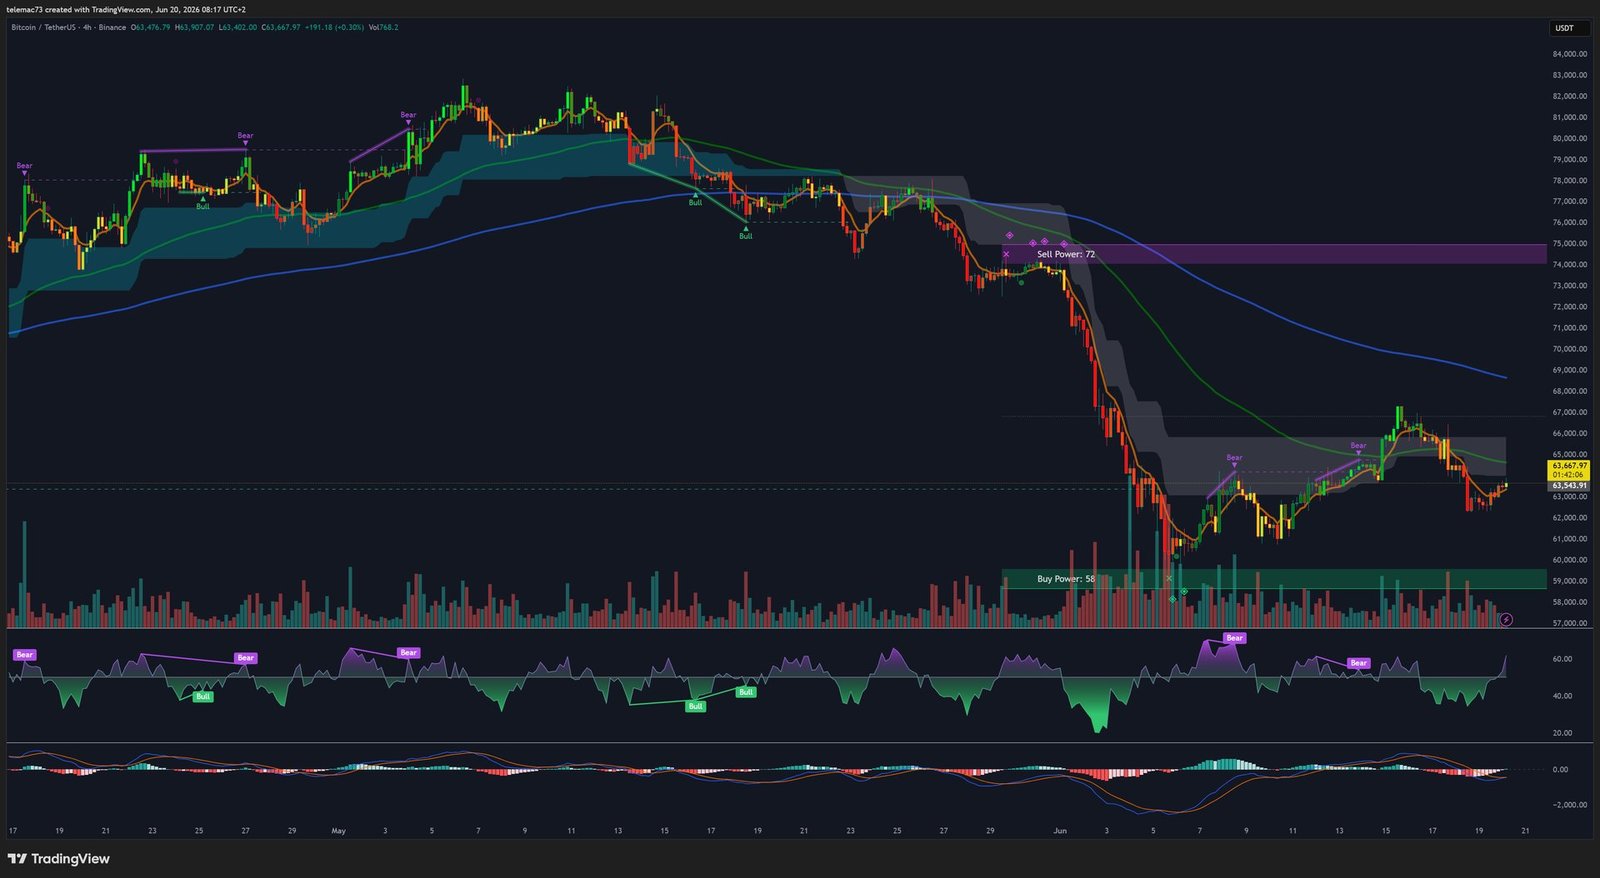
The chart is structured by several explicitly annotated bear flags. After a violent bearish impulse, price consolidates in a fragile ascending or sideways channel lacking institutional volume. The market currently sits in the final phase of an asymmetric compression triangle: lower highs, with lows attempting to form a precarious horizontal support around $63,000. The longer this compression persists without breaking above $65,000, the more violent the eventual volatility expansion is likely to be.
4. The 15-minute timeframe: the theater of algorithmic warfare
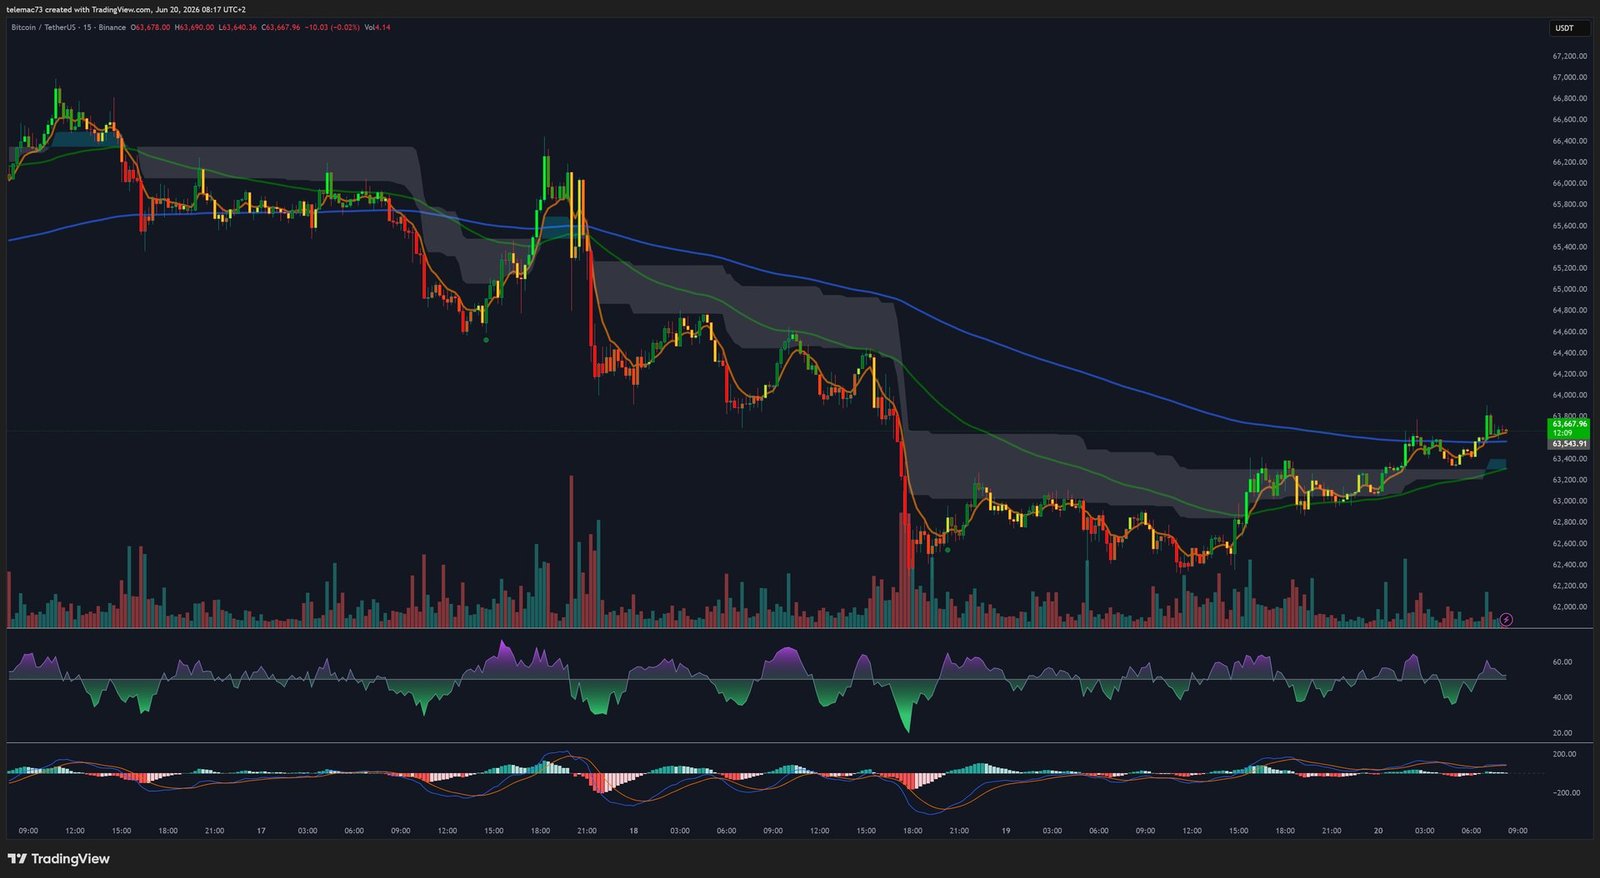
On this timeframe, the market produces an erratic succession of highs and lows with no clear direction (whipsaw), trading within a tight corridor between $61,000 and $65,800. High-frequency algorithms hunt liquidity on both sides, generating destructive candles for leveraged retail traders’ capital.
5. Macro context: the Bürgenstock-Warsh double shock
The collapse of the planned US-Iran peace summit at Bürgenstock erased a major geopolitical risk premium. Combined with the firmly restrictive tone of new Fed Chair Kevin Warsh, this double shock triggered the liquidation of long positions built on optimism over de-escalation, drawing the « falling knife » visible on the 4H and 15-minute charts — Bitcoin fell from $65,000 to $61,000 in under 48 hours.
6. On-chain dynamics: miner capitulation, institutional accumulation
According to JPMorgan analysts, the average cost of producing one Bitcoin now stands at $78,000, roughly 19% above spot price. This negative profitability has rendered nearly 20% of the mining industry unviable: in Q1 2026 alone, miners dumped more than 32,000 BTC onto the market, a volume exceeding their combined sales for all of 2025.
On the ETF side, June 2026 saw the longest streak of outflows since launch: 13 consecutive days of net redemptions between May 15 and June 3, totaling roughly $4.4 billion, with BlackRock’s IBIT alone losing nearly $3.3 billion. The 30-day realized profit/loss ratio collapsed to 0.27, and more than 46% of circulating supply is now held at a loss — a condition that historically coincides with the formation of major market bottoms.
Against this pressure, Strategy (formerly MicroStrategy) demonstrated the resilience of its accumulation model by repurchasing 1,587 BTC for $100 million between June 8 and 14, bringing its treasury to 846,842 BTC. Long-term holders, meanwhile, quietly accumulated more than 125,000 BTC over the course of the month, one of the most massive monthly accumulation events of the cycle.
7. Three scenarios for the weeks ahead
Scenario 1 — Bullish short squeeze
The derivatives market is structurally over-exposed to the downside, and the options skew shows a record +9.9 percentage point asymmetry in favor of puts. A sustained breakout above $65,192 (reclaiming the 200 SMA) could force short sellers to cover, propelling the asset toward the $74,000 resistance zone.
Scenario 2 — Structural breakdown
Should the $61,200 support fail, the market could test the lower daily Bollinger Band around $58,310, triggering a cascade of institutional stop-losses toward the $50,000 zone.
Scenario 3 — Algorithmic attrition (whipsaw)
With the daily RSI sitting near neutral (49.74), the most likely near-term scenario remains an extended consolidation between $61,000 and $65,800, while the market digests the shock of a durably restrictive monetary policy.
Disclaimer: This article is provided for informational and educational purposes only. It does not constitute investment advice, a recommendation to buy or sell, nor a solicitation to engage in any financial market transaction. Cryptocurrencies are highly volatile and risky assets. Always do your own research (DYOR) and consult a licensed financial advisor before making any investment decision.