
As of mid-June 2026, Bitcoin (BTC) is trading around $62,791, marking a roughly 49.4% correction from its all-time high of October 2025 (~$126,200). While U.S. equities enjoy a geopolitical relief rally on the back of an imminent US-Iran peace deal, the crypto market is absorbing the full force of the Federal Reserve’s hawkish pivot. This divergence sets the stage for a multi-timeframe analysis that reveals growing tension between a bearish technical structure and increasingly bullish on-chain fundamentals.
A Macroeconomic Backdrop Under Pressure
On June 17, 2026, the FOMC — now chaired by Kevin Warsh — held rates steady between 3.50% and 3.75% for a fourth consecutive meeting. What rattled markets was the revised dot plot: nine of eighteen officials now project at least one rate hike before year-end, a complete reversal from prior easing expectations. Combined with an upward revision of PCE inflation forecasts to 3.6%, the announcement triggered a combined $111 million in outflows from spot Bitcoin and Ethereum ETFs in a single session.
Industry Dynamics and On-Chain Signals
On the regulatory front, pressure on centralized exchanges is intensifying: Binance’s MiCA approval in Greece is reportedly being blocked by the ECB, while Bybit has been added to Singapore’s MAS watchlist. These frictions are accelerating a structural shift toward decentralized finance, whose spot market share has doubled to 14% in early 2026.
On the mining side, MARA Holdings illustrates the margin squeeze, with shares sliding to $13.92 after disappointing earnings, pushing miners to reallocate part of their infrastructure toward artificial intelligence. Despite this, network activity remains robust, with over 800,000 daily transactions, largely driven by OP_RETURN-based protocols rather than traditional value transfers.
The most striking signal: during the drop toward $59,000, Supply in Loss crossed the 10.46 million BTC threshold — a level historically associated with market bottoms. In that same window, long-term holders accumulated more than 125,000 BTC in a single month, one of the largest monthly absorptions of the current cycle.
| Date | BTC Purchased | Avg. Price | Cumulative Holdings |
|---|---|---|---|
| Jun 15, 2026 | 1,587 | $63,024 | 846,842 |
| Jun 8, 2026 | 1,550 | $65,332 | 845,256 |
| May 18, 2026 | 24,869 | $80,985 | 843,738 |
| Apr 20, 2026 | 34,164 | $74,395 | 815,061 |
| Apr 13, 2026 | 13,927 | $71,902 | 780,897 |
Order Book and Liquidity Heatmap
The order book heatmap shows a clear asymmetry. Above the market, a dense sell wall is forming around $78,200, making any bullish breakout expensive in volume terms. Below it, a major institutional buy wall sits at $59,131, already tested and validated during the recent dip below $60,000.
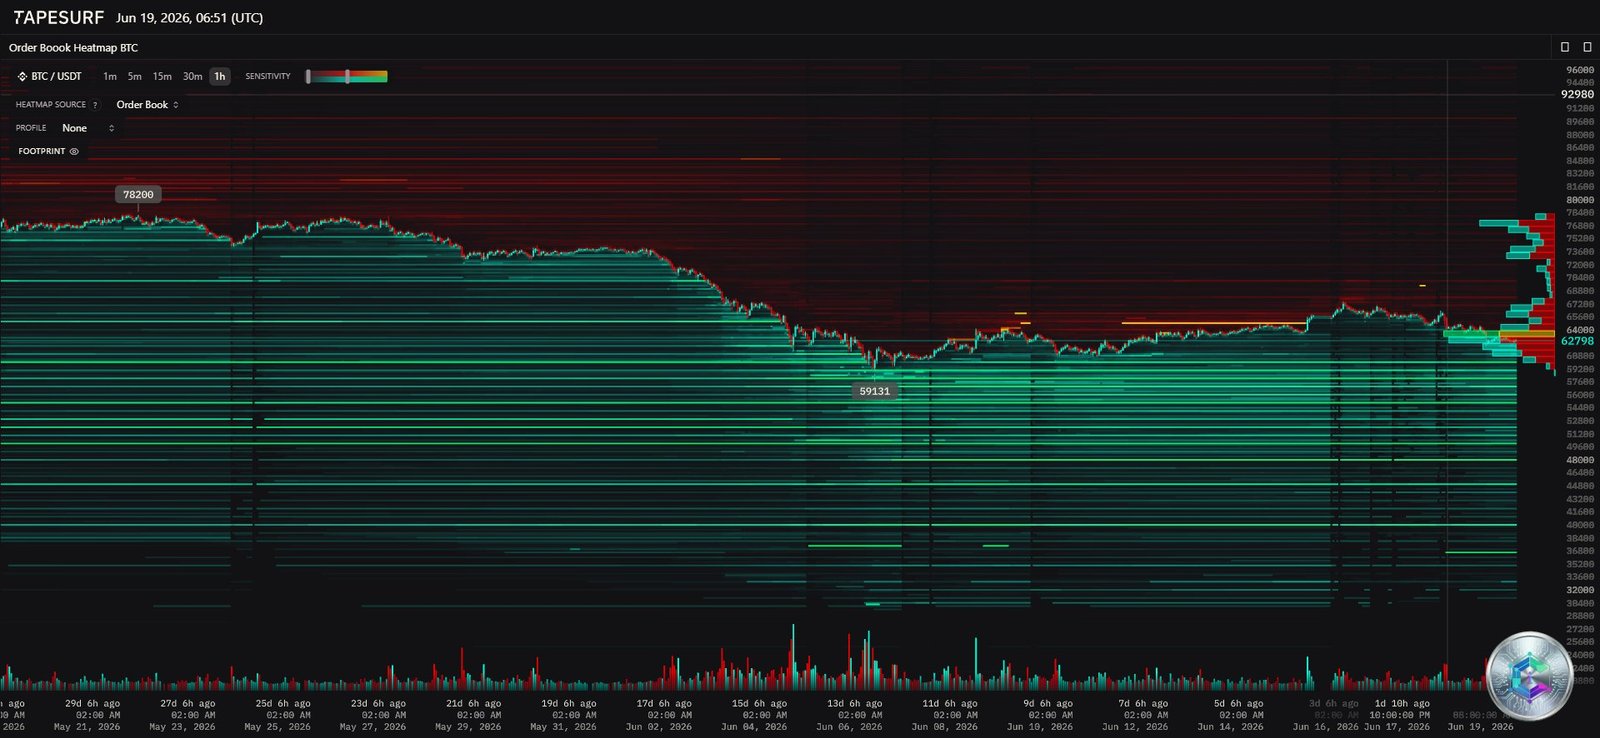
The collapse toward $59,000 purged a large share of over-leveraged longs, leaving relatively little immediate downside liquidation risk. Conversely, large clusters of short liquidations have built up between $80,000 and $91,000, signaling that « max pain » for leveraged speculators now sits to the upside.
Daily Chart (1D): A Descending Channel Under Pressure
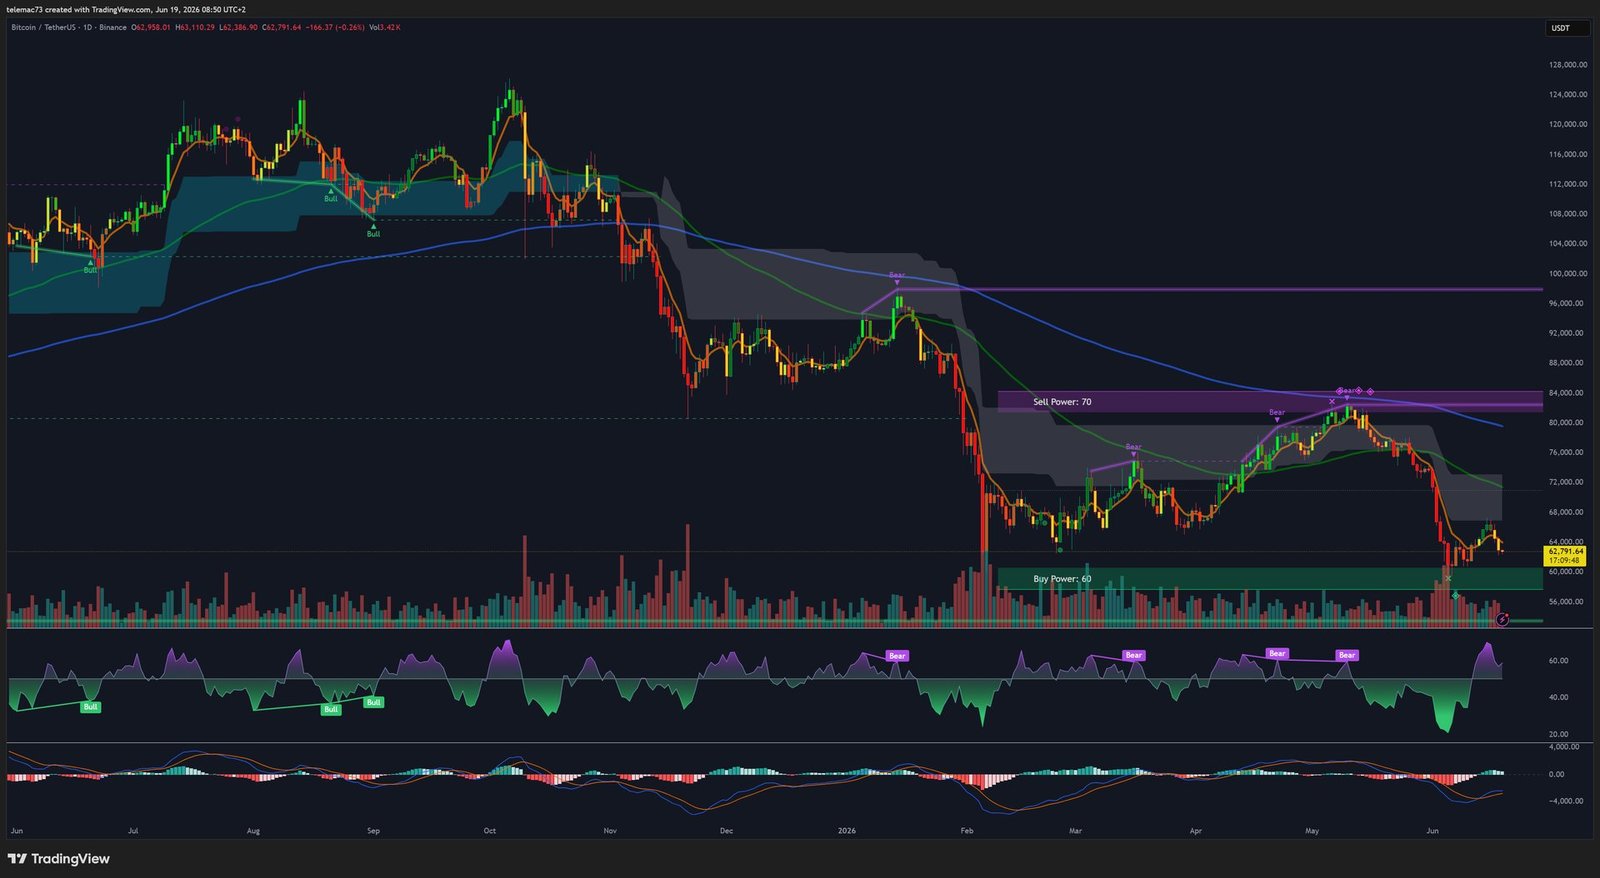
Price remains trapped in a broad descending channel, deep below a bearish Ichimoku cloud. The daily RSI hovers around 30 (oversold) with no clear bullish divergence, while the MACD has confirmed a bearish crossover in negative territory. A « Sell Power » resistance zone sits between $83,000 and $84,000, opposing a « Buy Power » support zone between $59,000 and $60,000. A break of the channel’s lower bound would technically project price toward $51,291.
4-Hour Chart (4H): Cascading Bear Flags
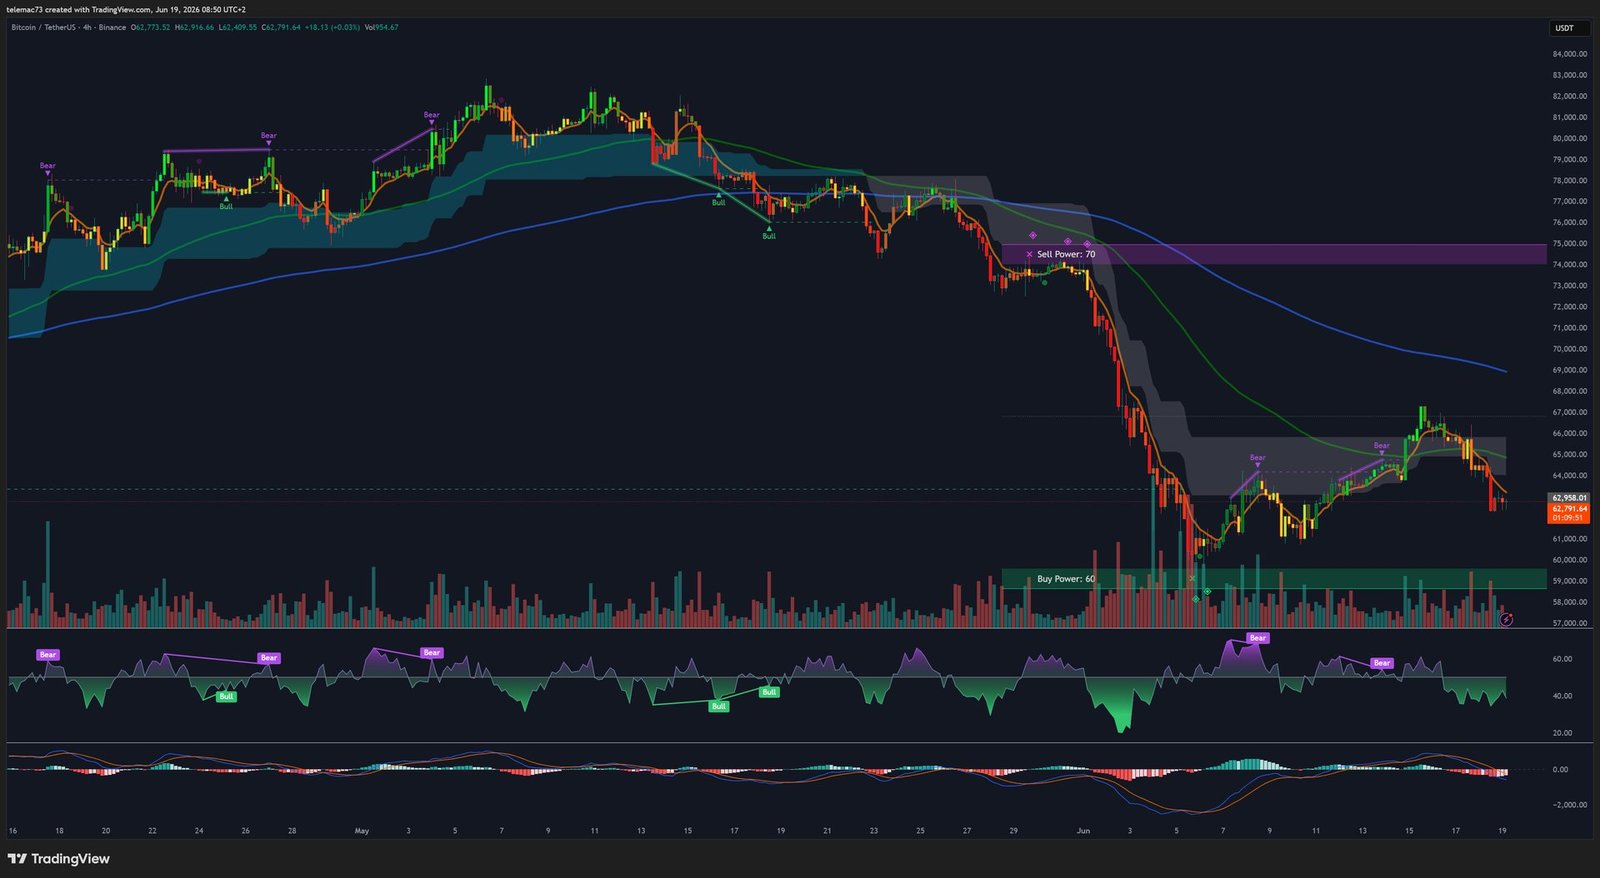
On the 4H chart, the structure is a chain of bear flags: every selling impulse is followed by a tight, low-volume consolidation before the next leg down. The Ichimoku cloud acts as dynamic resistance, a « Sell Power » zone confirms near $74,000, and MACD bounces below the zero line consistently turn into bull traps.
15-Minute Chart: Intraday Chop and Indecision
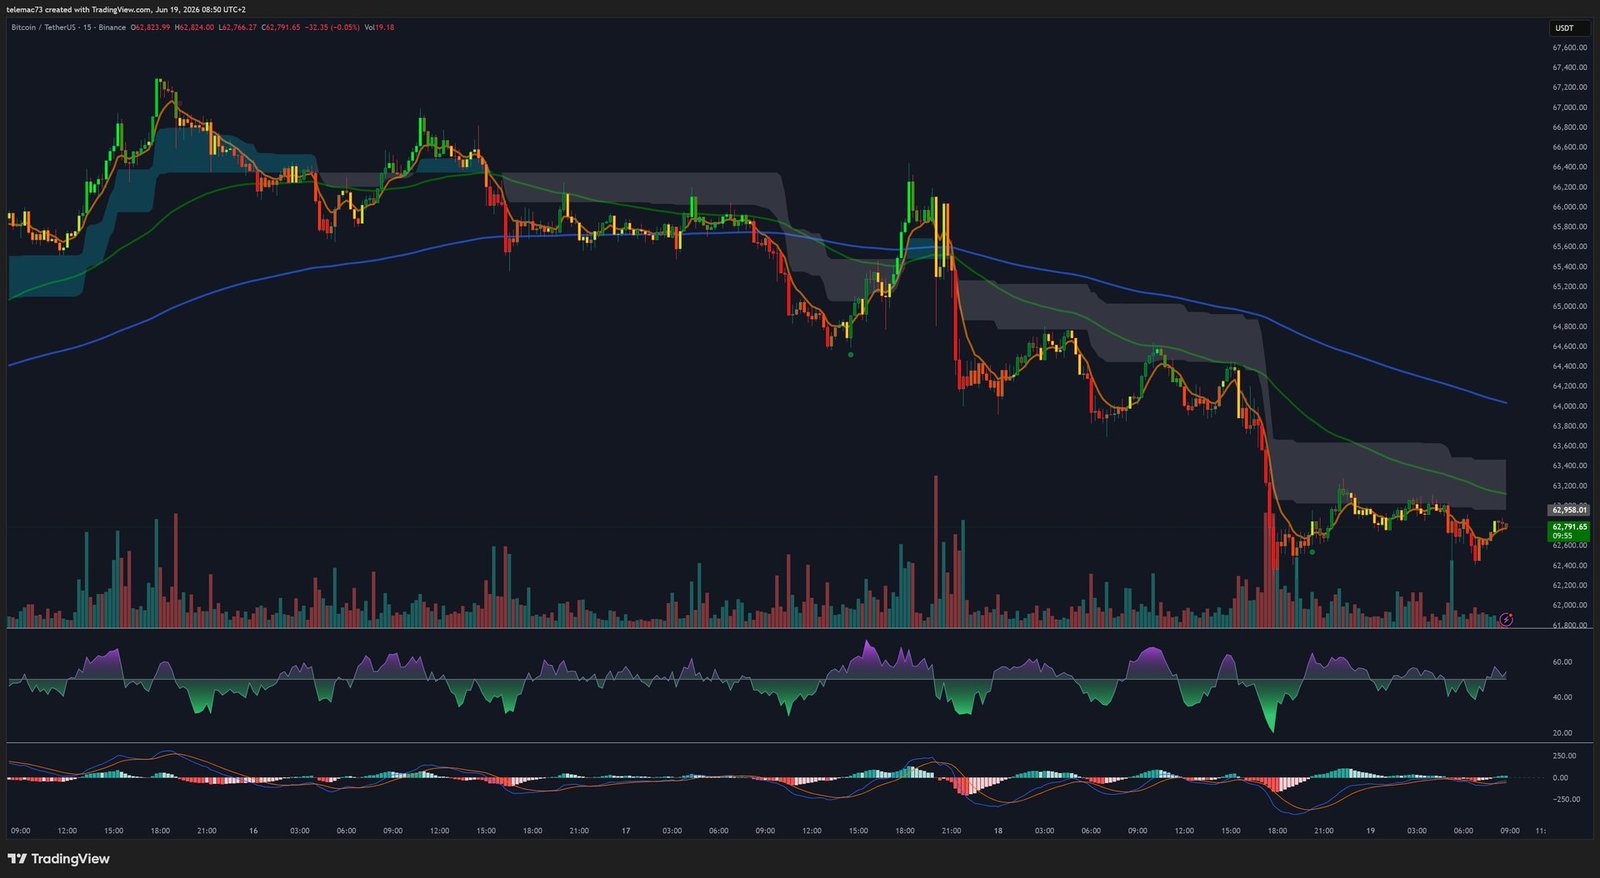
On the shortest timeframe, the market is digesting the FOMC shock in a chaotic fashion: large distribution candles, unfilled Fair Value Gaps, and a MACD pinned flat to the zero line. The $63,500 zone is being passively defended, while every attempt to clear $64,200 is sold into — a sign of a market chopping inside a tight, directionless range.
Derivatives: An Extreme — and Potentially Explosive — Bearish Bias
The market’s most contrarian signal remains the funding rate: 46 consecutive days in negative territory, the longest streak since the FTX collapse in 2022. Historically, the 30 days following negative funding periods have averaged +11.5% returns (with a 77% hit rate), versus a +4.5% average across all periods — rising to a median +63.1% over 180 days. A rebound strong enough to squeeze short sellers could trigger a short squeeze, propelling price toward the liquidation clusters above $80,000.
This contrarian read should be tempered, however: aggregate open interest dropped to $2.66 billion after the Fed decision, and the June 17 options flow on IBIT shows a clearly defensive institutional bias, with puts capturing 64.71% of volume — including a massive block of 29,883 contracts at a $34 strike, signaling hedging against a severe stress scenario.
Market Cycles: Where Do We Stand?
The October 2025 top (~$126,200) has been described as « the calmest top Bitcoin has ever seen, » validating barely two of eleven historical overheating signals. The law of diminishing returns suggests a correction just as moderate as the preceding rally — which would place a potential capitulation zone between $40,000 and $46,000, consistent with the $51,291 technical target derived from the daily descending channel.
| Cycle | Start | Top | Starting Price | Peak Reached | Performance | Drawdown |
|---|---|---|---|---|---|---|
| Cycle 1 | Nov-2011 | Nov-2013 | $2 | $1,134 | +55,308% | -85% |
| Cycle 2 | Jan-2015 | Dec-2017 | $172 | $19,588 | +11,374% | -83% |
| Cycle 3 | Dec-2018 | Nov-2021 | $3,237 | $67,589 | +2,088% | -77% |
| Cycle 4 (current) | Nov-2022 | Oct-2025 | $15,798 | ~$126,200 | +698% | -49.4% (ongoing) |
Conclusion
Bitcoin enters the summer of 2026 squeezed between restrictive monetary policy and bearish chart structures across every timeframe. But beneath this apathetic surface, a real powder keg is building: relentless institutional accumulation is colliding with record short positioning and 46 days of negative funding. The smallest liquidity catalyst could be enough to violently reverse the asset’s trajectory.
Disclaimer: This article is provided for educational and informational purposes only. It does not constitute financial advice, investment advice, or a recommendation to buy or sell. Cryptocurrency markets are highly volatile and risky; only invest what you can afford to lose and always do your own research (DYOR).