
In June 2026, Bitcoin finds itself at a critical structural crossroads. After reaching an all-time high of $126,080 in October 2025, the asset has suffered a brutal 50% correction, repeatedly testing the floor at $61,500. This comprehensive multi-timeframe analysis dissects the full spectrum of forces at play — macro, institutional, technical, and on-chain — to map out the key scenarios ahead.
🌐 Macroeconomic Environment: The May 2026 CPI at the Heart of the Storm
The release of the May 2026 Consumer Price Index (CPI) on June 10, 2026 represented the most anticipated directional trigger of the quarter. Headline CPI came in at 4.2% year-over-year, exactly in line with consensus expectations. However, the surface reading masks critical underlying dynamics: more than 60% of the monthly increase was driven by energy prices (+3.9% MoM), a direct consequence of escalating US-Iran geopolitical tensions.
The signal that truly mattered to markets was Core CPI (excluding food and energy): it printed at 2.9% YoY and +0.2% MoM, meaningfully below the +0.3% consensus estimate, with base goods even registering monthly deflation of -0.1%. This dichotomy triggered a spectacular « V-shaped » reaction: an initial algorithmic plunge to $61,500, quickly absorbed by institutional buyers who interpreted the soft Core CPI as a signal that the Fed would hold rates steady — propelling prices back to $62,800–$63,000.
| Indicator (May 2026) | Result | Consensus | BTC Impact |
|---|---|---|---|
| Headline CPI (YoY) | 4.2% | 4.2% | Neutral |
| Energy Contribution (MoM) | +3.9% | N/A | Bearish |
| Core CPI (YoY) | 2.9% | > 2.9% | Bullish |
| Core CPI (MoM) | +0.2% | +0.3% | Bullish |
All eyes now turn to the FOMC meeting on June 16–17, 2026. The rate decision itself is secondary — it’s the « Dot Plot » (the Fed governors’ rate projection chart) that will crystallize volatility. A dovish signal suggesting rate cuts later in 2026 could propel Bitcoin toward $66,000–$70,000, while a hawkish stance risks triggering another test of the $58,000–$60,000 support zone.
🏦 The « Strategy » Shock: Institutional Psychology and Cascade Effects
The most impactful institutional episode of June 2026 involves Strategy (formerly MicroStrategy), the world’s largest corporate Bitcoin holder. The disclosure of an SEC Form 8-K confirming the sale of 32 BTC — the first liquidation since 2022 — triggered a psychological shockwave wildly disproportionate to the transaction’s nominal value (≈ $2M).
Analysis reveals the sale was driven by corporate treasury constraints: meeting approximately $750–800 million in annual preferred stock dividend obligations. The company’s response was swift and decisive: on June 8, 2026, Strategy announced the aggressive purchase of 1,550 BTC for $101.3M (average price: $65,332), bringing total holdings to 845,256 BTC. This massive buy triggered a Short Squeeze worth $504–540 million, propelling prices from $59,353 to $63,800.
Simultaneously, US Bitcoin Spot ETFs recorded a historic streak of 13 consecutive days of net outflows, draining $4.4 billion from the market. The Coinbase Premium Index remains anchored in negative territory (-0.035), confirming persistent weakness in US institutional demand.
📊 Multi-Timeframe Technical Analysis
Daily Chart: A Double Bottom in Formation
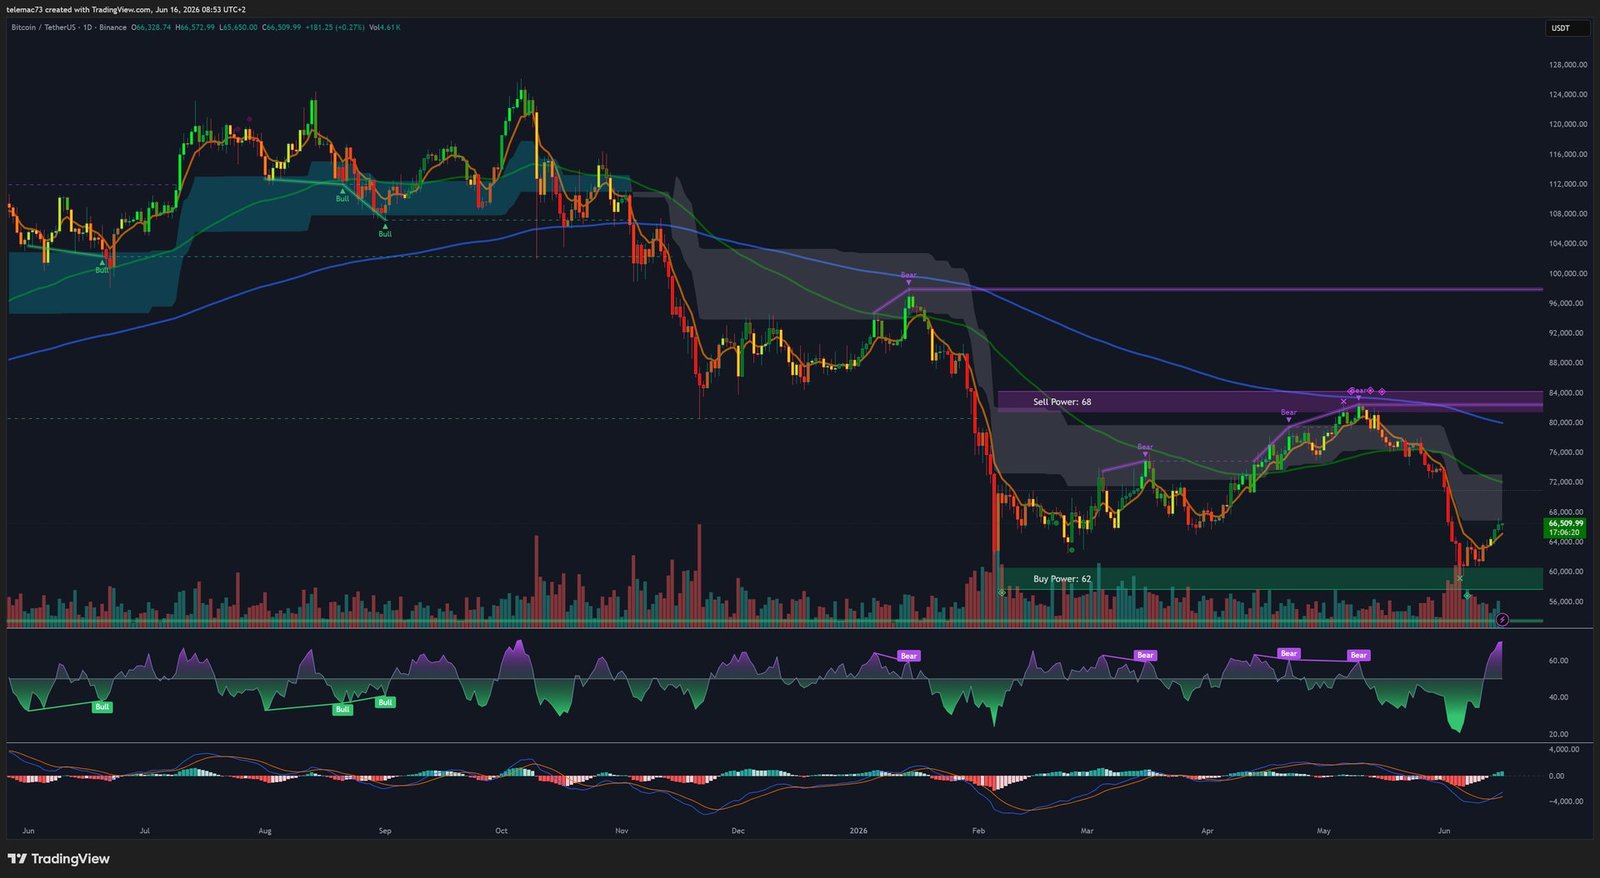
On the daily timeframe, market structure is dominated by the formation of a Double Bottom — a classic bullish reversal pattern. The first trough was anchored in March 2026, while the second is currently consolidating after the June capitulation in the $60,000–$60,700 zone, which represents the key institutional support level.
- Double Bottom Neckline: $81,000 — a confirmed close above this level would activate a measured price target at $108,000 (+60% from current levels)
- Daily RSI: Crashed to 16 at the purge low (extreme oversold territory), now rebounding toward the neutral zone
- Weekly Bullish Divergence: Price prints Lower Lows, but the weekly RSI forms Higher Lows — a powerful signal of bearish momentum exhaustion
- EMA 20d: $70,200 | EMA 50d: $74,000 | EMA 100d: $76,662 — all sloping negative, Death Cross risk imminent
| Technical Level (Daily) | Price USD | Role |
|---|---|---|
| Critical support zone | $60,000 – $60,700 | Double Bottom base / Institutional defense |
| Elliott Wave target (Fibo 38.2%) | $64,800 | Short-term resistance |
| 20-day EMA | $70,200 | Immediate dynamic resistance |
| 50-day EMA | $74,000 | Major intermediate resistance |
| Double Bottom Neckline | $81,000 | Bullish acceleration pivot |
| Double Bottom Target | $108,000 | Post-breakout price objective |
4-Hour Chart (H4): Compression Triangle and MACD Golden Cross
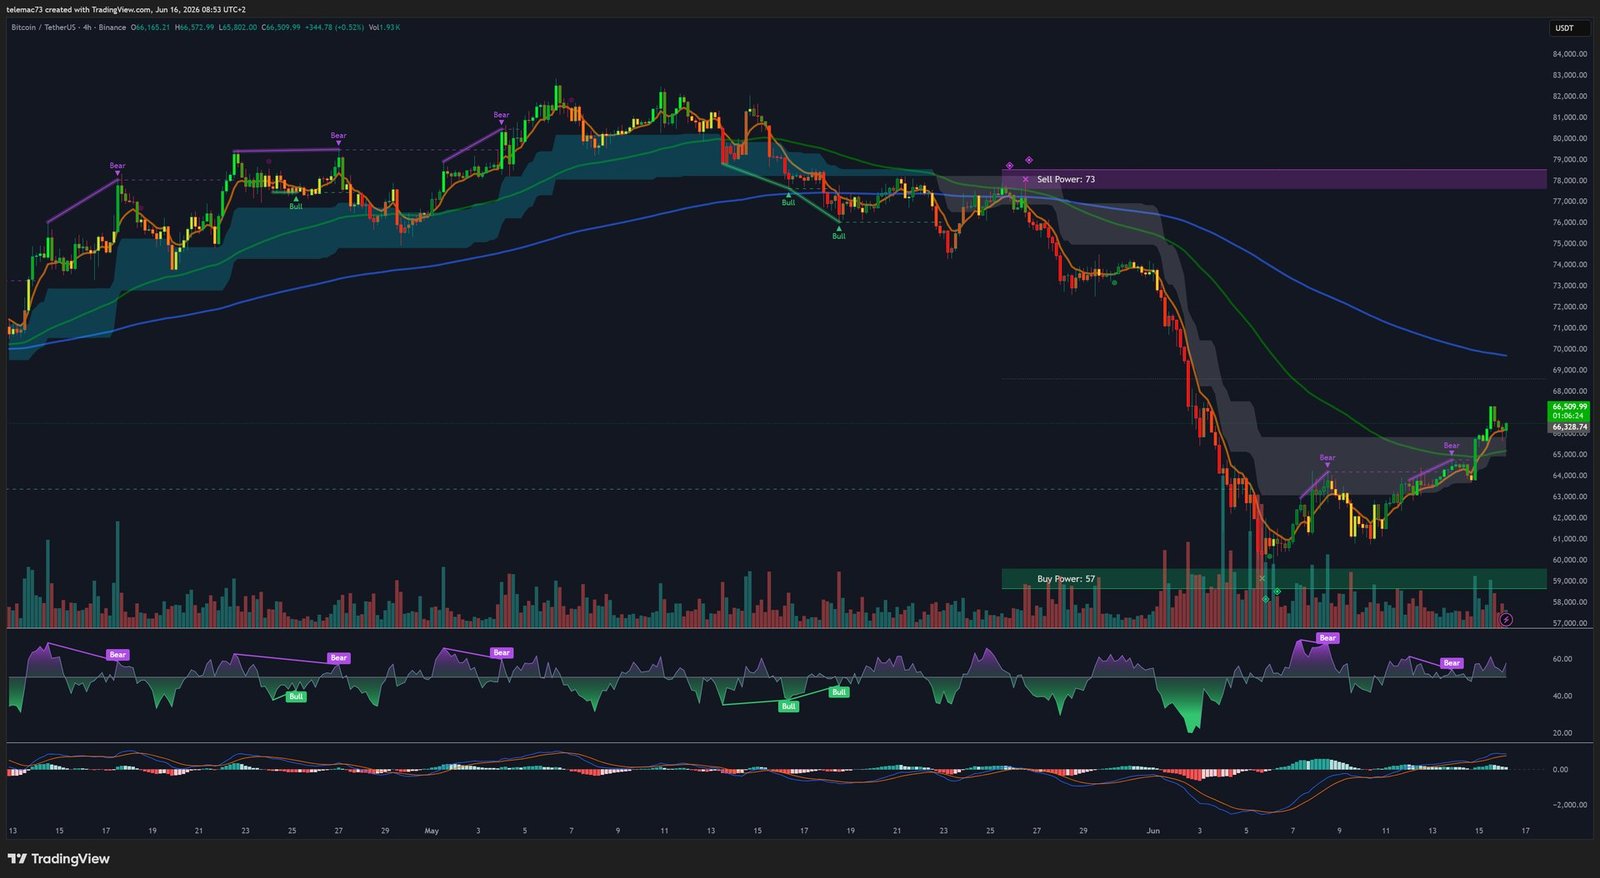
The H4 chart reveals a clear compression triangle: lower highs (descending resistance) and higher lows (ascending support), squeezing volatility and building kinetic energy for an explosive breakout. The H4 MACD has printed a Golden Cross (bullish crossover of the fast line above the signal line), signaling a rotation of short-term momentum in favor of buyers.
A confirmed breakout above $66,700 would open the path toward $68,000, a level concentrating massive short-side liquidity. However, beware of Bull Traps (false breakouts) in the absence of sustained institutional buying volume.
15-Minute Chart and Order Book Heatmap: Microstructure Revealed
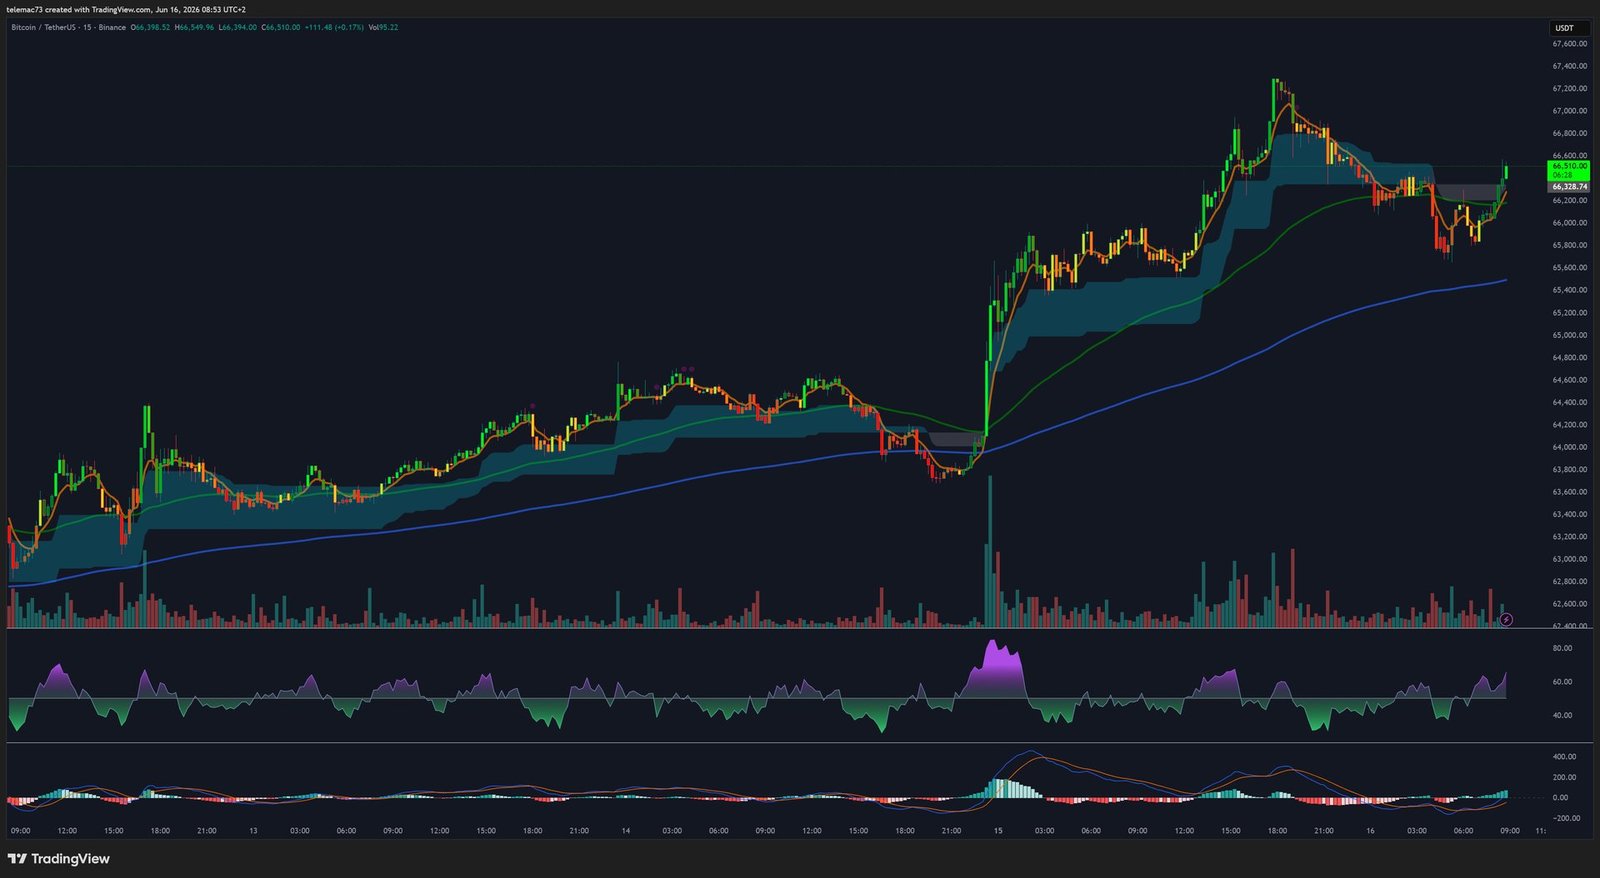
The CPI release triggered a violent red candle on the 15-minute chart, as HFT algorithms precipitated a plunge to $61,500. The revelation of the softer Core CPI immediately activated institutional accumulation algorithms, producing a textbook « V-shaped » recovery — the long lower wick left on the chart indicates overwhelming buying liquidity below $62,000.
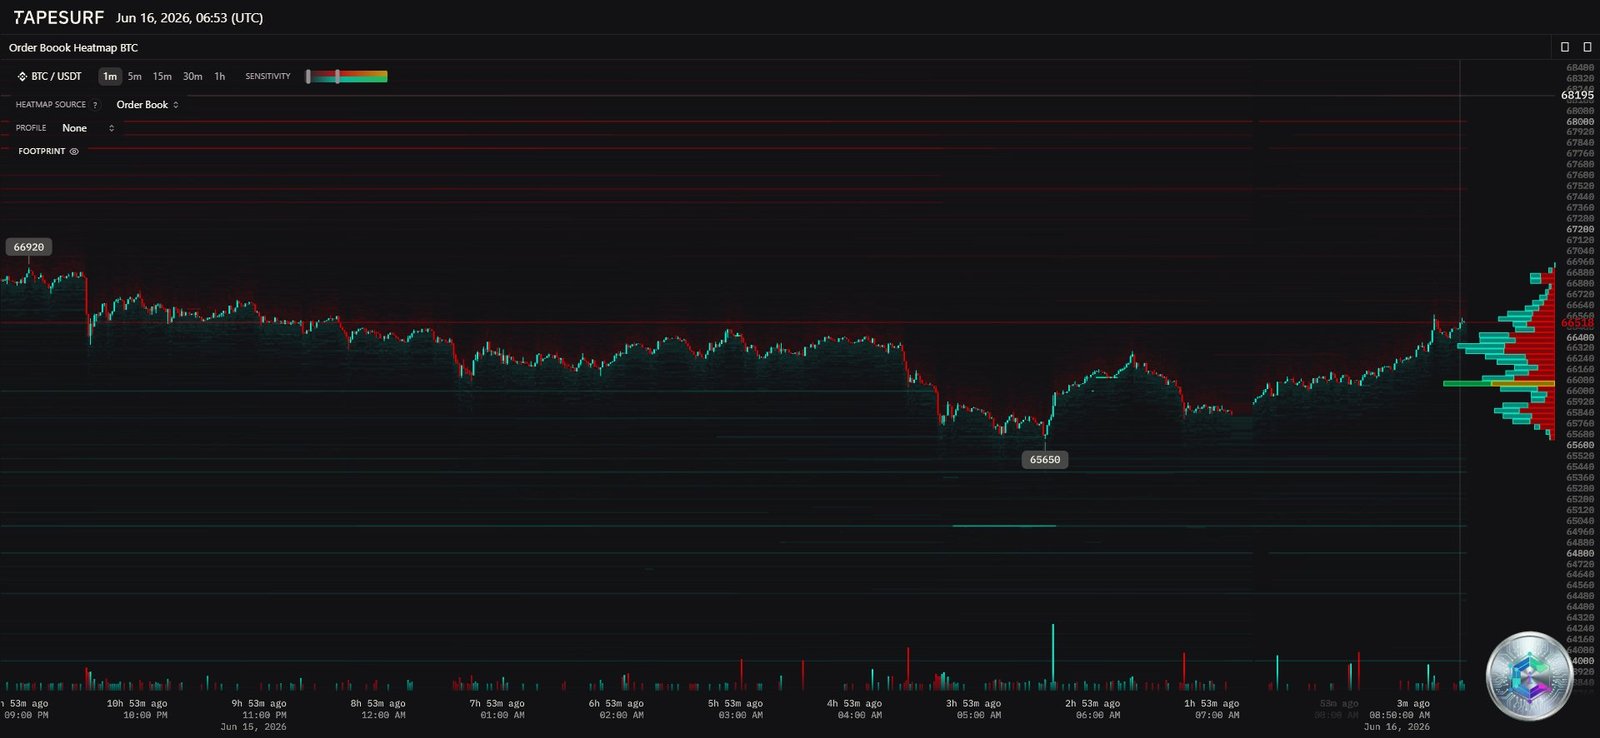
The Heatmap confirms the diagnosis: Open Interest collapsed from 285,000 to 255,000 BTC (complete flush of excess leverage), the $540M in liquidated shorts left a liquidity void in intermediate price levels, and massive Bid Walls are consolidating as a firm support barrier at $60,000–$61,000. The microstructure favors upward movement via the path of least resistance — but the ever-present risk of spoofing demands confirmation through real volume.
⛓️ On-Chain Fundamentals: Near-Historic Undervaluation
The on-chain footprint paints a remarkably compelling long-term picture:
- MVRV Z-Score at 0.41: The market trades at its intrinsic Fair Value. Historically, readings below 1 have consistently delineated generational accumulation zones.
- Fear & Greed Index: Plumbing depths only seen during the worst lows of prior bear market cycles.
- 200-Week MA ($61,300): Tested twice in June ($61,100 on June 6, $61,500 on June 10) with a bounce at each touch. A weekly close below this level would project toward $54,000 (300-week MA + realized cost basis confluence).
- Rainbow Chart: Historical anomaly — Bitcoin currently trades at a 53.5% discount below the « Fire Sale » band ($99,143), a level deemed impossible by the logarithmic model.
🗺️ Forward-Looking Scenarios: Three Possible Trajectories
🟢 Bullish Scenario — Breakout (Dovish Fed Pivot)
A dovish « Dot Plot » signaling rate cuts in late 2026 would reactivate ETF inflows, ending the $4.4B hemorrhage. Technically, this would trigger a bullish resolution of the H4 triangle, a break of the $81,000 neckline, and a structural price target at $108,000.
🔴 Bearish Scenario — Structural Capitulation (Hawkish Stance)
A persistently hawkish Fed in the face of the energy shock would amplify institutional outflows. The daily Death Cross would confirm, the $60,000 support would yield under cascading liquidations, projecting prices toward the $40,000–$46,000 zone by Q4 2026 (Galaxy Digital model).
🟡 Neutral Scenario — Sideways Attrition (Range Trading)
Statistically the most likely outcome following a 50% correction: a prolonged consolidation between $61,300 (200-week MA) and $70,200 (20-day EMA), grinding down retail psychology while Smart Money quietly accumulates. This environment breeds fertile ground for speculative memecoin activity while awaiting the systemic macro catalyst.
🔄 Capital Rotation and Memecoin Activity
Despite the apparent market desolation, stealthy capital flows animate high-beta sectors. While the global memecoin segment retreats 1.1%, surgical accumulation is detected on-chain. PEPE sees whale holdings grow from 181 to 183.6 trillion tokens. TRUMP displays a 3:1 Long/Short ratio among top traders on Hyperliquid. These sector rotations confirm that speculative capital isn’t fleeing — it’s waiting for the macro trigger to reignite the primary trend.
✅ Conclusion
Bitcoin’s ecosystem in June 2026 presents a rare configuration: near-historic on-chain undervaluation (MVRV at 0.41, daily RSI rebounding from 16) combined with emerging chartist reversal signals (Double Bottom, H4 Golden Cross, weekly RSI divergence) — yet set against a still-uncertain macro backdrop (decisive FOMC, persistent energy shock). The final verdict belongs to the Federal Reserve. The $60,000–$61,500 zone remains the absolute line of demarcation: as long as it holds, bulls retain their chance to reverse the dominant trend.
⚠️ Disclaimer: This article is written for educational and informational purposes only. It does not constitute investment advice, nor a recommendation to buy or sell any digital asset. Cryptocurrency markets are highly volatile. Any investment decision should be made after consulting a licensed financial advisor and based on your personal financial situation. You are solely responsible for your financial decisions.