
The digital asset ecosystem is navigating historically turbulent waters in June 2026. Bitcoin (BTC), the sector’s benchmark asset, has suffered a devastating devaluation, plunging below the critical threshold of $60,000 — a level not seen since October 2024. This brutal contraction, which erases a substantial portion of the gains accumulated during Q1’s institutional euphoria, materializes the convergence of relentless macroeconomic pressures, systemic geopolitical upheavals, and a profound alteration of the crypto market’s microstructure.
I. The Macroeconomic Environment: Stagflation and Monetary Headwinds
The Federal Reserve’s Dilemma Amid Resurgent Inflation
June 10, 2026 is marked by palpable anxiety on financial markets, as traders await the Bureau of Labor Statistics’ Consumer Price Index (CPI) release for May. Projections from institutions such as Goldman Sachs and Vanguard anticipate an acceleration in headline inflation to 4.2% year-over-year (up from 3.8% the prior month), with core CPI expected at 2.9%.
This inflationary resilience destroys the narrative of imminent monetary easing. The FOMC, meeting on June 16-17 under new chairman Kevin Warsh, faces a macroeconomic equation of rare complexity. Nearly 70% of economists now forecast the Fed funds rate will remain in its current 3.50%–3.75% range for the entirety of 2026. On prediction market platform Kalshi, the implied probability of a hold stands at a crushing 98%. This « higher for longer » dynamic is pushing the 10-year Treasury yield to 4.82%, mechanically increasing the opportunity cost of holding Bitcoin.
| Indicator | Previous Value | Forecast | BTC Impact |
|---|---|---|---|
| Headline CPI (YoY) | 3.8% | 4.2% | 🔴 Strongly Bearish |
| Core CPI (YoY) | — | 2.9% | 🔴 Bearish |
| Fed Funds Rate | 3.50–3.75% | Hold (98%) | 🔴 Bearish |
| 10-Year Treasury Yield | ~4.64% | 4.82% | 🔴 Strongly Bearish |
The Geopolitical Shockwave: The US-Iran Conflict
The unfavorable macro backdrop is dramatically exacerbated by escalating Middle East tensions. Israeli airstrikes on southern Beirut, Iranian ballistic missile salvos on Israeli territory, and the destruction of a US AH-64 Apache helicopter by an Iranian drone off the coast of Oman on June 8th — the situation reached its apex with President Trump’s declaration demanding a « proportional response. »
Contrary to the idealized « digital gold » narrative, Bitcoin empirically behaves as a high-beta risk asset during geopolitical crises. Physical gold, by contrast, maintains firmly above $4,300/oz. The Strait of Hormuz threat has triggered a 18% year-over-year surge in energy prices, feeding inflation the Fed cannot ignore.
II. Institutional Architecture: The Perfect Storm of Capital Flows
The Historic Hemorrhage of Spot Bitcoin ETFs
The first week of June 2026 will go down in history: the US Spot Bitcoin ETF complex recorded its largest net redemption wave ever, with a staggering outflow of $3.4 billion in a single week. This institutional capitulation follows a devastating 11-day consecutive streak of net outflows totaling over $1.42 billion.
BlackRock’s iShares Bitcoin Trust (IBIT) — the institutional confidence barometer — endured its worst sequence since inception: $1.2 billion in outflows over 4 days, culminating in a single-session withdrawal of $448 million. A $1.29 billion dark pool block trade (29.2 million IBIT shares) illustrates major players’ intent to liquidate without instantly collapsing public order books.
| Event | Magnitude | Implication |
|---|---|---|
| Global ETF Net Outflows (1 week) | −$3.4B | Collapse of institutional marginal demand |
| IBIT BlackRock Outflows (4 days) | −$1.2B | Asset management leader in full retreat |
| IBIT Dark Pool Block Trade | −$1.29B | Masked institutional liquidation |
| Pre-CPI Outflow Streak | 11 consecutive days | Systematic algorithmic risk aversion |
| Forced Derivatives Liquidations (24h) | $1.77B | Massive leverage purge (330,344 traders) |
MicroStrategy’s Psychological Pivot
The most symbolic event involves MicroStrategy (MSTR). Michael Saylor, the apostle of « never sell, » was forced to break his own dogma: in a Form 8-K filing with the SEC, the company revealed selling 32 bitcoins (≈$2.5M) to service dividends on its STRC preferred shares (11.50% yield). Despite being negligible against the firm’s 845,256 BTC treasury, the psychological shockwave was devastating — the first sale since December 2022.
Attempting damage control, Saylor immediately orchestrated a buyback of 1,550 BTC for $101.3M (avg. price: $65,332), funded through ATM equity sales. The narrative of inelastic, perpetual accumulation is cracked, exposing the systemic risk of heavily indebted corporate treasuries facing a potential debt spiral.
III. Microstructural Analysis: The Order Book Heatmap
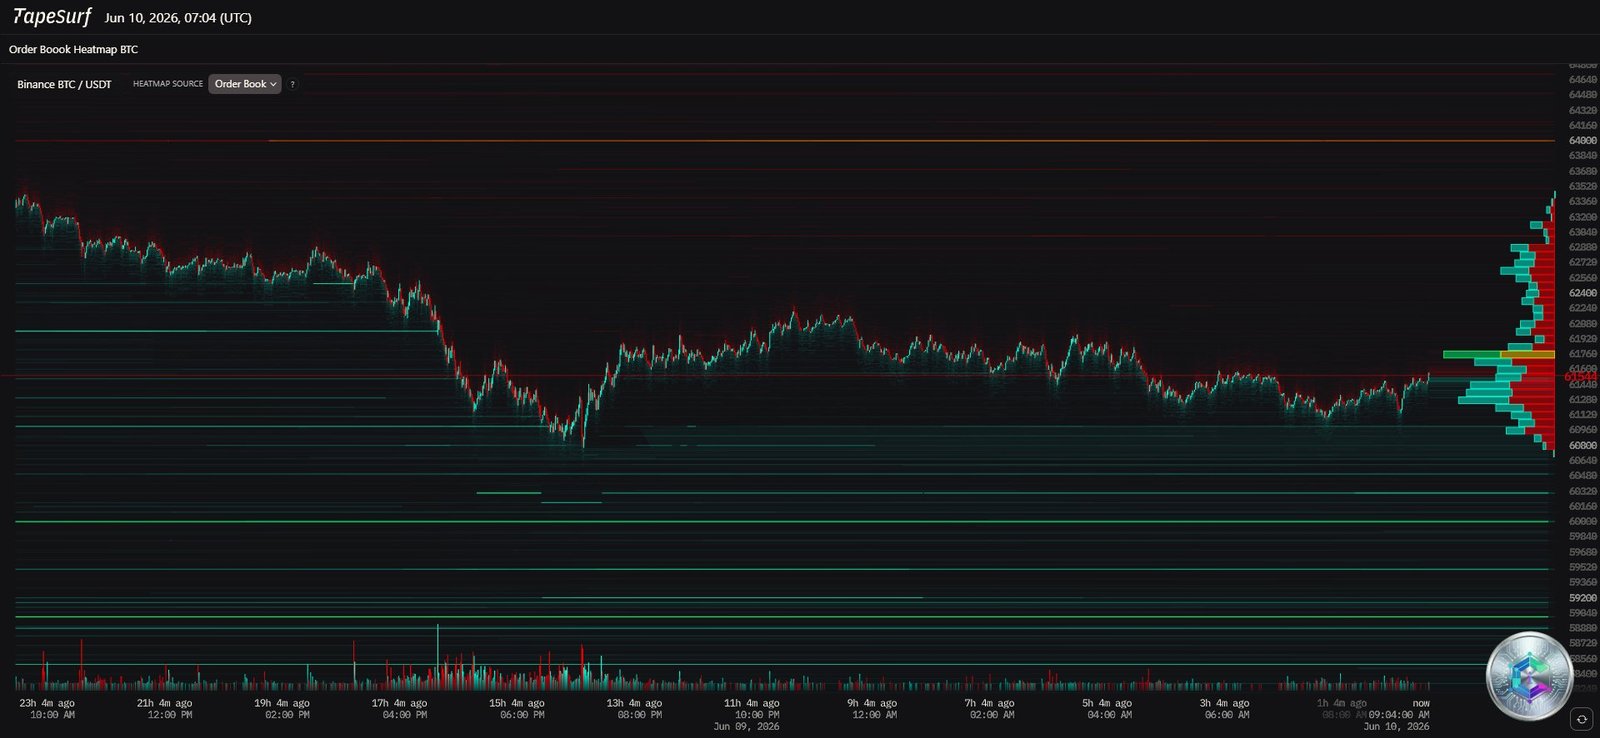
The TapeSurf Heatmap (Binance BTC/USDT, captured June 10 at 07:04 UTC) reveals the real state of the order book with surgical precision. The asymmetry is glaring:
- Colossal sell wall at $64,000–$65,000: dense scarlet horizontal lines indicate a massive accumulation of limit sell orders. Any bounce toward this zone is systematically absorbed by HFT algorithms distributing their inventory.
- Liquidity Hunt: the buy walls at $65,000 and $64,000 were systematically destroyed by institutional market orders. Serious buying liquidity has repositioned much lower, between $56,000 and $59,000.
- Liquidation amplification: $1.77 billion liquidated in 24 hours, 330,344 traders wiped out, with $1.5 billion from long positions alone.
IV. Multi-Timeframe Chart Analysis
Daily Chart (1D): The Macrostructure in Ruins
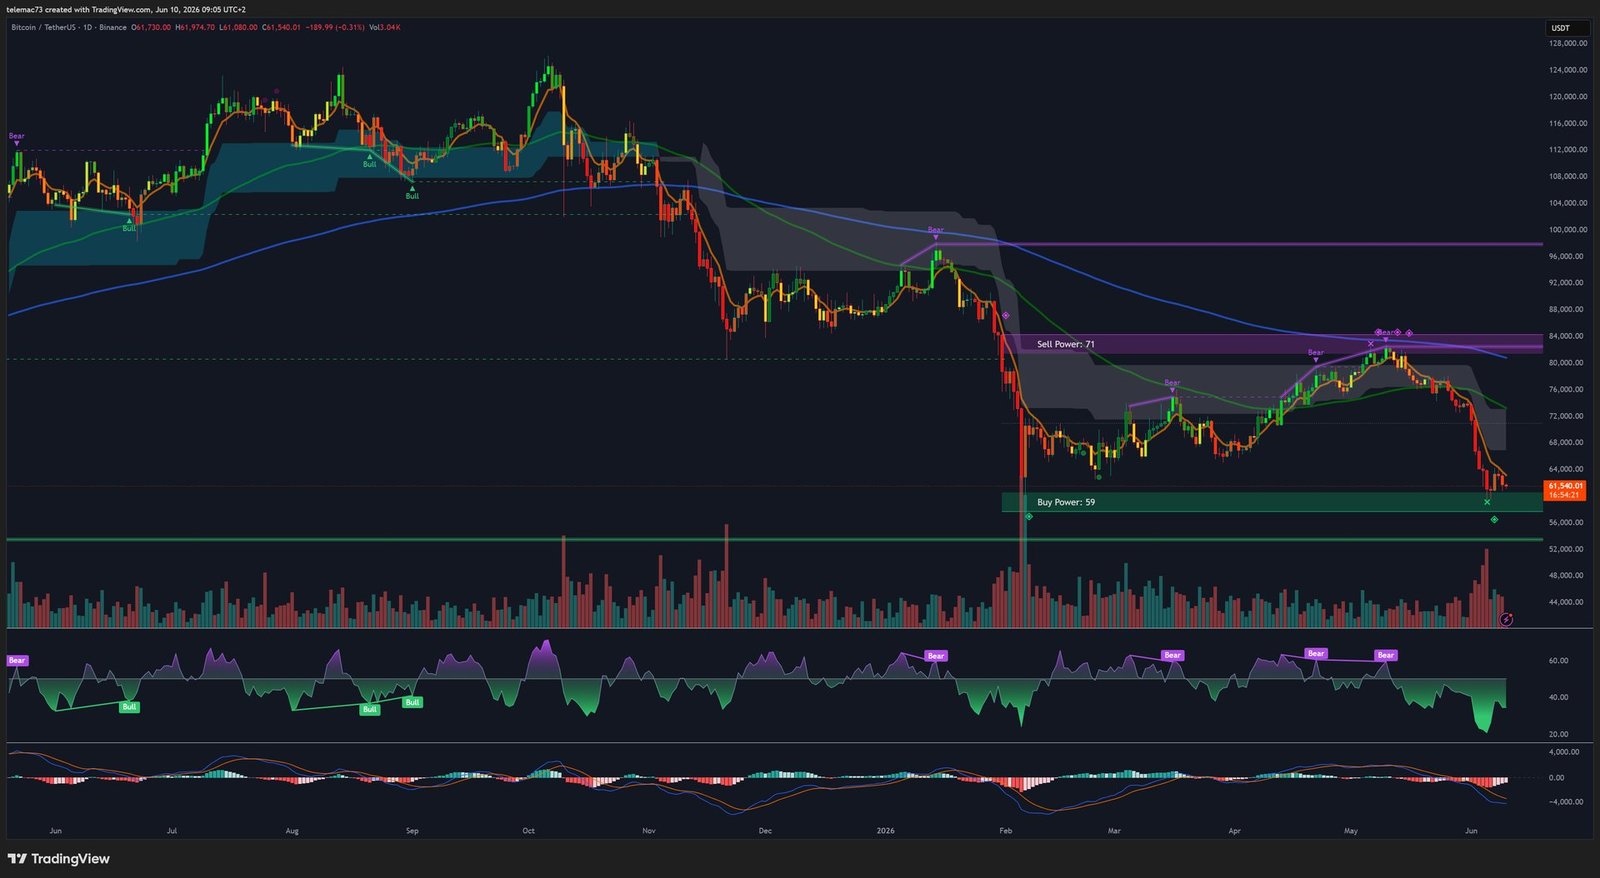
The daily chart paints the portrait of an asset whose macrostructure is deeply degraded:
- Ichimoku Cloud (Kumo) breakdown: the crash candle decisively pushed price below the cloud’s lower boundary — one of the most powerful bearish signals in Ichimoku theory. The market is no longer correcting within a bull market: the genesis of a multi-month bear market is formally validated.
- Loss of the 200-day SMA and Short-Term Holders’ realized price: algorithmic trend-following CTAs have flipped to the short side. Virtually all recent buyers are now underwater, creating overwhelming psychological pressure toward panic liquidation.
- MACD Death Cross: the MACD line has crossed its signal below zero, with the histogram in expanding bearish territory — proving the downward momentum is still intensifying.
- Extreme RSI oversold with no detectable bullish divergence — a relief bounce cannot materialize until forced liquidations are fully exhausted.
4-Hour Chart (H4): The Anatomy of Distribution
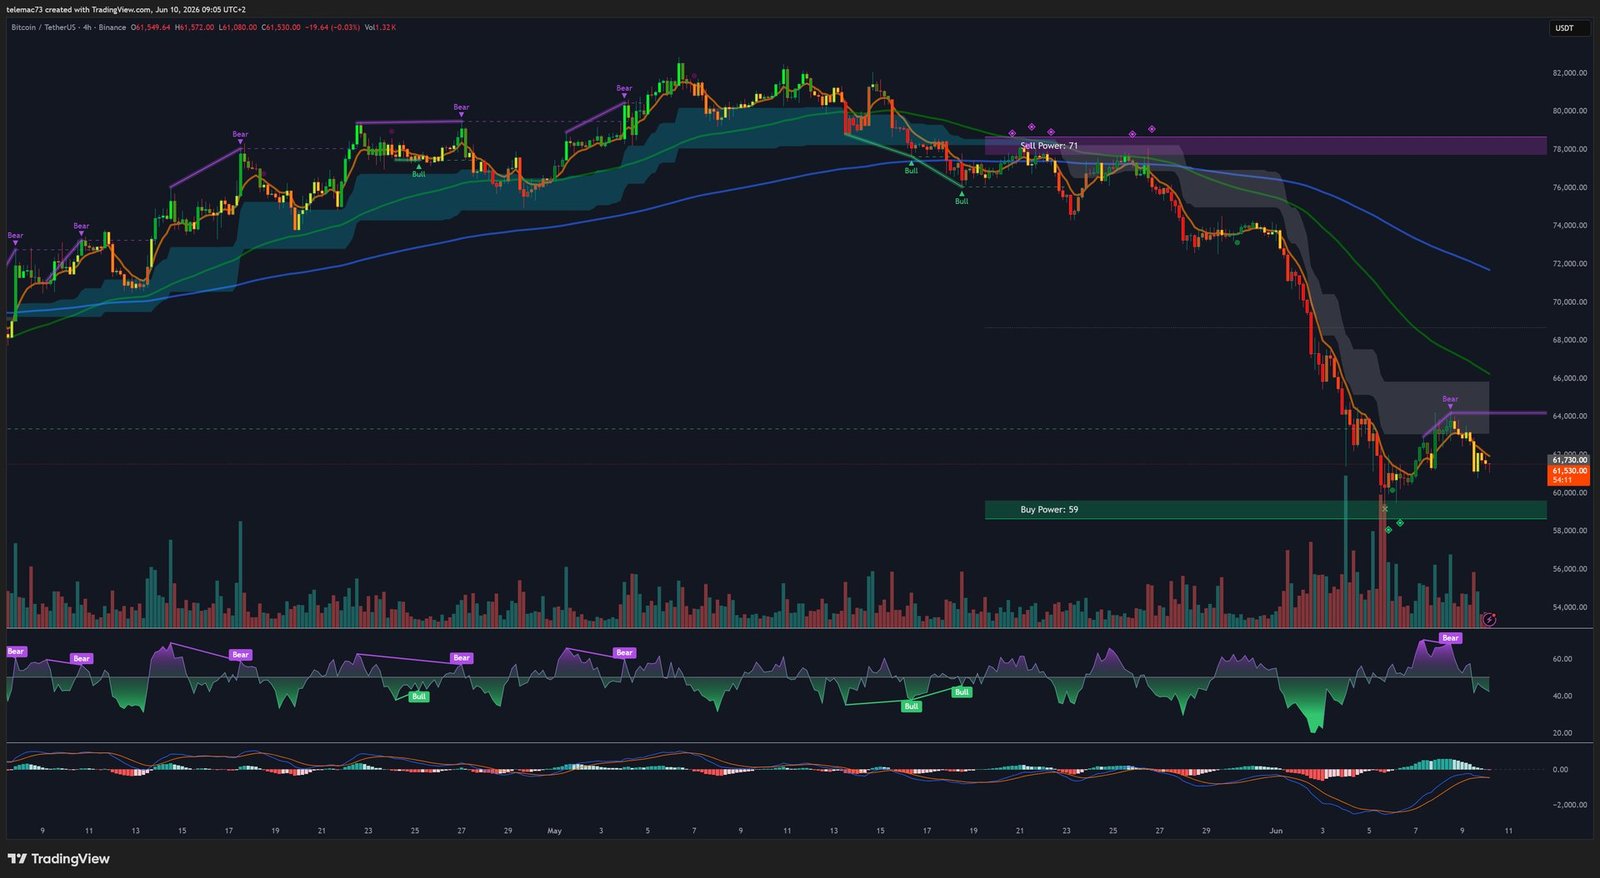
The H4 chart reveals the precise mechanics of the ongoing distribution:
- Series of validated Bear Flags: each sharp drop is followed by a brief oblique consolidation, then a new leg down of equal magnitude. The flagpole → body → breakdown pattern, repeated methodically.
- Impenetrable dynamic resistance: the green moving average (analogous to an EMA 50) crushes prices from above. Any bounce toward $64,000–$65,000 (the « Sell Power: 71 » zone) will be interpreted by algorithms as an ideal shorting opportunity.
- RSI below 20 at the trough; MACD still deeply entrenched below zero. The market holds its breath, suspended before the US CPI verdict.
15-Minute Chart (M15): The Pre-CPI Compression Triangle
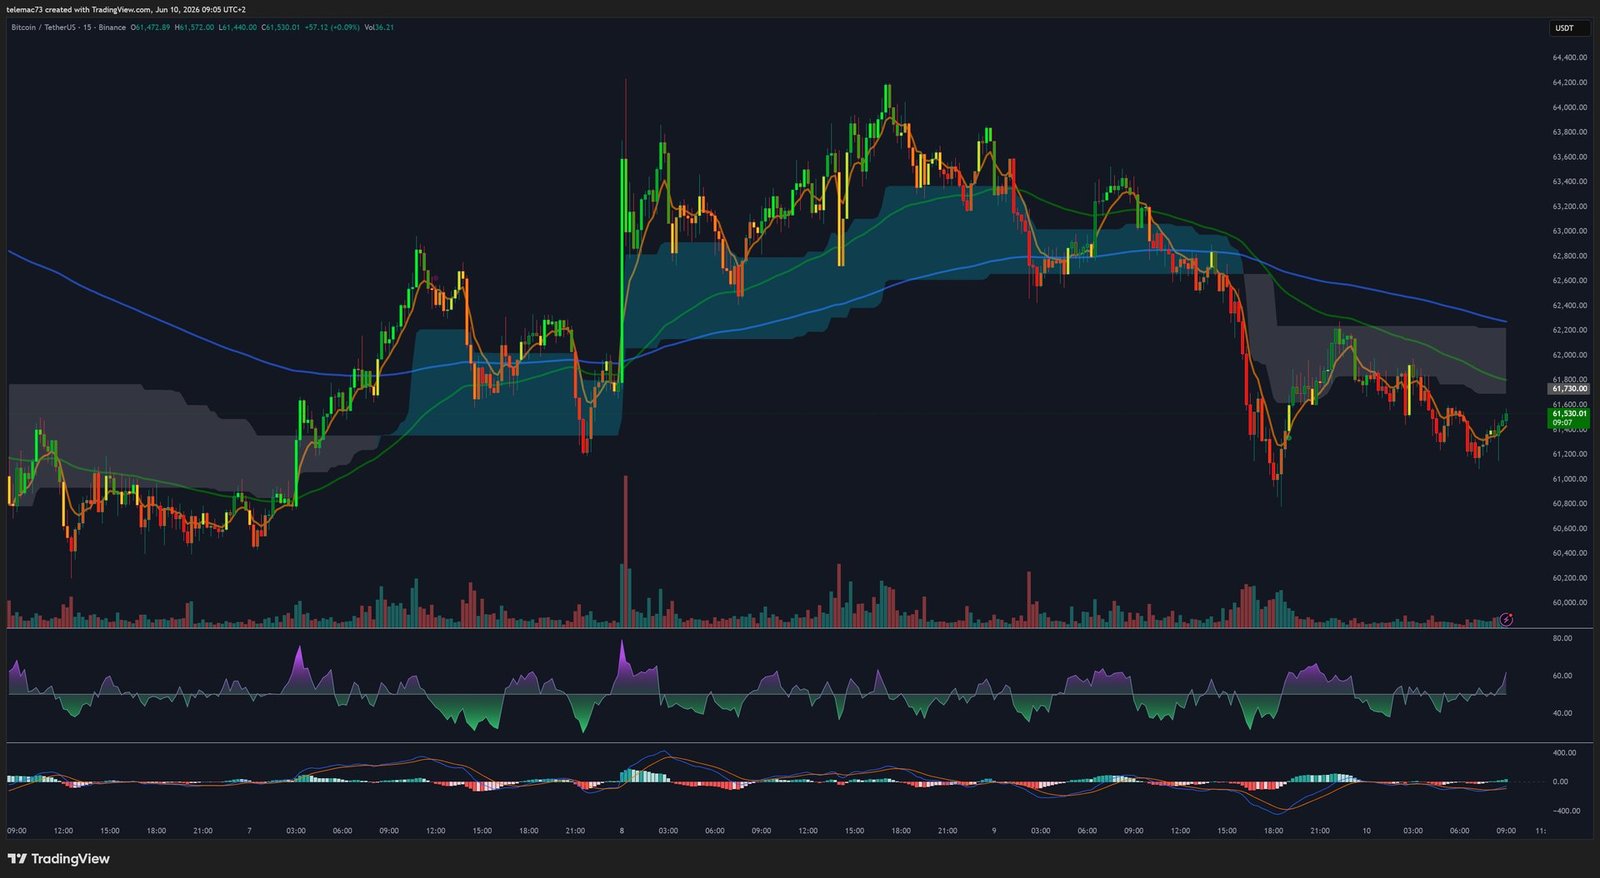
The M15 chart exposes the algorithmic violence of the short-term market:
- Stop-Hunting and the « Saylor Effect »: the oversized wicks reveal algorithmic manipulation. Saylor’s June 7th tweet triggered an artificial 4% pump above $64,000, immediately fully retraced for lack of institutional volume.
- Symmetrical Compression Triangle: volatility contracts sharply around a flattened moving average. Statistically a bearish continuation pattern: the downward breakdown is the path of least resistance, set to be triggered by the CPI figures.
- Noisy RSI and MACD: the frantic crossovers on M15 are false signals generated by the range. Professional analysis demands ignoring these indicators and waiting for the triangle’s resolution.
V. Global Technical Matrix
| Category | Observations (1D / H4 / M15 / Heatmap) | Interpretation |
|---|---|---|
| Supports | $60,000 (psychological) → $58,000–$59,000 (H4 « Buy Power ») → $53,000–$55,000 (macro) | 🔴 High risk of capitulation to $53K on macro shock |
| Resistances | $63,500–$64,000 (H4 MA) → $65,000 (former support turned resistance) | 🔴 Glass ceiling until positive ETF flows return |
| Ichimoku / MAs | Price below Kumo, below 200 SMA, all MAs descending | 🔴 Macroscopic trend reversal confirmed |
| RSI / MACD | Extreme oversold, no divergence. MACD Death Cross expanding. | 🔴 Purely bearish momentum |
| Chart Patterns | Iterative H4 Bear Flags + M15 Symmetrical Triangle | 🔴 Bearish continuation awaiting catalyst |
VI. Probabilistic Scenarios — Second Half of June 2026

🔴 Scenario 1 — Macroeconomic Capitulation (Probability: High)
May CPI ≥ 4.2%, ultra-hawkish Warsh at FOMC, Strait of Hormuz escalation. The M15 triangle breaks down, the $60,000 support is obliterated. Target: $53,000–$55,000 zone (−11% from current levels) where a macroscopic Bear Trap could form, laying the groundwork for a potential future reversal.
🟡 Scenario 2 — Horizontal Consolidation (Probability: Medium)
Lukewarm CPI, no surprise. ETF outflows slow without reversing. BTC enters a lateral distribution purgatory between $58,000 and $63,500, while sector rotation continues favoring AI stocks and DeFi protocols (Hyperliquid +160% YTD).
🟢 Scenario 3 — Disinflationary Miracle and Short Squeeze (Probability: Low)
Unexpected Core CPI < 2.7% + Gulf diplomatic de-escalation. Extreme pessimism (oversold RSI, low OI) produces a violent short squeeze. Targets: $65,000 → $68,000 by August, invalidating the daily Death Cross. A contrarian scenario but technically explosive if triggered.
Conclusion
Bitcoin in June 2026 is trapped in an unprecedented macroeconomic and technical vice. The loss of $65,000 triggered an algorithmic mutation, transforming inelastic accumulation into high-pressure distribution. The path of least resistance points toward a painful but necessary test of the $53,000–$55,000 zone — the only level likely to harbor the liquidity needed to purge the final leverage and forge the foundations of a new market cycle.
Long-term, absolute scarcity DCA models continue to project parabolic post-cycle valuations. The buying windows offered during macro crashes are paradoxically the only viable accumulation opportunities at still-accessible prices.
⚠️ Disclaimer: This article is written for educational and informational purposes only. It does not constitute investment advice or a recommendation to buy or sell any asset. Cryptocurrency markets are extremely volatile. All investments carry risk, including the total loss of capital invested. Please consult a licensed financial advisor before making any investment decision.